QVML - 2022's Volatility Continues Into 2023 For The S&P 500
Summary
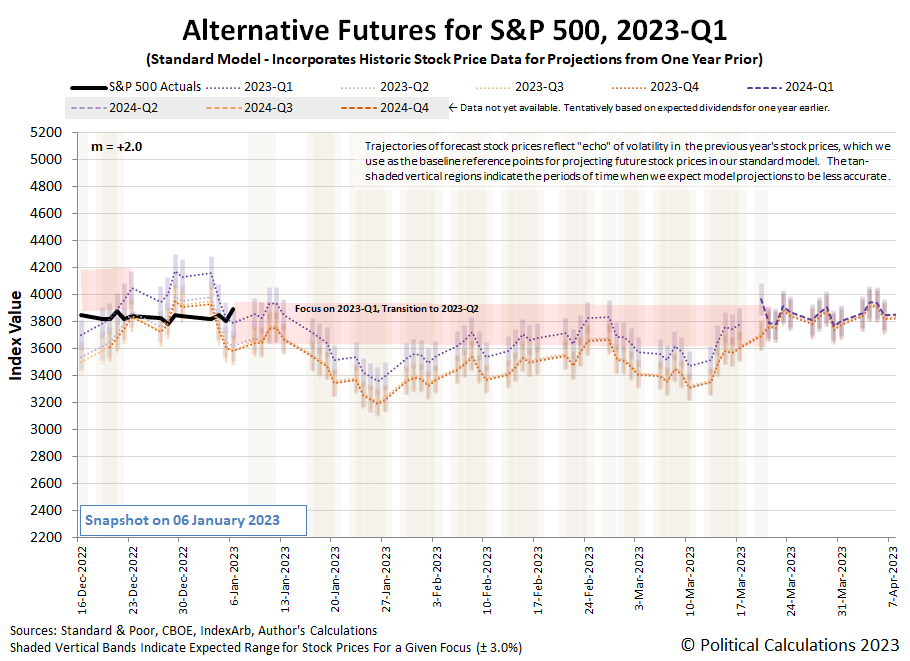
- The first week of trading in 2023 saw the S&P 500 (SPX) rise 1.4% over where it ended 2022, closing the week at 3,895.08.
- The CME Group's FedWatch Tool continues to project quarter-point rate hikes at both the Fed's upcoming 1 February and 22 March (2023-Q1) meetings, with the latter representing the last for the Fed's series of rate hikes that started in March 2022.
- Looking beyond 2023-Q1, we're afraid that we'll be adding multiple redzone forecast ranges to the alternative future charts throughout 2023 to compensate for the effect of past stock price volatility on the projections of the dividend futures-based model.
The first week of trading in 2023 saw the S&P 500 ( SPX ) rise 1.4% over where it ended 2022, closing the week at 3,895.08 .
That rise was assisted by the first Lévy flight event of 2023, as investors shifted their forward-looking attention back to the current quarter of 2023-Q1 from 2023-Q2. The first look at the alternative futures chart for 2023-Q1 shows that recent development.
That shift continues the chaotic volatility that characterized 2022, which saw no fewer than 15 Lévy flights prompted as investors shifted their forward-looking focus from one point of time in the future to another. Like those events, the first Lévy flight event of 2023 was prompted by changing expectations for how the U.S. Federal Reserve will be setting interest rates in the months ahead. During the past week, investors' time horizon pulled back in toward the current quarter of 2023-Q1 as new information about the state of the U.S. economy brought with it the expectation this quarter will see the last of the Fed's ongoing series of rate hikes.
Here are the market-moving headlines from the week that was that summarize the new information investors absorbed:
Tuesday, 3 January 2023
- Signs and portents for the U.S. economy:
- Bigger trouble developing in Asia:
- Trouble not as bad as expected in Eurozone:
- Bigger stimulus still developing in China:
- China seeing some positive economic signs after lifting failed zero-COVID policy:
- Wall St starts the year with a dip; Apple, Tesla shares drag
Wednesday, 4 January 2023
- Signs and portents for the U.S. economy:
- Fed minions fear Americans think they'll pivot from fighting inflation to fighting recession:
- Bigger trouble developing in Japan, BOJ minions want to continue never-ending stimulus, JapanGov minions want more stimulus:
- Eurozone recession may not be as deep as feared:
- S&P closes higher after Fed minutes confirm inflation focus
Thursday, 5 January 2023
- Signs and portents for the U.S. economy:
- Fed minions say economy won't crash into recession, will keep rates high to fight inflation:
- Bigger trouble developing in China:
- BOJ minions
- Wall St drops more than 1% with jobs data feeding fears of more Fed tightening
Friday, 6 January 2023
- Signs and portents for the U.S. economy:
- Fed minions say slower rate hikes are okay going forward as economy slows, blame Chinese government's zero-COVID policies for supply chain problems:
- Bigger stimulus developing in China:
- ECB minions hint they're done with rate hikes if inflationary shocks stop:
- Wall St rallies as jobs, services data calm rate hike worries
The CME Group's FedWatch Tool continues to project quarter-point rate hikes at both the Fed's upcoming 1 February and 22 March (2023-Q1) meetings, with the latter representing the last for the Fed's series of rate hikes that started in March 2022. The FedWatch tool then anticipates the Fed will maintain the Federal Funds Rate at a target range of 4.75-5.00% through November 2023. After which, developing expectations for a U.S. recession in 2023 have the FedWatch tool projecting a quarter-point rate cut in December (2023-Q4).
The Atlanta Fed's GDPNow tool's latest projection for real GDP growth in the fourth quarter of 2022 rose a notch to +3.8% from last week's +3.7% estimate. The BEA will issue its first estimate of 2022-Q4's GDP later this month, on 26 January 2023.
Going back to the new alternative futures chart, we've added a redzone forecast range to represent where the trajectory of the S&P 500 is likely to go based on the assumption that investors will progressively shift their forward-looking focus from 2023-Q1 to 2023-Q2 during the next 10 weeks. That assumption itself is almost certainly wrong, simply because in all likelihood, stock prices will be more volatile than the redzone forecast range suggests. We think it may still be useful however because it provides a frame of reference for telling which quarter investors are focusing upon as they reach the random onset of new information. During the next six weeks or so, the level of the S&P 500 running above the centerline of the range will indicate investors are focusing mainly on 2023-Q1 while running below the centerline would indicate 2023-Q2 is where they've set their time horizon.
Looking beyond 2023-Q1, we're afraid that we'll be adding multiple redzone forecast ranges to the alternative future charts throughout 2023 to compensate for the effect of past stock price volatility on the projections of the dividend futures-based model . The model uses historical stock prices as the base reference points for its forecasts, where its raw projections are affected by the echoes of past volatility. Given 2022's high level of volatility, that's to be expected and will be one of the major challenges we face in analyzing the behavior of stock prices this year.
Editor's Note: The summary bullets for this article were chosen by Seeking Alpha editors.
For further details see:
2022's Volatility Continues Into 2023 For The S&P 500