AFMC - 2023: The Year Ahead
Summary
- Much of the 2022 flavor of the polycrisis focused on the danger side. But there are opportunities to be explored as well.
- As we look ahead to 2023, we are at the same time mindful of the potential threats that await and the opportunities that may present themselves as everything changes, all at once.
- We expect that the US equity market will find its footing sometime in H1 and eventually deliver a positive performance. In the bond market, we expect to see some widening of credit risk spreads, while Treasuries should stabilize once the Fed reaches the terminal rate in its tightening cycle.
- The US is due for a cyclical recession this year. Here we present a larger context and explain why, even if a recession does come to pass in 2023, we are not inclined to panic and move into an ultra-defensive posture in our portfolio allocations.
Everything, All At Once
A. Polycrisis, Poly-opportunity
Every year has its expressions - those words or phrases that sum up the fleeting zeitgeist. Remember "Bridge to the 21st Century?" Probably not, because its day in the sun was way back in 1997, and in any case, this century of ours has so far turned out to be quite different from those hopeful exhibits and Fleetwood Mac soundtracks that festooned the National Mall at the beginning of Bill Clinton's second term as president. But here we are nearly a quarter-way into the 21st century, and one of the defining expressions of our time is "polycrisis." In 2022, this word gained a large following, thanks in no small part to Adam Tooze, a Columbia University professor whose "Chartbook" newsletter is a weekly must-read for economists, financial markets chroniclers and historians of all stripes.
The idea behind "polycrisis," of course, is that we live in an age where we are dealing with multiple problems at the same time. Some of the problems are clear and present, like persistently high inflation requiring dramatic central bank intervention to bring it down via high interest rates. Others are urgent but slower-moving, like ageing demographics and climate change. Still others simmer menacingly and occasionally boil over, like geopolitical tensions. In a polycrisis world, though, there is at least one problem you can write about every day without sounding like a broken record. Such was the case in 2022.
About the word "crisis," though. Many years ago, we featured the Chinese character for "crisis" in the design of some of our marketing material. The character, we noted at the time, is an amalgam of the characters for "danger" and "opportunity." That's something worth remembering today. Much of the 2022 flavor of the polycrisis focused on the danger side. But there are opportunities to be explored as well. As we look ahead to 2023, we are at the same time mindful of the potential threats that await and the opportunities that may present themselves as everything changes, all at once.
Shocked Out Of Apathy
There is, we believe, a great deal of wisdom in that juxtaposition of danger and opportunity contained in the Chinese character. Sometimes it takes a bit of peril to concentrate the mind and shake off the apathy that may have gotten you into danger in the first place. One example that comes very readily to mind is Russia's invasion of Ukraine. That crisis grabbed the world by the throat on February 24 last year. Many of us will remember the constant buzz of the phone in the middle of the night, as Russian troops, eight time zones away, poured over the border into Ukraine and lit up newsrooms from Mumbai to Miami. On February 24, it was hard to be too optimistic about anything. Russia had the superior army, we imagined, and Ukraine was bound to fall and hand the thuggish dictator Vladimir Putin the prize he had long been coveting, his imaginary "Greater Russia" back under Moscow's thumb.
Of course, it did not turn out that way at all. Ukraine and its leader Volodymyr Zelenskyy fought back from day one of the invasion and never stopped fighting, turning Putin's hoped-for triumph into a personal humiliation for him, his kleptocratic government and his woefully outdated military strategists. For the democratic West, there was an opportunity here, and the opportunity was taken. Sweden and Finland lined up to join NATO, which would extend the border of Putin's nemesis up to just a hundred-odd kilometers from St. Petersburg. Germany reversed decades of neutrality to join the coalition providing military aid to Ukraine. In a very real way, the West, so beleaguered recently by polarization and rising anti-democratic sentiments, found its footing in response to the Ukrainian crisis. The war is by no means over, nor is the strength of the Western alliance in any way guaranteed. Our troubled political climate remains vulnerable to uncertain future electoral outcomes. But in 2022, when it mattered most, the coalition delivered.
A Rich History of Dystopias
History is full of similar examples of opportunity proceeding from danger. We have a habit, as humans, of seeing certain problems as being insurmountable. Think of all the dismal worlds imagined in futuristic books and movies - the planet eviscerated by uncontrollable climate change, or cities wiped off the map by nuclear war, or humankind reduced to being the servile pets of far superior AI-powered beings. Near the turn of the nineteenth century, the English cleric and economist Thomas Robert Malthus put forth the seemingly incontrovertible argument that humanity was doomed to perish by means of famine. The world's population was growing at a rate faster than the ability to produce food. Eventually - and by "eventually" Malthus meant the not-too-distant future - the world would simply run out of food. Humankind would cease to be.
Since we know today that nothing of the sort happened, it can be easy to dismiss Malthus as some old crank, howling "the end is near!" at bemused passers-by from a soapbox in Hyde Park. But in 1798, the year his "Essay On the Principle of Population" was published, all the evidence suggested that his argument was ironclad. The world had barely grown, in economic terms, from the time humans began to settle in agriculture-oriented villages to Malthus's present day. Economic productivity was constrained by the limitations of human and animal labor. The key insight of Malthus's paper was that the means of subsistence will only progress in a linear fashion, while the population, if left unchecked, will expand geometrically.
What happened instead is that starting about 40 years after Malthus's death, the world economy began a growth trajectory unlike anything ever before experienced. The average annual growth rate from 1870 to 2010 would become 2.1 percent, as compared to the estimated growth rate of just 0.04 percent per year from the time of the first Egyptian pharaohs to the nineteenth century. The population did grow as Malthus predicted, but economic productivity grew faster. Malthus had no way of knowing any of this. Although some of the first fruits of the First Industrial Revolution, like the steam engine and the cotton gin, were already in operation by 1798, it was not until the second half of the century that inventions like electricity and the internal combustion engine completely radicalized the potential for growth.
Just one month ago, scientists at Lawrence Livermore National Laboratory announced a successful test in producing nuclear fusion ignition - a reaction that produces more energy than it consumes. This points the way - not tomorrow, not next year or even five years from now but at some point - of our being able to rely on clean (green) fusion energy and to entirely abandon our reliance on fossil fuels. It won't solve the immediate challenges we face from extreme weather events as the planet warms and carbon emissions remain unchecked despite the best intentions of our annual climate summits. But it also reminds us that problems have a way of producing answers to them.
With this in mind, let's take a look at some of the real challenges we do have to deal with in the year ahead and beyond as we grapple with the polycrisis. From an economic standpoint, the key variables on the minds of many are the persistence of inflation and the fear of a recession. These variables will play out in the coming months. In the short term, at least, there are signs that inflation has peaked and is slowly abating. But there is a more structural issue at hand that will likely have an ongoing effect on both inflation and the labor market. These happen to be the two pillars of the Federal Reserve System's formal mandate - to preserve price stability while facilitating the maximum possible level of employment. The issue is a significant turning point in global demographics.
B. Demography Isn't Destiny, But…
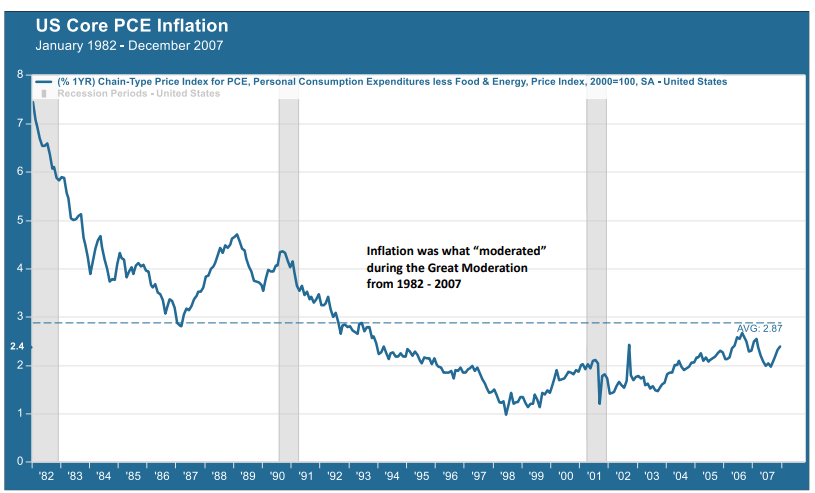
The period from around 1982 to 2007 was a quarter-century often referred to as the "Great Moderation." The main thing that was "moderated," permitting a long run of economic growth broken up by only two relatively brief recessions (in 1990 and 2001), was inflation. Over this entire period, the average inflation rate as measured by the core Personal Consumption Expenditure (PCE) index, which is the Fed's preferred inflation metric, was 2.9 percent. If you move the start date up to 1990, the average core CPI rate was just 2.2 percent, right around the Fed's longstanding target.
Credit for setting the Great Moderation into gear is usually given to Paul Volcker, the Federal Reserve Board of Governors chairman who initiated a draconian series of interest rate hikes over a period of several years starting in 1979 in order to bring down the persistently high inflation of the 1970s. Volcker's accomplishment is evident in the chart below, where you can see inflation steadily plummeting from near-double digits at the beginning of 1982. But the Volcker Fed was not the only thing pushing down prices.
Chart #1: US Inflation (Core PCE), 1982-2007 (Bureau of Labor Statistics, MVF Research, FactSet)
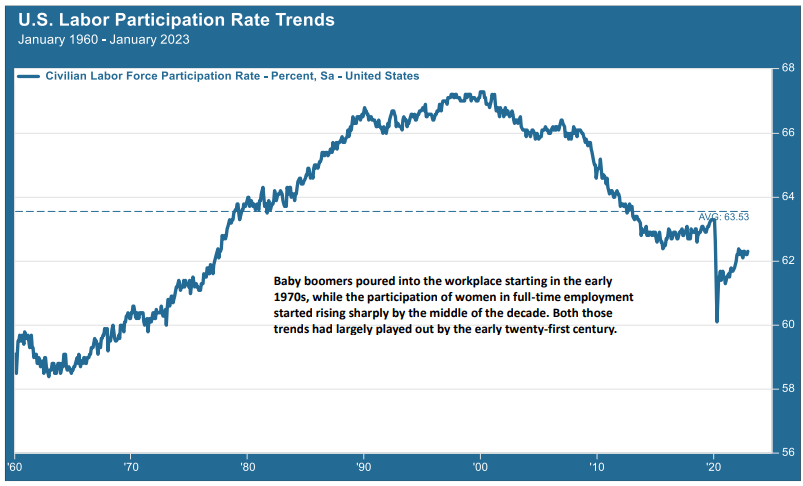
The other key driver of moderating inflation was a demographic tailwind that spanned the globe and arose from four separate phenomena. The favorable demographics started in the early 1970s as a result of the first phenomenon: the entry of the first Baby Boomers into the workforce. This was followed in short order by the second event: the rise in the number of women choosing to work full-time. The change in the make-up of the US labor force was unmistakable, as Chart 2 below shows.
Chart #2: US Labor Force Participation Rate, 1960-2023 (Bureau of Labor Statistics, MVF Research, FactSet)
While Chart 2 focuses on the US labor force, the same demographic forces applied to a greater or lesser extent elsewhere in the world. In the mid-1960s, the US labor force was made up mostly of men (predominantly white men) who were born during the grim times of the 1930s-era Depression. Ten years later, the workforce was younger, more diverse and clearly more numerous. As Chart 2 shows, though, this was a largely one-generational phenomenon; the growth rate started to decline in the 1990s and had largely played itself out by the time the twenty-first century rolled around.
Meanwhile, Elsewhere In the World
But the Baby Boomers and working women were just two of the four phenomena we mentioned above. The other two, fortuitously enough, came along just as these first two were peaking. China rejoined the world economy in the 1980s and brought with it a more than doubling of the global supply of labor. Between 1990 and 2017 - China's peak growth years - its contribution to the global working-age labor force (age 15-64) amounted to 240 million individuals. The majority of these workers left their hometown provinces for the major manufacturing centers of China's central-eastern and south-eastern regions, from Shanghai to Wuhan to Guangzhou. The population of all China's urban centers grew by 23 percent between 2000 and 2017 - a migration like no other 1 .
Meanwhile, the entry of Eastern Europe into the global economy, starting in 1989, also opened the doors for another 200 million-odd workers from behind the now-defunct Iron Curtain. Now, a majority of the world's workers were connected to the same economic system. As technology improved - which it did, rapidly - these workers became part of everything from outsourced call centers to sophisticated research and development labs, state-of-the-art manufacturing sites and marketing & distribution nodes on increasingly intricate supply chains.
What effect did all this have on global prices for goods and services? Quite simply, to keep them lower than they would otherwise have been, through companies' ability to keep their labor costs down. The labor market works like any other market - a function of supply and demand. When the supply of workers goes up, employers have much more discretion to keep wages and benefits low. For Chinese workers, even the very low hourly wages they received at Apple ( AAPL ) and Qualcomm ( QCOM ) factories were far more than they could ever expect to have earned back in their rural hometowns. For workers in the developed nations of the US and Europe, by contrast, the factory that used to pay them enough to afford a middle-class lifestyle found it economically preferable to relocate to lower-cost regions in Asia and elsewhere. Perhaps the fortunate ones among those developed market workers who managed to find other gainful employment on a par with the factory jobs they lost would benefit from the lower prices they paid for consumer goods.
The Tailwind Becomes a Headwind...
Here is the main point about this massive demographic tailwind: it's over. Each of the four key drivers - baby boomers, working women, China's urban migration and the opening of Eastern Europe - has largely played out. The Baby Boomer generation's youngest cohorts (those born as late as 1964) are entering or almost entering their sixties. Birth rates are declining almost everywhere, and this brings with it yet another economic cost: the rise in the dependency ratio, or the number of people who require care relative to the number of people capable of being productive members of the workforce. On the other side of falling birth rates are expectations for living longer - and thus requiring more labor and healthcare resources from the shrinking labor force.
If we truly are at an inflection point where the demographic trends of the past several decades are going into reverse (the argument made by Goodhart and Pradhan in the book cited in the footnote below), then it would seem evident that higher inflation is due to be in the mix. The reduced number of workers will realize they can demand more for their services and employers will have to accommodate them. Throw in a few other contributing factors - the effect of contentious geopolitics between China and its main trading partners comes readily to mind, along with the populist strain of politics that has been percolating in developed economies for more than a decade - and it would not be too hard to make the case that structural inflation will be sticking around well after the current economic cycle has passed.
... Or Does It?
As compelling as the "great demographic reversal" argument is, a future of structurally high inflation is only one potential scenario. There are others. Remember the Malthusian fallacy: Malthus's dire predictions of worldwide famine didn't come to pass because the Second Industrial Revolution changed the entire economic equation in the last three decades of the nineteenth century such that innovation in food production (and other processes essential for human well-being) more than kept pace with increases in the population. Productivity, in other words, was not leashed to the plodding linear trajectory of the previous three thousand years, but a geometric progression that outran even the population growth Malthus was sure would doom us all.
So how could a world of rapidly ageing demographics, without the benefit of the four great tailwinds of the past forty years, result in something other than persistently high labor costs keeping consumer inflation high for the foreseeable future? Three economists from the University of Toronto School of Management have set out one alternative scenario in a recent book about the state of advances in artificial intelligence ((AI)) 2 . This has been a subject of much debate for a number of years now, with artificial intelligence working itself into more and more business processes but with no clear evidence to date of its growth showing up in economic productivity.
The University of Toronto economists argue that AI is as big a deal, economically, as electricity, the internal combustion engine and the integrated circuit were back in their day. We are currently, so their argument goes, living in the "Between Times" - a period after the demonstration of the technology's productive capability and before the delivery of its promise through wide-scale adoption. In a clever analogy, the authors demonstrate that the electric light bulb was invented in 1879, but twenty years later only three percent of American homes had electric power. It was another twenty years after that - so we're up to 1919 by now - before even 50 percent of our homes were switched on. Hence the "between times" idea, which is that even the most important and far-reaching innovations take time to deliver their full potential.
AI has indeed passed some impressive milestones just in the past twelve months. At the end of 2022, one of the big stories making the rounds was an AI platform called ChatGPT, operated by an artificial intelligence company called Open AI (which for the moment is an open-source platform but, as the beneficiary of billions of dollars of investment from none other than Microsoft ( MSFT ), is not likely to stay "open" for much longer). ChatGPT really does seem to take the predictive capabilities of AI further than one could have imagined just a short time ago; it is capable of producing a near-flawless essay on seemingly any topic with no more than a one-sentence request from a user. Teachers, college admissions committees and anyone else who has to evaluate and grade written papers for a living have themselves a mighty challenge ahead.
Will these capabilities translate into a new era of supercharged economic productivity to offset the effects of the demographic reversal? Maybe and maybe not - and in any event, there is likely to be far more disruption in far more areas of the economy than just flummoxed English Lit professors grading papers on Chaucer. But it is productivity - in whatever form and via whatever means of delivery - that is going to be the key to future long-term growth. We are not oracles around here, and we make our estimates of future economic performance without the benefit of a crystal ball. Nor do we believe that the key to prosperity lies in the kinds of "Uber of X" effervesca so popular with venture capitalists a couple years ago, let alone in cryptocurrencies or weird digital art. We are going to be paying more attention to artificial intelligence in the year ahead - though we will say right now that we have no plans to outsource the writing of our Annual Outlook - or any of our other research - to ChatGPT or any other AI research and writing bot. That, in any event, is a promise we can make to you.
C. A Primer on Recessions
It will be hard to avoid talk of recession as 2023 gets underway. The latest comments from the World Bank, on January 10, warned that the world economy is on a "razor's edge" - dramatic language from the normally buttoned-up supranational financial institution. The Bank goes on to note that its worst-case scenario from six months ago is now its baseline scenario for the year ahead. While the Bank still assumes the global economy will grow by 1.7 percent, any exogenous event from a central bank policy mistake to another geopolitical crisis, a devastating natural disaster or something suddenly blowing up in the capital markets would likely tip that meager growth into recession.
We do think a recession in the US is likelier than not, for reasons we will explain more fully in later sections of this report. What we want to do here, though, is to present a larger context and explain why, even if a recession does come to pass, we are not inclined to panic and move into an ultra-defensive posture in our portfolio allocations. Our views may change. But for now, we think that a 2023-variety recession would be of a type we have not seen for a while - an old-fashioned cyclical downturn. Let's look at this more closely.
Chart #3: US Recessions and Stock Price Performance, January 1946 - January 2023 (National Bureau of Economic Research, MVF Research, FactSet)
Since the end of the Second World War, we have witnessed twelve recessions in the US. They happen to fall rather neatly into three distinct macroeconomic periods: four each in the Bretton Woods era of managed trade from 1946 to the end of the 1960s, the "stagflation" period of the long 1970s (which ended roughly in 1982) and then the globalization era that has defined the world economy for the better part of the past forty years. Each of these periods had a distinct mix of variables at play, and the nature of the recessions was likewise differentiated.
The four recessions of the Bretton Woods era, although each having its own characteristics, were largely conventional cyclical downturns. In 1948, businesses were still fearful of a return to the conditions of the prewar Depression, and curtailed production in anticipation of reduced consumer demand (in fact, the opposite happened, as the American consumer got into full gear with the turn of the decade to the 1950s). Inflation was the big concern in the early 1950s with the outbreak of the Korean war, and a newly independent Fed slammed the breaks on monetary growth, producing a sharp but short recession in the second half of 1953. Move on to later in the decade, and a resurgent world building up productive capacity from the ruins of the war suddenly brought to an end the rest of the world's dependence on US exports. That cut into GDP (net exports are a positive contribution to GDP growth) and produced another brief recession in 1957-58. A period of sharp expansion followed, leading the Fed to begin a round of monetary tightening in 1959 and bringing about the recession of 1960-61 (which Richard Nixon, not unfairly, blamed for his narrow defeat in the 1960 presidential election to John F. Kennedy).
These Things Are Not Like the Others
What all of those recessions had in common was that they were primarily driven by the endogenous factors at play in the business cycle: production, consumer demand, inventory management, and eventually overheating and inflation, leading to monetary tightening and a reversal of growth. Here's what else is noteworthy: that same explanation - primacy of the business cycle - does not apply to the last three recessions we have faced.
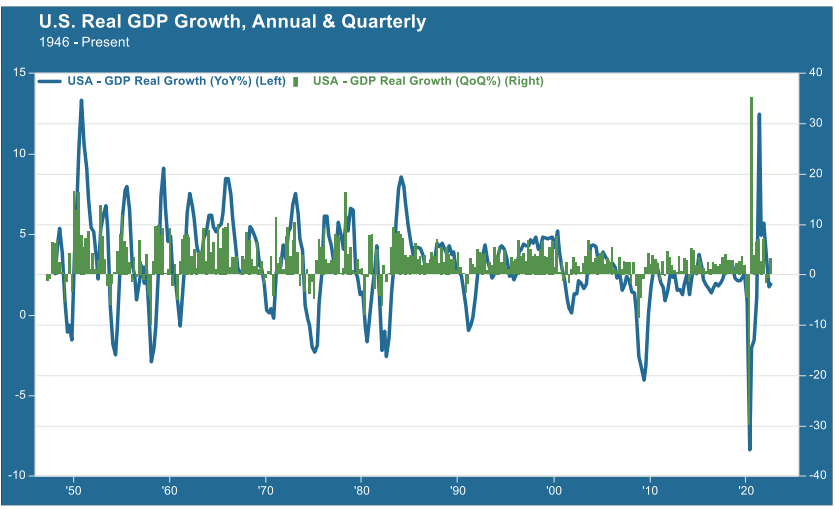
The strangest of the lot, for many reasons, was the 2020 recession. This lasted for a scant two months, the shortest on record. It was also far and away the deepest, with a contraction of -8.4 percent year-on-year from June 30, 2019 to June 20, 2020. It was also a recession of choice, having everything to do with a global health pandemic and nothing to do with the business cycle.
Chart #4: US GDP Growth (Quarter-on-Quarter and Year-on-Year), January 1946 - January 2023 (Bureau of Economic Analysis, MVF Research, FactSet)
The recession of 2008 was deep and painful. The main catalyst for this recession, though, was the near-total collapse of the financial system, brought about by the highly leveraged, improperly rated, capriciously securitized credit instruments sitting on or off the balance sheets of the preponderance of major global financial institutions. Credit dried up, and the Fed did not yet have its quantitative easing playbook in place to flood the system with money on day one, as it would when the Covid pandemic hit in 2020. Unemployment soared, hitting a peak of 10 percent and coming down only slowly as the recovery got underway - the unemployment rate would not fall below five percent until 2016.
The recession of 2001 was much milder - perhaps surprisingly, since it followed what was then the longest economic expansion of the post-war period. But again, the economic cycle played second fiddle to the outside force of a financial crisis, in this case the stock market meltdown triggered by the bursting of the Internet bubble in early 2000. The bear market far outlasted the recession, persisting for nearly three years despite the absence of unduly negative economic conditions (the unemployment rate peaked at 6.2 percent, less than the peak unemployment rate of each of the previous four recessions going back to 1975).
Recessions and the Market
It is perhaps not surprising that financial markets have tended to react more negatively to recessionary environments where the main culprit is a financial crisis rather than the orderly passing of a business cycle. In the four cyclical recessions during the Bretton Woods period, the average peak-to-trough decline for the S&P 500 was -17.2 percent. By contrast, the average for the four globalization-era recessions was -36.3 percent. However, during the 1990 recession - which was the only one of this era that was basically a business cycle recession - the S&P 500 fell by only -19.8 percent from peak to trough. The biggest peak-to-trough drawdowns for all periods took place during the 2001 and 2008 recessions, which, as we discussed above, were both driven by financial crises.
The other feature worth noting about recessionary market drawdowns is that the market tends to find a bottom sometime either before the recession officially begins or in its early months. Let's review for a moment how we actually know that we are in a recession. Who exactly makes the pronouncement that produces those gray columns in Chart #3 above with those precisely defined recession periods? That is the work of the Business Cycle Dating Committee, a part of the National Bureau for Economic Research. Typically, the Committee's official assessment only comes out some months after the actual event. In other words, nobody actually has "official" confirmation of either the start date or the end date for a recession until well after the fact. Economists, investors and the financial media are all essentially flying blind, using popular rules of thumb like "two consecutive negative GDP quarters" to guess as to whether the recession is upon us or not.
Here is what we know today. The S&P 500 hit a peak-trough decline of just over -25 percent last October, its low point for the cycle so far. That magnitude would seem to be more or less in line with the typical experience of a cyclical recession, and that, in turn, would help one make a case that either the worst is over or that, if the October 2022 lows are in fact tested at some point in the coming weeks, there wouldn't be much in the way of an additional decline. After conditions stabilize, the market would likely resume a growth trajectory.
None of this is in any way certain. There are plenty of other factors out there, exogenous to the business cycle, that could derail financial markets. To cite just one example, this year Congress will once again have to authorize an increase in the debt ceiling to avoid the disastrous outcome of the US defaulting on its (already committed) obligations. Past debt ceiling dramas have come and gone without the worst outcome prevailing. But, to say the least, tensions are fairly high in the lower house of the 118th Congress. More broadly, the background conditions that have led to securities market breakages in the past are very much with us still. The Age of Globalization may have receded as the dominant cultural strain of economic thought, but the centrality of financial assets that has characterized the last 40 years of economic history has yet to be replaced by anything else.
Let's assume for a moment, though, that this cycle to a greater or lesser degree follows previous recessionary environments. In all three periods shown in Chart #3 above, the twelve months following the market's recession trough have produced equity market gains of greater than 30 percent. Again - don't take this to the bank. It is very early in the year. But financial strategies require a base-case scenario. Ours is for ongoing uncertainty in the early part of this year, with a stabilization in financial markets at some point, more or less concurrent with a relatively mild cyclical recession, and a period of measured growth thereafter. As always, we will analyze, revise and communicate ahead as circumstances dictate.
II. 2023 Investment Thesis
A. Executive Summary
2022 was a bad year for most kinds of core investment assets, from the least-risky Treasury securities to the most volatile corners of the equity market. Persistently high inflation forced central banks to adopt an increasingly hawkish posture on interest rates as the year progressed. The Fed funds rate rose more sharply, in a more compressed window of time, than at any time since the early 1980s. By late summer, it seemed that both headline and core measures of inflation were peaking; yet the Fed's unswerving insistence on rates remaining higher for longer took the wind out of the sails of sporadic attempts by the market to sustain a rally. The focus turned to what many see as the increased likelihood of a recession in 2023. Companies in some industry sectors, notably tech, started announcing layoffs. Those haven't shown up yet in any meaningful way in the unemployment numbers, but that is probably not too many months away. Meanwhile, household finances are not looking great as the economy heads into a cooling-off period, and businesses are drawing down inventories in anticipation of a slower demand environment.
We expect there will be a recession in the US at some point in 2023, driven by a combination of cyclical factors. Household savings are low, debt levels are elevated, and higher interest rates are starting to have the effect of dampening demand (which, after all, is the entire point of an inflation-fighting tight monetary policy). Europe may already be in recession, China's growth remains hampered by Covid, and there are few other bright spots in the global economy. We also expect this recession, if there is one, will be relatively brief and shallow - a standard-issue cyclical downturn rather than the collateral damage of a global health or financial crisis, which were underlying drivers of the 2001, 2008 and 2020 recessions.
In the absence of unforeseen threats not known at this time (and which by all means could materialize), we expect that the US equity market will find its footing sometime in the first half of the year and eventually deliver a positive performance. In the bond market, we expect to see some widening of credit risk spreads, while Treasuries should stabilize once the Fed reaches the terminal rate in its tightening cycle. We believe that terminal rate will be somewhere within the range of 5.0-5.5 percent. However, bond market stability will also depend in no small part on the pace at which the Fed reduces its balance sheet, which, at $8.5 trillion, remains elevated and not far off its $8.9 trillion peak.
Equities: Leadership Questions
Historically, equities have done relatively well in the twelve-month periods after reaching their recessionary lows, as we discussed in some detail in the previous section of this paper. But past is seldom prologue, and every downturn has its own unique tale of woe. One of the main questions we are thinking about in looking ahead is equity market leadership. For most of the past decade, that leadership has been virtually unquestioned, in the form of the major technology platforms. But the so-called "FAANG" complex (Facebook ( META ), Apple, Amazon ( AMZN ), Netflix ( NFLX ) and Google (Alphabet) ( GOOG , GOOGL )) all underperformed the S&P 500 in 2022, by either a little (Apple) or a lot (Meta). It turns out that even dominant tech platforms are not immune from old-fashioned economic cycles. At their peak, these five companies commanded more than twenty percent of the total market value of the S&P 500; today, that figure is just 13 percent.
If not FAANG, then what? If this really is an old-fashioned cyclical recession, as we opined above, then we are probably right now in the latter part of the phase where slow, predictable earnings and high dividends dominate; witness the massive outperformance of the Dow Jones Industrial Average over both the S&P 500 and the tech-heavy Nasdaq in 2022. As prices more fully reflect the economic downturn, we could imagine a momentum shift back towards cyclicals sometime before the end of the year. Semiconductors, one of the most beaten-down sectors last year, in particular, could be in the forefront of a pro-cyclical shift. As always, however, we caution that there are plenty of lurking X factors out there that could scramble any scenario for market leadership and overall market performance.
Fixed Income: Yields and Spreads
Bond yields offer something in early 2023 they have not offered for at least two decades: a satisfactory income stream. This is good news particularly for income-oriented portfolios. Yet, two other issues present challenges for the bond investor. The first is safety: in 2022, bonds in general did not provide an adequate hedge against declines in the equity market. The Bloomberg Barclays Aggregate US Bond Index, a widely used benchmark, fell 13.01 percent in 2022, while the index for 10-20 year Treasury securities fell 25.2 percent - more than the S&P 500! Bond prices decline when yields go up, and the magnitude of the price decline increases, all else being equal, the longer the bond's duration or maturity. In 2023, it is unlikely, we believe, that high-quality bond prices will fall as much as they did in 2022, simply because the Fed is closer to its terminal rate than it was a year ago. Nevertheless, there is still room for yields to rise.
The second challenge is the potential for risk spreads to widen. The bond market today seems to be telling us two conflicting things at the same time. The first, based on the inverted Treasury yield curve, is that a near-term recession is likely. For much of the past six months, the curve has been more steeply inverted than at any time since the early 1980s. The 10-year Treasury yield has in recent weeks traded as low as a full percentage point below the Fed funds rate, which was raised to a range of 4.25-4.5 percent after the Federal Open Market Committee's December policy meeting.
We are getting a different picture from credit risk spreads, however. The risk spread between Baa corporates, the lowest tier of investment-grade securities, and the 10-year Treasury remains relatively tight: 2.11 percent today versus the three-year average of 2.26 percent. If a recession is as imminent as the yield curve tells us, we should be expecting wider credit risk spreads than we are currently seeing. Investors need to weigh the likelihood of widening spreads against the opportunity of locking in relatively attractive yields for investment-grade corporates today. We see a good argument for doing both: allocating a portion of one's fixed income portfolio to fixed-rate corporates today, while keeping some powder dry for further opportunities as and if spreads widen.
No Free Lunch in Private Markets
Private equity funds, VC managers and other stewards of the $10 trillion private investment market may make a lot of hay touting their - on paper - relatively successful experience in 2022 versus the travails of public equity and debt markets. The US Venture Capital index operated by Cambridge Associates was down by less than half of the Nasdaq Composite losses around the midpoint of last year, the last available data point. Anecdotally, private equity buyout funds have been reporting flat or slight single-digit gains to their limited partners. These apparently benign numbers come with some major caveats, however.
The first of these caveats is liquidity. Investors in most types of pooled private investment structures are locked in for as many as 10 years, with very limited interim avenues for redemptions. The second caveat is accounting conventions. The value of holdings in a VC or private equity fund do not reflect any kind of real-time market assessment; they are accountants' book entries based on assumptions that may be one or two years old, simply at the discretion of the accountant. Consider that comparison cited above of the VC index versus the Nasdaq: both indexes house early-stage tech companies with years of cumulative losses and unproven business models. There is no reason to think that returns discrepancy reflects anything other than the vagaries of discretionary accounting.
The third caveat, though, is perhaps the most important. The ultimate success of any of these private investment vehicles depends on two critical ingredients: first, easy access to large amounts of low-cost debt; and second, a vibrant exit ramp for their holdings via either M&A or public markets. Neither of those avenues is looking particularly robust today - M&A activity is well below the hectic pace of the previous couple of years, and the market for equity IPOs is moribund. In recent months, private equity investors have been trying to fudge their way around these constraints by essentially buying and selling among themselves - a silly game that can only last so long. As for cheap and easy debt - yep, that ship sailed at the beginning of 2022, and it's doubtful that it will be coming back into port anytime soon.
Don't Panic, But Don't Expect Unicorns Either
Summing it all up, our overall takeaway message is that a conventional, cyclical recession is likely to bring with it some ongoing volatility from last year's key market trends, but as the year plays out, we see a strong case for stabilization and a return to a growth trend for core risk assets. That being said, it cannot be stressed enough how important the presence of higher interest rates is in keeping a check on growth potential. As long as we remain far away from the zero interest rate policy of yesteryear - and we believe that will be for some time to come - the market will not be kind to the sort of things that soared in 2020 and 21, whether that be cryptocurrencies, "Uber of X" venture plays or covenant-lite private debt offerings. For portfolios that stay away from those parts of the market, there should be good opportunities in companies with healthy free cash flows and relatively conservative debt-to-equity ratios.
On the fixed income side, the opportunity to lock in relatively attractive yields is good for portfolios with moderate or high income needs. Investors who choose to lock in these yields should do so with the mindset of holding onto the positions through to maturity, and worry less about mark-to-market returns in the meantime. Interest rates will go up and down over the next two to ten years for reasons we cannot even foresee at present; what matters is the predictability of the timing and magnitude of the income stream based on where you purchased the asset.
The year ahead will no doubt present its challenges, and the twin impulses of fear and greed will always be there, ready to drive poor decisions. Patience and discipline will get us through the tough times and help us to see both the danger and the opportunity in each crisis we confront.
B. State of the Economy
i) Household Dis-savings
Our analysis of the economy starts with household savings, because we think this trend is a key driving force behind the cyclical recession we see happening sometime later this year.
Chart #5: US Household Savings as a Percentage of Disposable Income, 2000-Present (MVF Research, FactSet)
As with almost any economic indicator we observe today, the distorting effects of the 2020 pandemic lockdown are clear and present. In the case of household savings, we see the rate soar from the mid-high single digits in 2019 to a record of over 30 percent in 2020. The underlying cause, to nobody's surprise, is the $4.5 trillion stimulus package that put government checks in everyone's mailbox, all while people sat at home not spending money. The savings rate started to come down as lockdown conditions eased in late 2020. It jumped again with the incoming Biden administration's Covid relief package in the first half of 2021.
Then, the combination of the economic reopening and all that money sitting around in savings accounts triggered a massive amount of consumer spending. Retail sales, one measure of consumer activity, has stayed above the 23-year median growth rate of 4.12 percent for the entirety of pandemic and post- pandemic period (the current rate, which touches the lowest level of the cycle, is 5.41 percent).
Chart #6: US Retail Sales, Year-on-Year, 2000-Present (MVF Research, FactSet)
Now back to that savings rate in Chart #5: today, it is at its lowest level since the beginning of the twenty-first century. That's a lot of savings that just went out the door! When we put it into context, here is the mix of variables at play: consumer spending has been very strong following the pandemic lockdown, due to the combination of the influx of personal savings and the exuberant return to spending following the lockdown. Consumer spending currently accounts for about 68.4 percent of the total output calculated in Gross Domestic Product - it is far and away the main driver of real GDP growth. Those pandemic-era savings are now largely gone, and more recently, households have been funding their ongoing consumer spending with debt.
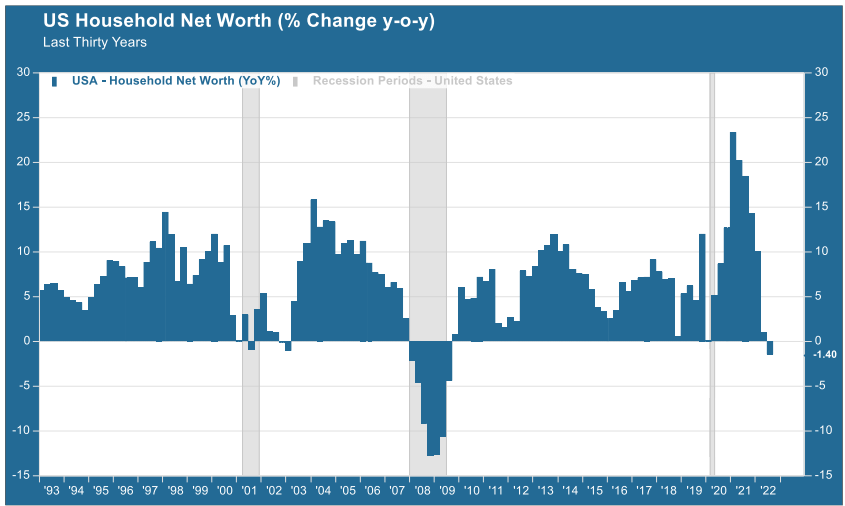
Household debt is still not as high as it was in 2007, right before the financial crisis. But household net worth, shown in Chart #7 below, has turned negative. In the past thirty years, US household net worth has only been negative on two other occasions: the 2008 financial crisis / Great Recession and the period during and shortly after the 2001 recession and attendant deep bear market in stocks.
Chart #7: US Household Net Worth, Year-on-Year, Last 30 Years (MVF Research, FactSet)
The story we have told here through Charts 5-7 and the attendant commentary is the core of our thesis that the US is due for a cyclical recession this year. Recessions don't just happen because lots of economists and other kibitzers talk about them happening; there has to be a reason. Consumer spending is the main driver of GDP growth. If consumer spending turns meaningfully negative then it will have an outsize negative impact on GDP and hence increase the likelihood of a recession. Savings are low, debt levels are relatively (though not historically) high, the cost of debt is higher due to rising interest rates, and household net worth has turned negative.
The prerequisite conditions, in other words, are in place. But as we have said elsewhere in this report, these conditions tell us that a relatively shallow, cyclical recession is more likely than a deeper and more painful downturn. One of the reasons for our thinking here is the labor market; specifically, we think the peak unemployment rate this time is likely to be substantially lower than the typical recessionary jobless peak. We turn to this topic next.
ii) The Labor Market Puzzle
"But wait!" you might say. What about the robust jobs market? As we write this, unemployment is still at the 54-year low level of 3.5 percent. There are still 1.7 job vacancies for every unemployed person. We know that the Fed has focused closely on the puzzling fact that job growth remains as robust as it does even after ten straight months of monetary tightening. For all intents and purposes, the jobs market appears to be impervious to an economic downturn.
There are a couple other things we know as well, though, by studying past recessionary periods. We know, for example, that the unemployment rate was 3.5 percent on December 31, 1969, and we also know that an official recession began on January 2, 1970 that lasted until December 1, 1970. The unemployment rate for that recession peaked at 6.1 percent. That peak unemployment rate came after the recession officially ended, which points to another fact we know: unemployment is a lagging, not a leading, indicator. Hiring and firing decisions tend to get made closer to the end of a particular cycle rather than the beginning of one - layoffs usually happen after a company is already seeing declines in sales and profits, while hiring sprees tend to be a function of growth that is already happening.
In Chart 8 below, we present the trend in the unemployment rate from 1950 to the present, highlighting the peak rates associated with recessions as well as the levels of maximum employment - which, as we noted above, has been 3.5 percent since 1969 and also represents the most recent unemployment rate.
Chart #8: US Unemployment Rate, January 1950 - December 2022 (Bureau of Labor Statistics, MVF Research, FactSet)
Given the tendency of the jobless numbers to lag current conditions in the economy, and using the past recession trends shown in Chart #8 as a guide, it is entirely possible that with a recession starting in, say, the middle of summer 2023 (we are not predicting this, simply using it as an example), the jobless rate could still be somewhere not far from its present month-to-month range of 3.5-3.7 percent. We would expect that any recession, even a relatively shallow one, would ultimately produce an unemployment rate north of five percent. But given the changing nature of demographics we discussed in the first section of this paper, we would not be surprised to see a peak recessionary unemployment rate below six percent, which (see Chart #8) would be the first time that happened in the entire post-war period.
iii) China's Troubled Reopening
In 2022, there were two significant X factor events that messed with beginning-of-year predictions about markets and the economy. One was Russia's invasion of Ukraine, and the other was China's many months of total lockdown in accordance with its "zero-tolerance" policy for containing Covid-19. The first of those two events, unfortunately, is still plodding along. The second, though, ceased to exist after a sudden pivot by Beijing last November. Faced with the rare spectacle of nationwide protests from irate cooped-up citizens, the government of Xi Jinping (fresh off his successful gaining of a third presidential term, likely with as many more to follow as he desires) abruptly reversed its longstanding position and proclaimed business as usual. Foreign investors put off by two years of tumult in the world's second-largest economy (the drama around Chinese Internet companies, the collapse of the property development sector and then the Covid lockdowns) started to gingerly step back in. Hong Kong's Hang Seng index, a popular proxy for China sentiment, is one of the best-performing equity indexes so far this year.
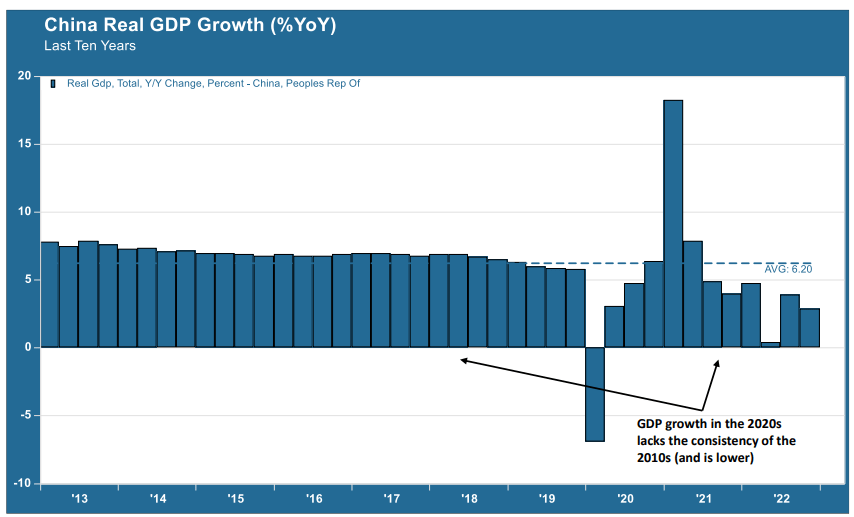
China's reopening is not likely to be easy. For many years, the country's annual GDP growth was the stuff of legend. Throughout the 2010s, year-on-year GDP stayed reliably above the official 5.5 percent target real growth rate. China also bounced back more quickly than most other countries from the original Covid lockdowns in 2020 - partly because the virus originated there, and partly because its rapid deployment of a zero-tolerance strategy did succeed in containing outbreaks that time. But its subsequent economic performance tells a very different story and suggests that China's longstanding economic model of centralized dirigiste growth is not up to the challenges facing the country today.
Chart #9: China Real GDP Growth, January 2013 - January 2023 (MVF Research, FactSet)
China's economy matters to the world, but it matters most to other parts of Southeast Asia and, notably, to Europe. China is the European Union's major trading partner, and trade is a more important component of the European economy than it is of the US economy. Indeed, China's reversal of zero-Covid has had the collateral effect of casting Europe's prospects in a brighter light among some economists than previously. We think the optimism is a bit premature.
It is impossible to talk about the Chinese economy without talking about the property sector. The model that so consistently met GDP growth targets in the last decade relied on property and infrastructure development. Even while Beijing's economic policy leaders tried to guide the economic mix to a higher proportion of consumer activity versus shovel-ready development projects, the swing back to fixed asset investment would happen at the first sign of trouble. This was particularly true in 2015-16, when worsening economic conditions prompted a radical devaluation of the currency and a sharp plunge in the high-flying domestic stock market.
But the property sector imploded in the second half of 2021, highlighted (or lowlighted, if you prefer) by the collapse of Evergrande ( EGRNF ), the largest developer in the sector. Home sales have been in double-digit negative territory every month since then, and irate homebuyers who made their purchases for still-to-be-completed homes before Evergrande and its ilk blew up are withholding mortgage payments and threatening other legal action for delays and defaults in the original terms and conditions of sale. In 2023, the government will find it next to impossible to goose up growth numbers by pulling out the old property playbook, even if it does follow through on some recently announced stimulus money to the sector.
Xi Jinping's government put a different set of poker chips on the table when it dramatically reined in the high-flying ambitions of its successful tech leaders. The message seemed to be that China's future growth was going to come less from the consumer-facing (and wildly popular among Chinese consumers) Internet platforms like Alibaba ( BABA ) and Tencent ( TCEHY ) and more from strategic growth sectors, especially clean energy, biotechnology and semiconductors. The country does have a head start in clean energy, thanks to early investments in the sector and the possession of a significant share of the world's total store of rare earths minerals and other key inputs to green projects. But present conditions suggest that China has a long way to go before it becomes a world leader in biotech (for one example, consider the relative ineffectiveness of its domestically-produced Covid vaccine versus the mRNA jabs we use). Its semiconductor sector is likewise far behind the capabilities of Taiwan, South Korea, Japan and the US - and future development opportunities here face a geopolitical headwind as the US, in particular, seeks to cordon off China from access to key advanced technologies via export sanctions.
Finally, China's population is both ageing and in decline. Earlier this month, the government announced that the population had fallen for the first time since 1961 (when it did so largely due to a nationwide famine resulting from Mao Zedong's disastrous Great Leap Forward policy). This hits on some of the demographic issues we discussed in the first section of this report: declines in population growth and an increase in the dependency ratio will be challenges for many countries, but China lacks many of the resources necessary to manage the transition.
In summation, we do not see China's 2023 reopening as the kind of straightforward return to robust growth that many investors seem to be factoring into their investment decisions. And this is without even taking into account the non-zero possibility of a major geopolitical threat actualizing this year.
C. State of the Markets
i) A Bit Higher, But How Much Longer?
"Don't fight the Fed" is the advice every veteran of multiple market cycles gives to every fresh-faced pup coming into the fray. But in 2022, markets fought the Fed every step of the way through the steepest and fastest tightening policy the central bank has engineered in forty years. Inflation is still high (though starting to come down), yet neither the stock market nor the bond market seem inclined to take Jay Powell and his colleagues at face value when they insist that rates will stay higher for longer. What gives?
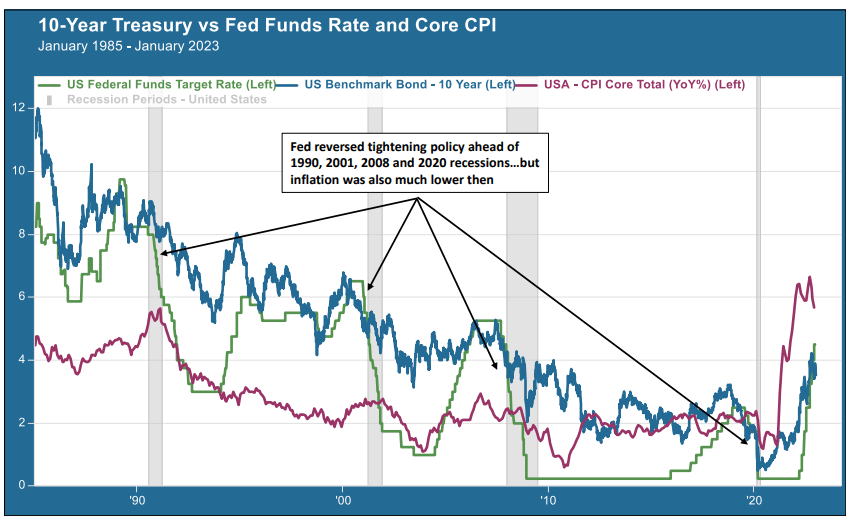
Chart #10: Fed Funds Rate, 10-year Treasury and Core Inflation, January 1985 - January 2023 (Federal Reserve Online Data, MVF Research, FactSet)
Interest rate hikes preceded each of the past four recessions, which is to be expected, since rate hikes typically happen late in a growth cycle when the economy starts to overheat (though not every rate hike cycle ends in a recession - see for example 1994). In each of these instances, shown in Chart #10 above, the Fed reversed course and started lowering rates as the data came in showing a slowdown. In the period from 1985 to the present, the longest the Fed left rates at peak level was around 15 months, from June 2006 to September 2007.
The one glaringly different variable in 2023, of course, is inflation. In the previous interest rate cycles shown in Chart #10, the Fed did not have to worry much about consumer prices and was able to address squarely its other mandate of promoting maximum employment. Consider the rate hike cycle of 2018, when the Fed abruptly cut short its tightening cycle after the stock market swooned in fall of that year. The Fed then held rates at a peak of 2.5 percent (the lowest peak rate by far in the postwar economy) until July, when early (and misplaced) fears of a recession prompted a full reversal to rate cut mode.
All of that happened many months before the coronavirus pandemic brought rates back down to zero. Whether the Fed was right or not to have pivoted in early 2019, it did not have inflation to worry about. Conditions are different today; the current Fed funds rate of 4.25-4.50 percent is almost certainly not the peak rate, so we aren't even at the beginning of whatever time period is going to make up that "higher for longer" mantra the Fed has been singing in unison for the past half year. What that time period winds up being is going to determine much of what happens in the bond market this year.
ii) Steep Inversions
When investors fear an economic downturn, they seek out instruments of safety, and historically, none have been safer than US Treasuries (hopefully that will remain the case in 2023, when once again political dysfunction in the US Congress will run smack into the realities of making good on the full faith and credit of the US government by raising the debt ceiling). While short-term yields remain tethered to the Fed funds rate, intermediate- and long-term yields respond more to market forces of supply and demand - hence the flight to safety tends to result in an inversion of the yield curve.
You can see from Chart #10 above that such an inversion has always preceded a recession - though it is also worth noting the one or two instances when an inversion did not prefigure a near-term recession, in 1998 and in 2019 (in the latter instance, the yield curve inversion in September 2019 did not "prefigure" the 2020 recession, because that recession was solely a function of a global pandemic from a virus that as far as anyone knows did not exist in September 2019). In the present instance, the 10-year Treasury yield has been in an inversion with the 2-year yield since June 2022, and with the Fed funds rate since the Fed's rate hike in November last year. Currently, the 10-year Treasury is yielding around 3.5 percent, a full percentage point below the upper bound of 4.5 percent on the Fed funds rate.
This calculus is extremely important for bond market strategies in 2023. Investors looking to lock in the most attractive yields in more than a decade are faced with a dilemma. Currently, the most attractive yields are to be found between 3-month and 1-year maturities. The 1-year Treasury note currently yields 4.75 percent, while the 2-year yield, at 4.2 percent, sits below the 4.25 percent lower band of the Fed funds rate. Here's the dilemma: if you want to lock in higher yields for longer maturities, do you hold off in anticipation of those rates rising again, or do you cash in your chips and make do with the 3.5 percent available today? Is it conceivable that the 10-year yield could get as high as five, maybe even six percent? Locking in a five percent income stream for 10 years (assuming you hold the bond to maturity) has not been possible since 2007; for a six percent yield, you have to go back to the beginning of the century.
We think the Fed funds rate is going to top out with an upper bound somewhere between 5.0 and 5.5 percent. If so, how long it stays there is largely a function of what happens to inflation in the coming months. Where we think the market is ahead of its skis is in the assumption that, as per all those other recessions since 1990, the Fed will start cutting rates as soon as it gets some clear data about an approaching slowdown. If the economy starts to slow and core inflation is still, say, stuck between five and six percent, then we are inclined to take Jay Powell at his word that rates will stay higher. Powell is well-versed in the history of past Feds, including the stop-start approach to rates, inflation and unemployment that led to stagflation in the 1970s. We could see 10-year yields potentially surpass five percent if money stays tighter for longer. We think six percent, while not impossible, is probably a stretch (and it would also likely not be a great outcome for equity markets).
The other variable at play with rates is how much the Fed moves to reduce its balance sheet, which even today is still swollen with the cumulative effects of quantitative easing after the 2008 recession and during the pandemic.
Chart #11: Federal Reserve Banks' Total Assets, December 2002 - January 2023
Source: Federal Reserve Bank of St. Louis, MVF Research
The Fed started "quantitative tightening" (QT) in the middle of 2022. As you can see from Chart 11, though, the amount of tightening conducted to date is a small fraction of the total expansion of its balance sheet from around $1 trillion before the 2008 financial crise to $9 trillion at the peak of the pandemic. QT involves the Fed selling its bonds to banks (and adjusting the banks' accounts at the Federal Reserve accordingly). Enough selling by the Fed, without a commensurate offset of higher demand from other institutions, by itself could put additional upward pressure on rates across the spectrum of maturities.
iii) Questions of Credit
But wait, there's more to the dilemma than just the decision about when and what to invest in with regard to Treasuries. Corporate bonds present their own conundrum. Whereas the Treasury yield curve is about as firmly positioned for a recession as it has been any time in recent memory, credit risk spreads between investment-grade corporate bonds and benchmark Treasuries tell a different story. The risk spread between Baa corporates (the lowest tier of investment grade bonds) and the 10-year Treasury benchmark is currently 1.90 percent, which is substantially tighter than the three-year average spread of 2.27 percent. Risk spreads are typically expected to widen ahead of an economic downturn, due to the increased probability of default. Why would the Treasury market be signaling recession while riskier bonds classes are whistling a merry tune? Part of the answer may be that corporate balance sheets on average are fairly healthy, the beneficiaries of so many years of issuing debt at historically low interest rates. We do expect to see some widening of risk spreads if, as we expect, the economy moves into recession later this year. As with any investment decision, the timing is subject to many factors, only some of which we could articulate today. We think an incremental approach makes sense: take advantage of what is offered in today's environment, but keep enough dry powder available for future opportunities that have at least a reasonable chance of surfacing at some point later this year.
iv) Equities: Cash Flows and Multiples
How will the equity market fare in 2023? To a large extent, the answer to this question depends on how things turn out in credit markets, which is why we have given so much space in this report to interest rates, the Fed and inflation. But other factors are at play. Let's start with the fact that 2022 was the worst year for equities since 2008, with the S&P 500 down 18.1 percent, just shy of the threshold for a bear market. It is rare for the market to experience back-to-back negative years. Rare, but not unheard of, and in recent memory too. US stocks suffered three consecutive years of losses in 2000-2002. That drawdown, as we have noted elsewhere in this report, had more to do with a financial event - the collapse in tech share prices - than with the brief recession that took place in the middle of the bear market. We do not think that a cyclical recession in 2023, absent a similar type of financial crisis, would have the same extended effect.
At the beginning of other years, we have proclaimed that "cash flows and margins will matter this year," only to see them not matter nearly as much as momentum, FOMO, memes and other financial ephemera. We say it again this year, fully aware that even as we make this prediction, cryptocurrencies - the ne plus ultra of financial ephemera - are staging a furious (probably temporary) comeback. We think margins, strong balance sheets and disciplined pricing power will matter this year, and that these attributes will matter more than broad-based categories like growth versus value, or US versus non-US, or small versus large.
Right now, the S&P 500, on average, looks reasonably priced. Not super-expensive like it was in 2021, not super-cheap like it was in the aftermath of the 2008 crisis. Just reasonable. But that could change.
Chart #12: S&P 500 Next Twelve Months P/E Ratio, January 2000 - January 2023
Source: MVF Research, FactSet
As Chart #12 shows, the forward P/E ratio for the S&P 500 is 17.48x, just a bit above the 23-year median P/E of 15.96x, hence we think appropriately earning the appellation "reasonable." The P/E ratio is pretty close to where it was during much of the mature phase of the pre-pandemic growth cycle from 2015 to early 2020. During that cycle, as you can see from the chart, valuation multiples were substantially higher than they were during the entirety of the 2003-07 growth period.
What this tells us is that we are not in one of those moments where everything is on sale at bargain-basement prices. Here's the thing about a "reasonable" P/E valuation: it can become very "unreasonable" in a hurry if earnings - the denominator of the P/E formula - go down. And go down they well may for many companies in 2023 as, if and when an economic down cycle plays out. The companies that will be most immune from having their valuations reassigned to "unreasonable" will be those with the cash flow strength, balance sheet integrity and downturn-resistant business models to keep their sales and earnings numbers up while their peers are being downgraded. These may be steady, high-dividend companies or cyclical growth names - what matters will be the quality.
What does this mean in aggregate? It is entirely possible that the market will test its 2022 lows, at which point the S&P 500 was down around 25 percent from the previous high point set on January 3 of that year. There may even be some further downside. But - and again, absent something else breaking in the financial markets or a geopolitical crisis or something of a commensurate nature - we think conditions are likely to improve and result in a positive performance for the year. Perhaps not a barnstormer - given what we know today, we would be surprised to see anything close to the go-go growth stretch of 2019-21. But good enough, perhaps. Reasonable.
D. Concluding Thoughts: Risks and Opportunities for Portfolio Positioning in 2023
To sum up the default case we have set forth in this report: we believe there is a good chance of seeing a relatively mild cyclical recession sometime in 2023 as the prolonged monetary tightening exacerbates the increasingly weak position of household finances and prompts defensive, cost-conscious decisions on the part of businesses. Inflation will continue to moderate over the course of the year but not all at once, and the Fed will continue to maintain tight money even as signs of a slowdown become more visible. The lessons learned from the mid-1970s will keep the Fed from the kind of knee-jerk pivot to forestall a recession that the market still seems to be betting on. Interest rates will thus remain at elevated levels for longer, but there will be fewer interest rate hikes to come, and a likely terminal level for the Fed funds rate somewhere between 5.0 and 5.5 percent. In this kind of environment, we would envision moderate gains for equities, with perhaps returns for the S&P 500 somewhere in the mid- to high-single digit range.
There are plenty of X factors out there that could upend this default case and produce entirely different outcomes. Remember that risk is a two-way street; it can produce both higher and lower outcomes. Political risks abound; in addition to the ongoing war in Ukraine, there is the deterioration in relations between the global West and China, with Taiwan in the balance. Here in the US, there is a meaningful risk associated with the debt ceiling. We see that risk as higher today than it was the last time the issue came close to the brink but was defused, back in 2011.
There are also market risks. Note how many times in this report we used phrases like "absent any unforeseen breakages in financial markets." Financial crises are simply a part of an interconnected world dominated by asset price movements. In 2022, the big meltdown took place in cryptocurrencies, but fortunately, they were not yet an integral enough part of the mainstream financial system to have the kind of knock-on effects that, say, subprime mortgages had in 2008.
If we could distill all of this into a prescription for portfolio management in 2023, it would be thus: take advantage of yield opportunities where they exist. Remain positioned for growth but don't get too far out over your skis. Don't lose sight of the many risks at play, and be prepared to adjust accordingly. The age of the polycrisis may be upon us, but the old virtues of patience and discipline are as important as ever.
___________
1 Figures cited in this and the next paragraph are sourced from "The Great Demographic Reversal" by Charles Goodhart and Manoj Pradhan, Palgrave Macmillan London, 2020
2 Ajay Agarwal, Joshua Gans and Avi Goldfarb, "Power and Prediction: The Disruptive Economics of Artificial Intelligence" Harvard Business Review Press, Boston MA, 2022
Editor's Note: The summary bullets for this article were chosen by Seeking Alpha editors.
For further details see:
2023: The Year Ahead