USIG - 2024 Forecast: Done A Little Differently
2023-12-27 03:59:00 ET
Summary
- The S&P 500 has made a new all-time-high on a total return basis, but it needs to break out decisively.
- Corporate defaults seem very well-contained, but corporate credit spreads are your “early warning” indicator for a deeper recession.
- 2024 could easily see bonds outperform stocks, and yet both have a good year.
- Ultimately, I do think 2024 will be about the Fed and Jay Powell, and whether the FOMC reduces the Fed funds rate.
Last year at this time, this blog thought that 2023 would be a better year , with a prediction of positive returns for both stocks and bonds.
To be frank with readers, to know that Ed Yardeni and Tom Lee are both optimistic about 2024 stock and bond returns makes it easy for a long-only advisor to remain optimistic about forward stock and bond returns. Also, Carson Group’s Ryan Detrick and Sonu Varghese, Carson’s Global Strategist, previewed their 2024 outlook last week and expected the S&P 500 to return 11-13% next year.
Here’s what would make me nervous about 2024 and increase the probability of negative returns next year:
1.) The S&P 500 trades up to its old high near 4,795-4,800 and starts to decline materially. When the S&P 500 ran back to its March 2000 high in October 2007, it ran through the old high near 1,550, traded higher a few percent, and then started to decline and kept going. The current S&P 500 hasn’t made a new high in - well - it will be 24 months, next week on January 2nd ’24, so I’d like to see that old high at 4,795-4,800 taken out by the end of Q1 ’24. The S&P 500 has made a new all-time-high on a total return basis, but it needs to break out decisively;
2.) High-yield and corporate credit continues to trade well, with high-yield credit (junk bonds) up 10-11% in 2023 so far. Corporate spread widening usually occurs in tandem with recessions. In 2022, the [[HYG]] or iShares iBoxx $ High Yield Corporate Bond ETF declined -10.99%. It’s now “round-tripped” the last 24 months, just like the S&P 500 equity benchmark. Corporate defaults seem very well-contained, but corporate credit spreads are your “early warning” indicator for a deeper recession.
3.) The “downside trade” in the last 2 years involved higher interest rates (i.e. 10-year Treasury yield), a stronger dollar, higher crude oil, all resulting in lower stock prices in the last 24 months. Watch that pattern.
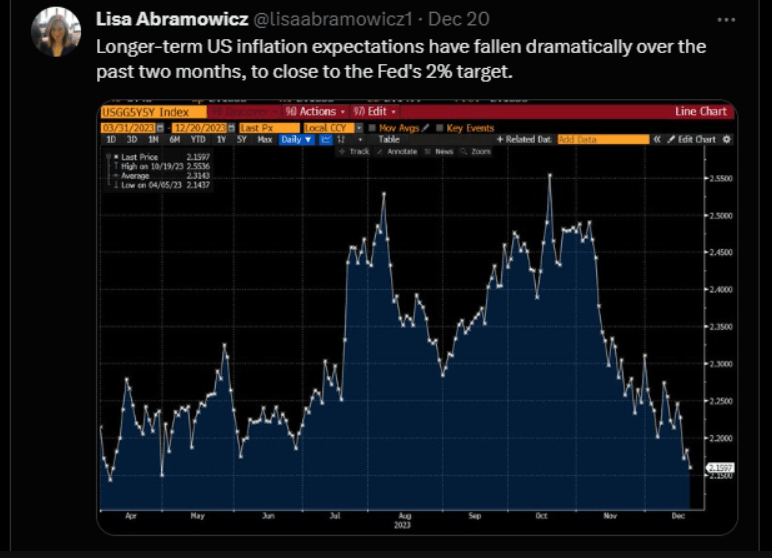
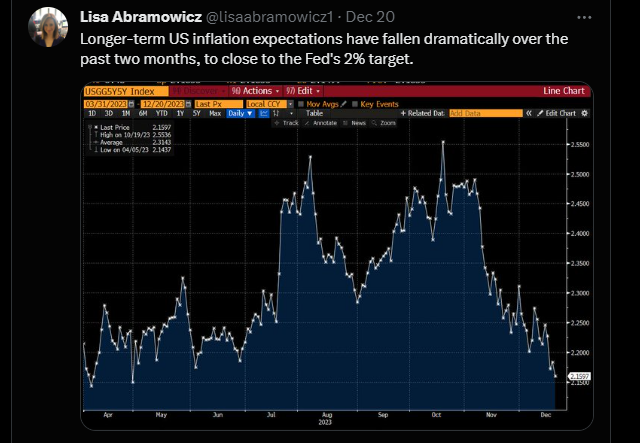
4.) Inflation would reignite and begin moving higher again, but Friday, December 23rd, 2023’s November PCE data came in below expectations again. Here’s the implication of falling inflation, courtesy of a Bloomberg reporter’s chart:
The constant “nattering nabobs” that are mainstream financial media talk constantly about inflation, but the money & banking, and economics texts explain that it’s “inflation expectations” that drive inflation and ultimately bond prices, although changes in the actual inflation rate do determine inflation expectations, so I’ve always felt that is somewhat of a circular argument.
5.) Here’s a fascinating table from Lawrence McDonald, the “Bear Traps Report” blogger and the author of the book on the Lehman collapse in 2008, “A Colossal Failure of Common Sense.” (Here’s the entire blog post from late November ’23: a great read from Lawrence McDonald.)
January ’24 could be interesting. It might be enough to shake out all of this renewed optimistic sentiment that we’ve seen in the stock market since November ’23.
6.) 2024 could easily see bonds outperform stocks, and yet both have a good year. The last “round-trip” for monetary policy was from late 2016 to late 2018, when Janet Yellen started raising the Fed funds rate off the ZIRP (zero interest rate policy) objective, and Jay Powell almost got us to 3% on Fed funds before the economic data started to slow sharply and Powell started to reduce the Fed funds rate. In 2019, Barclay’s Aggregate ( AGG ), or the bond market equivalent of the S&P 500, returned 8% and change, while the [[TLT]] or iShares 20+ Year Treasury ETF returned +14% in 2019. High-yield credit returned 14-15% in 2019.
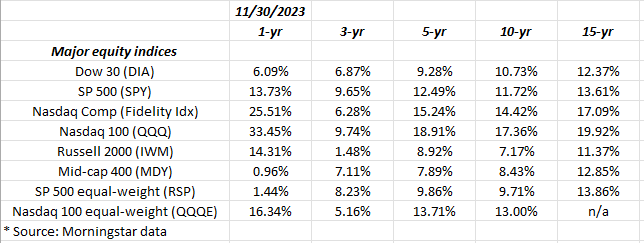
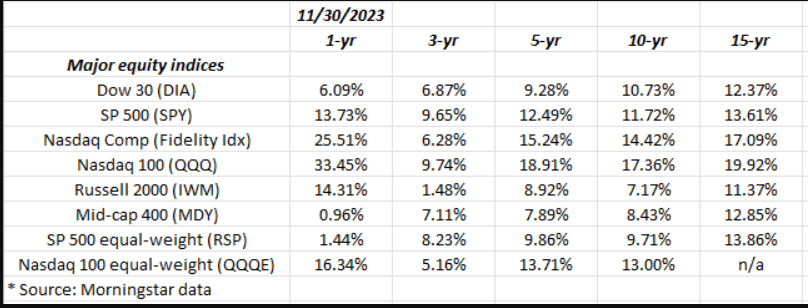
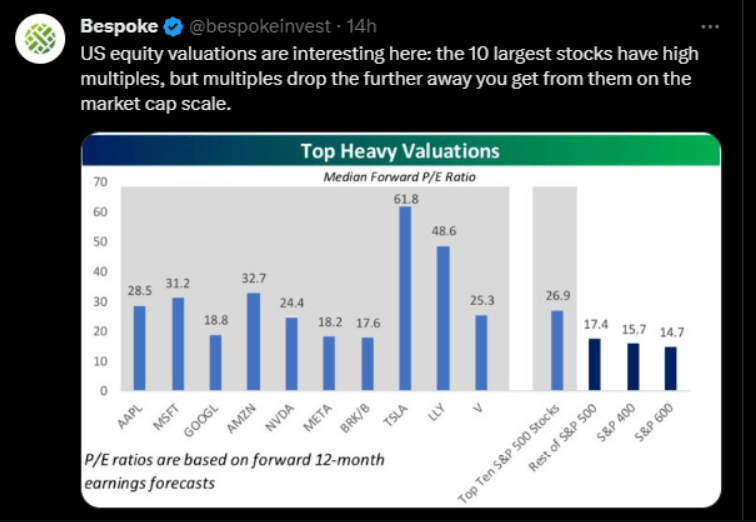
7.) The Magnificent 7 vs. small and mid-caps, emerging markets, and international investing: watch for rotation from the mega-caps to the small and mid-caps as well as international investing:
This Bespoke bar chart shows the various P/Es across US market capitalizations.
The above table is the major US equity benchmarks, with annual returns. The small- and mid-caps look reasonable from 3-year to 10-year returns, and between the two of those, mid-caps actually look a little better from a return perspective.
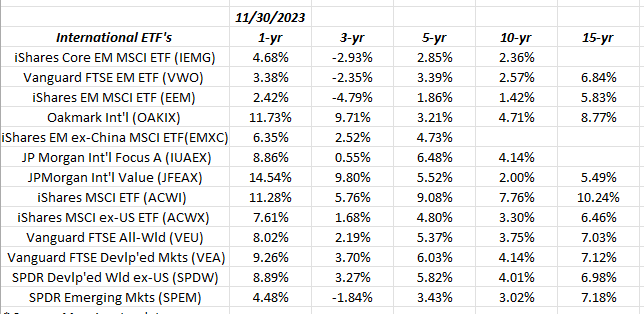
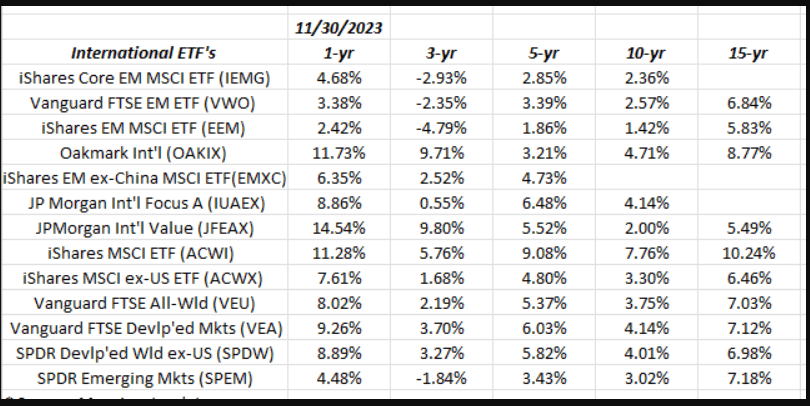
Looking at emerging market ((EM)) and international returns, they remain average to below average for all time frames. The emerging markets peaked in 2007, which (I think) means the last of the “hot” years for international and EM investing ended in 2007, so I suspect those years drop off the 15-year return data, and those 15-year returns will decline after January 1 ’24.
Every portfolio manager I talk to though, says the same thing: they always end up having a conversation with the client about international and EM exposure in the portfolio, and the fact that it’s typically a drag on portfolio returns. Portfolio managers have to hold international and EM for “uncorrelated” returns.
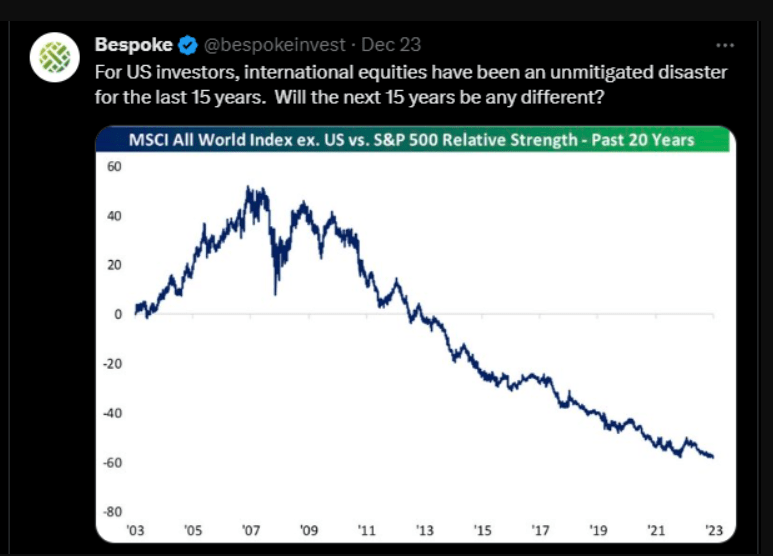
A Bespoke chart on relative strength: US vs International benchmarks.
Summary/conclusion:
Ultimately, I do think 2024 will be about the Fed and Jay Powell, and whether the FOMC reduces the Fed funds rate. Right now, monetary policy is very restrictive:
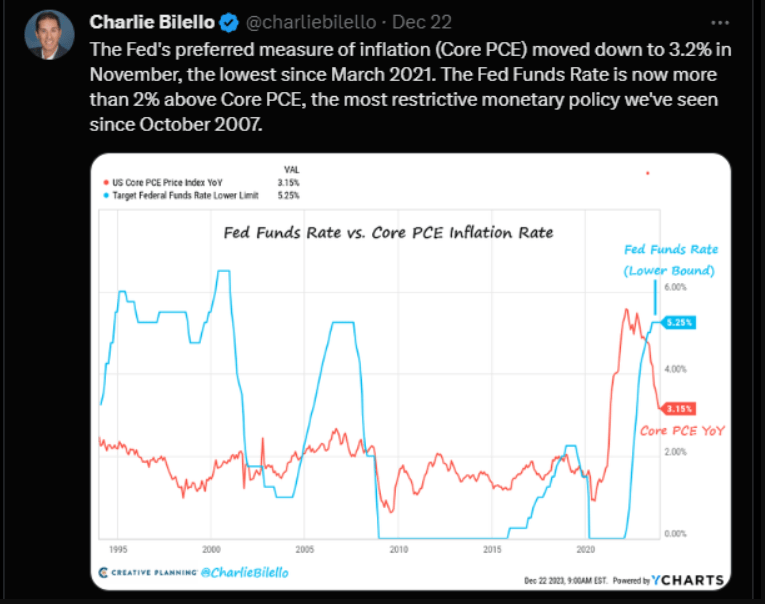
This chart shows the Fed funds rate remaining meaningfully above the Fed funds rate, which means that - well - monetary policy remains very tight, despite the FOMC having paused Fed funds rate hikes since July ’23.
Fed liquidity trumps almost everything, and if the Fed reduces the Fed funds rate in ’24, it will go a long way to ensuring positive returns for both bonds and stocks.
Here are three recent posts from the last month - here , here , and here - discussing this secular bull market in the S&P 500 and how much time might be left. If the Fed/FOMC cuts rates and stocks decline (read Part III or the 3rd link above), that usually denotes systemic problems within the US economy and it likely means US stocks are headed much lower, i.e. in 2001-2002, and 2008.
Readers should ignore all predictions, both here and particularly in financial media. No one has a fool-proof system to accurately predict the future, even most of the time. Just think about COVID, the Russian invasion of Ukraine, and October 7th, i.e. three events of the last three years that have materially altered the economic and financial landscape and have or will force global economies to adjust to the current environment.
None of this is a prediction, recommendation, or advice. Past performance is no guarantee of future results. All S&P 500 EPS and revenue data is sourced mostly from IBES data by Refinitiv, but occasionally from FactSet. All spelling errors and mistakes are 100% my own. Any prediction that is accurate is probably someone else’s. Capital markets change quickly for both the good and bad. If readers are uncomfortable with their own portfolio volatility, then adjust your portfolio accordingly.
Thanks for reading. Have a healthy and prosperous 2024.
Editor's Note: The summary bullets for this article were chosen by Seeking Alpha editors.
For further details see:
2024 Forecast: Done A Little Differently