TSLX - 21.3% Dividend Growth In 2023 Portfolio Yield 11% Timing The Market Improves Performance
2023-12-21 00:34:05 ET
Summary
- I review the high yield portfolio performance using a trading system that allows me to purchase shares at reduced cost.
- I made purchases during market declines in March and October, resulting in increased income growth.
- I use technical analysis tools and real-time trade alerts to take advantage of oversold and overbought signals in the market.
- I encourage everyone to read through this article, it could improve your portfolio performance.
Introduction
It’s now mid-December 2023 and I wanted to review my high yield portfolio performance. I’ve been using a trading system over the past two years that gives me the opportunity to purchase shares at reduced cost.
The first set of purchases were facilitated during March, 3 bank failures triggering a market decline. The next set of purchases occurred during October, where the 10 year Treasure yield hit 5% caused by hotter retail sales.
I received many oversold alerts during March and October and purchased new shares, see Table-1,2,3. During this year’s market strength, there were opportunities to maximize yearly cash flow. I did this with my current trading strategy outlined in article “ Chasing 15% High Yield Is Great In A Bear Market ”.
Chart-1 demonstrates the projected dividend growth rate based on new shares and increased company dividends. At the end of each year, I use the most recent expected dividends to project what total dividends I should receive for the following year. This is what Chart-1 green-bars indicate.
To calculate my overall actual growth rate, I need to wait until the end of the 2023 year. I determine my total dividends received from new shares, increased company dividends and special dividends. My actual growth rate is then calculated from my projected 2023 starting dividends.
My actual dividend growth rate increased 21.3% from what I was expecting at the start of this year. This is the second year in a row that exceeded 20%. My dividend growth over the past two years turned into an inflation eater.
Inflation has become permanent, and it is reducing people’s purchasing power. Creating a passive high yield income generator that does not depend on capital appreciation eases this issue.
I have learned over the years; market predictions are fruitless. This is the reason I constantly explain how my trading strategy is dependent on stock price. No one can predict a bull or bear market and only stock price volatility determines oversold or overbought signals. The following quotes are correct after many years of observation watching the market.
“A prudent speculator never argues with the tape. Markets are never wrong, opinions often are.”, Jesse Livermore.
"Fear incites human action far more urgently than does the impressive weight of historical evidence.", Jeremy Siegel
Extremes in price only occur a few times a year, see Chart-3. Just watching price change during the day does not enable you to determine if an individual investment has become oversold or overbought. Instead using technical analysis tools will allow you to catch important trading events.
For part-time investors watching the daily market becomes impossible while living a normal life dealing with everyday events. This was my previous dilemma trying to build a cash-flow portfolio while holding down a job and now retired.
When I first started the transition from growth to income, my focus was to build income and not worry about the price of the investment. Time was short before I needed to transition from employment earnings to passive income.
I found some high yield investments and purchased them. As time went on, I noticed my cost was always higher than if I waited for better entry points. Now after many years building my portfolio, I have learned to wait for oversold entry levels.
This is the reason I created the TEA/POT application. It’s a Portfolio Online Tracker “POT” that runs thousands of calculations on stocks during market hours. I then added a Trade Email Alert “TEA” application that sends me real-time trading alerts. This article reveals the yearlong results of this trading method, see Chart-3.
High-Yield Portfolio
The following three tables outline three stock groups contained in my high yield portfolio. The list of stocks is BDC (Business Development Company), mREIT (mortgage Real Estate Investment Trusts) and CEF (Closed End Fund).
The three tables display current stock yield, capital and income allocation. The last three columns identify dividend change, special dividends, and new shares purchase month.
| Table-1: YTD 2023 |
| Type |
| Symbol |
| Yield |
| %CapAlloc |
| %IncAlloc |
| DivChg |
| Special |
| New Buys |
| BDC |
| ( ARCC ) |
| 9.8% |
| 9.3% |
| 8.0% |
| BDC |
| ( TSLX ) |
| 8.7% |
| 9.1% |
| 7.0% |
| 2.2% |
| 14.4% |
| BDC |
| ( CSWC ) |
| 9.8% |
| 9.2% |
| 7.9% |
| 9.6% |
| 10.6% |
| BDC |
| ( HTGC ) |
| 10.1% |
| 7.5% |
| 6.7% |
| 11.1% |
| 22.2% |
| BDC |
| ( GBDC ) |
| 9.8% |
| 6.5% |
| 5.6% |
| 12.1% |
| 8.3% |
| BDC |
| ( TPVG ) |
| 15.2% |
| 5.2% |
| 7.0% |
| 8.1% |
| May |
| BDC |
| ( GSBD ) |
| 12.0% |
| 4.9% |
| 5.1% |
| Mar |
| BDC |
| ( OCSL ) |
| 10.9% |
| 1.9% |
| 1.8% |
| 1.9% |
| 3.2% |
| BDC |
| ( BBDC ) |
| 11.8% |
| 0.4% |
| 0.5% |
| 8.3% |
| Mar |
| 53.9% |
| 49.5% |
| Table-2: YTD 2023 |
| Type |
| Symbol |
| Yield |
| % Cap Alloc |
| % Inc Alloc |
| Div Chg |
| Special |
| New Buys |
| mREIT |
| ( STWD ) |
| 8.9% |
| 7.9% |
| 6.2% |
| mREIT |
| ( BXMT ) |
| 11.0% |
| 4.8% |
| 4.7% |
| mREIT |
| ( RITM ) |
| 9.2% |
| 2.8% |
| 2.3% |
| Mar |
| mREIT |
| ( ABR ) |
| 11.2% |
| 2.3% |
| 2.3% |
| 7.5% |
| Mar, Oct |
| mREIT |
| ( ACRE ) |
| 12.3% |
| 1.4% |
| 1.5% |
| 4.5% |
| Oct |
| 19.3% |
| 16.9% |
| Table-3: YTD 2023 |
| Type |
| Symbol |
| Yield |
| % Cap Alloc |
| % Inc Alloc |
| Div Chg |
| Special |
| New Buys |
| CEF |
| ( PDI ) |
| 14.8% |
| 5.8% |
| 7.5% |
| CEF |
| ( ECC ) |
| 17.8% |
| 5.5% |
| 8.6% |
| 40.5% |
| Oct |
| CEF |
| ( GOF ) |
| 16.3% |
| 5.2% |
| 7.5% |
| Oct |
| CEF |
| ( WDI ) |
| 11.9% |
| 3.9% |
| 4.1% |
| 9.4% |
| Mar, Oct |
| CEF |
| ( PTY ) |
| 10.7% |
| 3.2% |
| 3.0% |
| Mar |
| CEF |
| ( ARDC ) |
| 10.5% |
| 3.2% |
| 2.9% |
| 14.6% |
| Mar, Oct |
| 26.8% |
| 33.6% |
Most shares acquired (last column) occurred in March and October. Those two months galvanized my increased income growth for the year.
As a side note, I only purchase RIC (Regulated Investment Company) stocks that invest in various securities and distribute most of their income to shareholders. A RIC can avoid paying corporate income tax if it meets certain requirements, such as distributing at least 90% of its taxable income to shareholders annually. This method provides a tax-free investment method to increase income growth in a tax-sheltered account.
Cash-Flow Performance
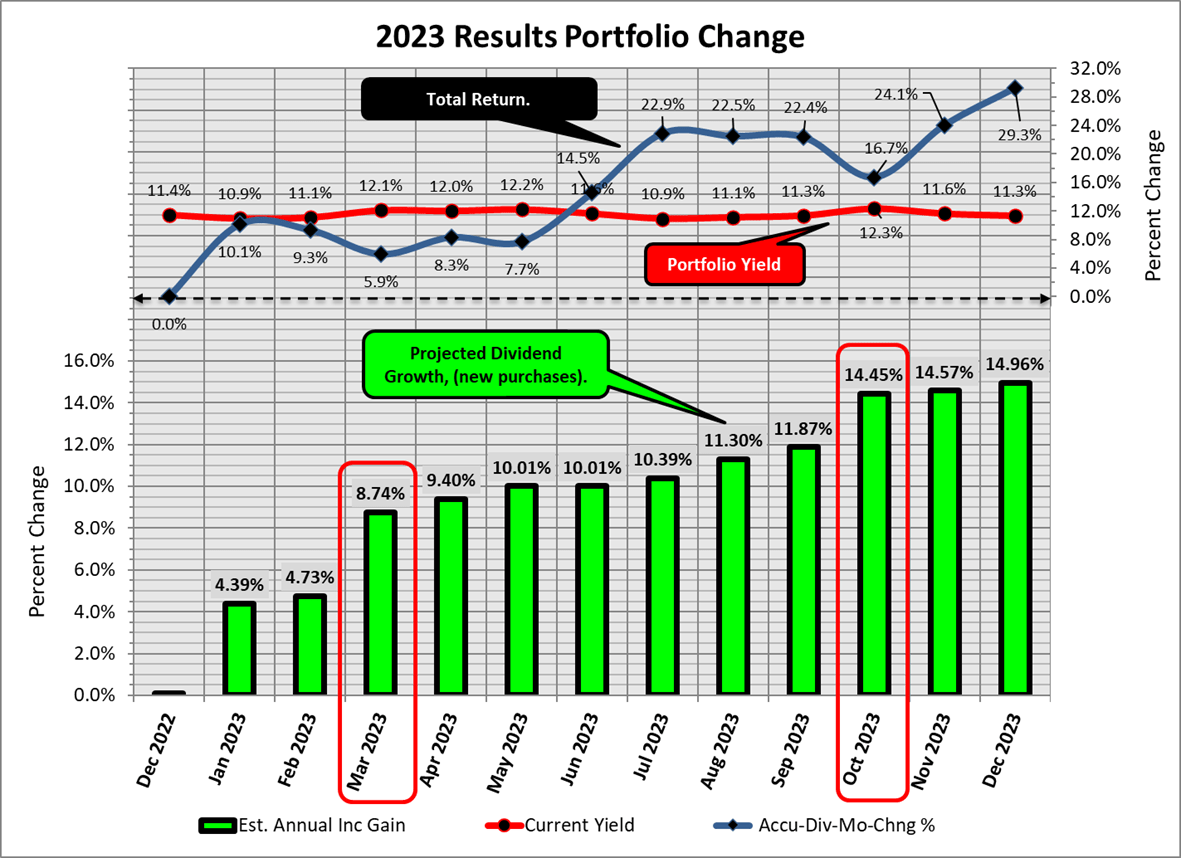
The following chart displays each month’s income performance, portfolio yield, total return and projected dividend growth brought about by increasing shares and dividend changes. Note: results are to December 15th.
Chart-1; Portfolio YTD cash flow
Author
The top blue-line is the total return for the portfolio. This is the total portfolio price change during the year, along with actual dividends accumulated each month. I typically do not dwell on total return, but since 2022 was a declining year it’s good to see a 29% recovery.
At the top of the chart, the yield red-line throughout the year generally stayed in the 11 to 12% range. Notice how the yield jumped during both the March and October market decline.
The bottom green-bars reflect the projected dividend growth after purchasing shares and any dividend changes during the year. Notice the jump in dividend growth for March and October, the red-rectangles highlight both events. Projections of future dividends at the end of 2023, I consider the baseline for the 2024 year.
The last few weeks in December might provide an opportunity to purchase additional shares. If this happens it could be a tax selling event to offset investors’ capital gains and fund-managers window dressing. Just like last year I’ll accumulate more shares if the opportunity presents itself, boosting my dividend income.
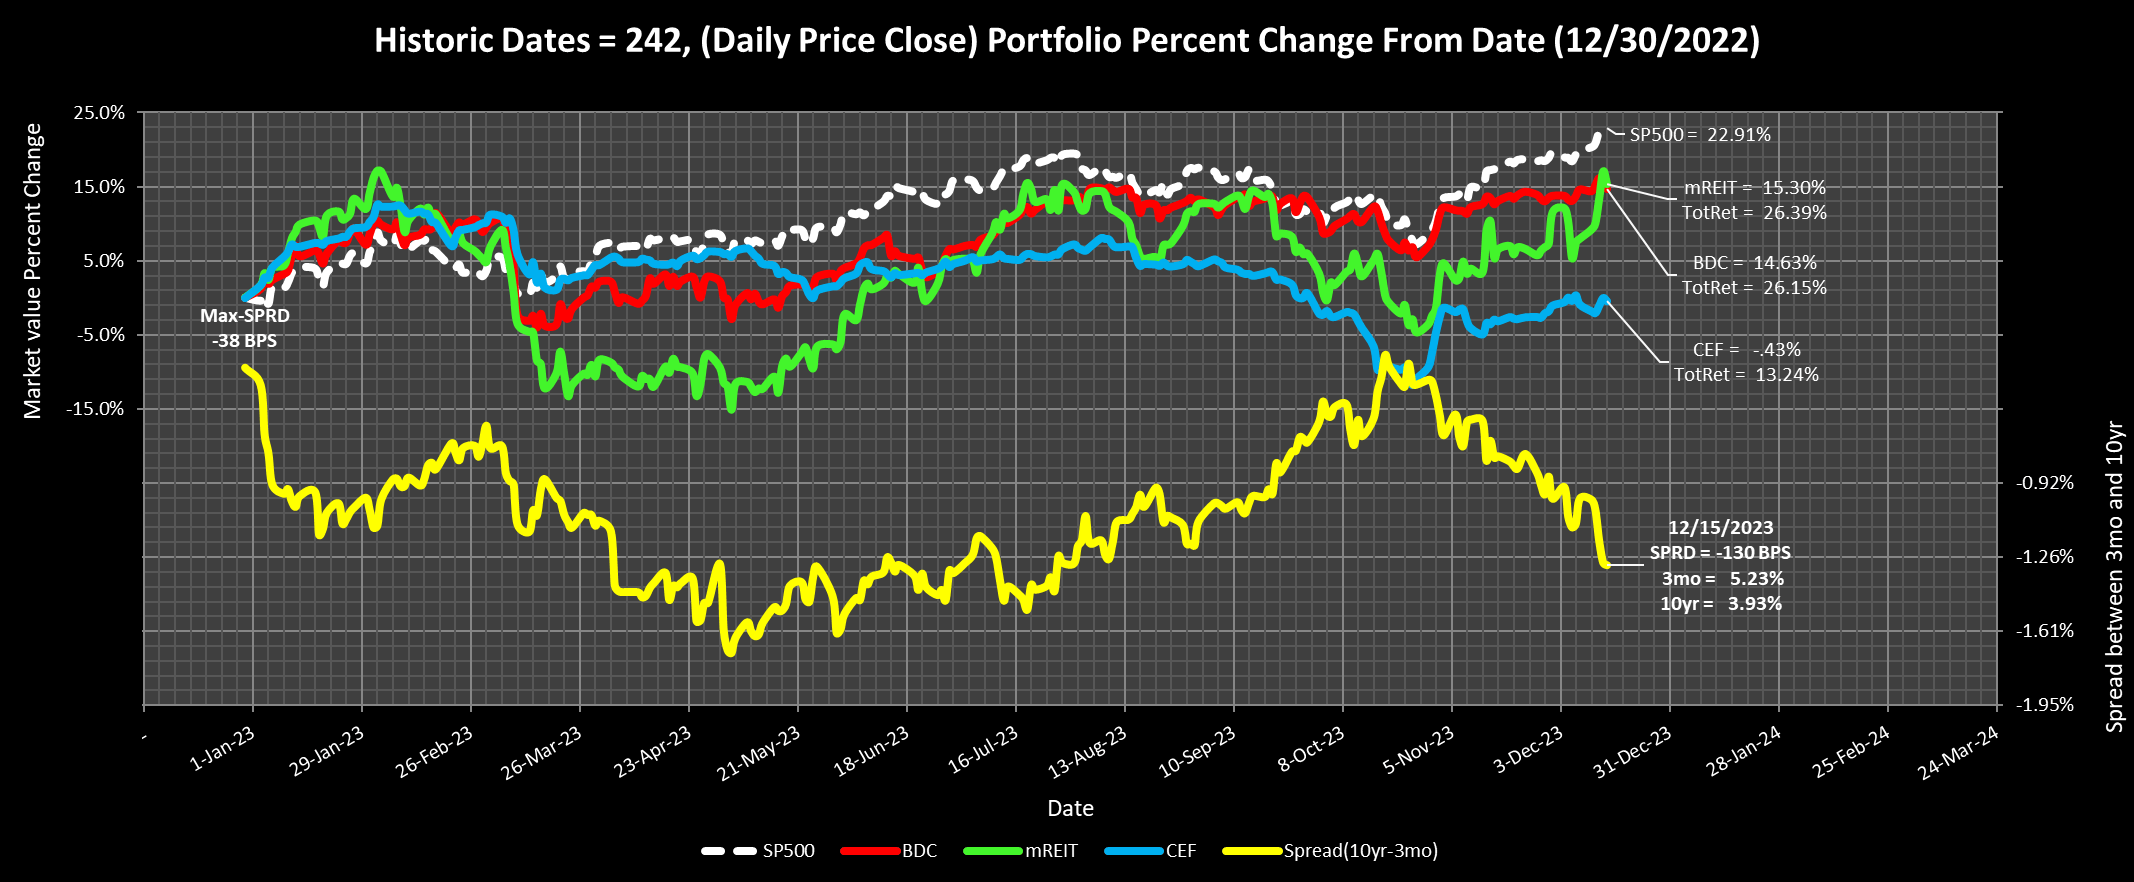
Chart-2; Performance between 3 stock groups
Author
This chart shows the relationship between each of the three stock groups along with the S&P 500. The total return percentage under each group name represents the dividends added to price, supplementals not included.
As of this writing, total returns (price plus dividends) are displayed below.
- mREIT green line, with a total return gain of 26%.
- CEF blue line, with a total return gain of 13%.
- BDC red line, with a total return gain of 26%.
It must be noted stock prices are always in motion, one year down the next up. Tangible dividends are more stable and are considered the cornerstone of my high yield strategy.
One of the interesting items on this chart is the yellow line showing the spread between the 3-month and 10-year Treasury interest rates. The short-term rate has been higher than the 10-year all year long. This is typically a leading indicator of a recession sometime in the future.
Trade-Alerts, RSI observations
This one chart is the most fundamental evidence of my trading strategy. It is based on market psychology trying to anticipate sudden events. We had two major buying events during the year.
At times, investors might sell their holdings out of fear of what could happen. They might reevaluate the situation and get back into the stock they sold at a higher price or worse yet, stay out of the market. Knowing this behavior, I have proved to myself that being a contrarian investor works and reenforces my trading strategy.
The RSI counts in the chart below indicate the severity of a market decline. Most of my purchases listed in Table-1,2,3 was in the March and October time frame. I receive portfolio analysis every day of such events that help navigate price anomalies.
It is key to understanding how effective the tracking ability of the TEA/POT method monitors the market in real-time over the course of a year. This trading application is automated, and the PC is sitting in a closet running thousands of calculations every trading day. If an alert is detected the application sends messages to my cell phone.
One of my trading signals is the RSI ( Relative Strength Index ). It is a momentum oscillator that measures the speed and magnitude of price changes. It ranges from 0 to 100. Values below 30 indicate oversold conditions. Values above 70 indicate overbought conditions.
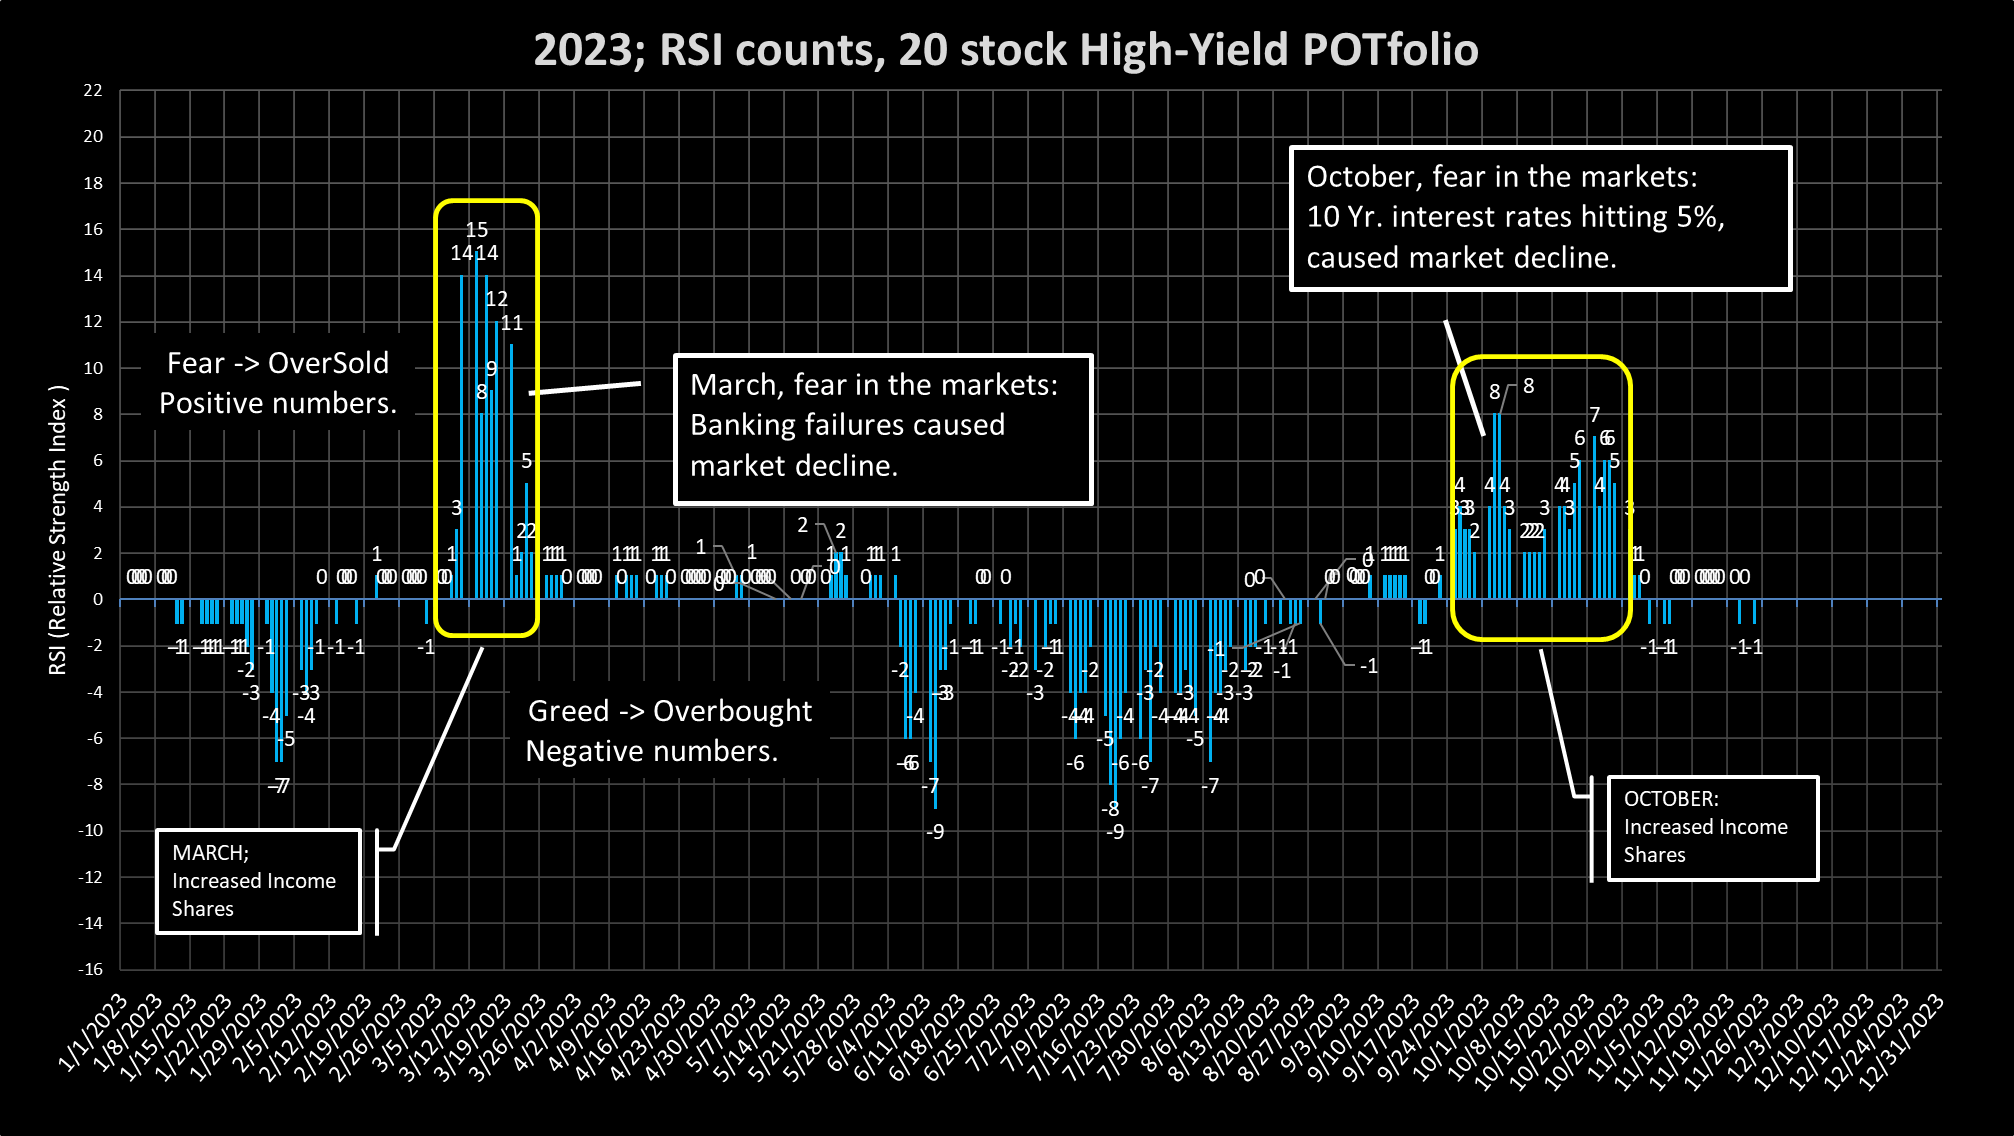
Chart-3; Infrequent Trade Alerts
Author
Chart-3 illustrates the infrequent market selloff events during the 2023 year. The numbers attached to each blue-bar are the number of stocks receiving oversold (positive numbers) or overbought (negative numbers) trading signals.
Notice how March and October (yellow-rectangles) relate to Chart-1 green dividend bars (red-rectangles). March alerts registered a maximum of 15 oversold stocks out of my 20-stock portfolio and in October there were 8 maximum oversold stocks. I had a lot of options to boost my income during both events.
What I noticed over time is the market becomes increasingly fearful just a few times each year where many stocks become oversold. The following quote describes these rare events.
“Opportunities come infrequently. When it rains gold, put out the bucket, not the thimble.” Warren Buffett
This is how I act upon the rare oversold events during the year. Every day when the market is open, I receive a list of stocks in my portfolio providing real-time RSI, price Z-scores, and moving averages, Please see the BLOG I created to explain each technical analysis signal for an explanation of each parameter.
Actual Email Alerts
I have the option to purchase new shares when I receive Email notifications of oversold signals. I receive these Email Alerts on my cell phone during market hours. The following two buy signals I received for Arbor Realty Trust ( ABR ). My purchase price was $10.85 in March and $12.25 in October.
ABR = $10.71 Yield = 14.94%
Fri, Mar 24, 7:36 AM
OverSold [4 star]
[*] RSI = 22; is < than Limit of 30; (10) Days
[*] Z-score = -2.5; is < than Limit of -1.0
[*] Price SMA50 = -31.68%
[*] Price SMA200 = -30.56%
ABR = $12.40 Yield = 13.87%
Fri, Oct 27, 8:35 AM
OverSold [4 star]
[*] RSI = 26; is < than Limit of 30; (1) Days
[*] Z-score = -1.0; is < than Limit of -1.0
[*] Price SMA50 = -17.51%
[*] Price SMA200 = -10.45%
- Info: RSI (Relative Strength Index) a Momentum indicator.
- Info: Z-score is the Price standard deviation from the mean.
- Info: Price percent from the 50-day Simple Moving Average.
- Info: Price percent from the 200-day Simple Moving Average.
Having a system to monitor real-time events creates the best option to pick up new income shares during rare events. Timing the market does work with the right tools to supercharge dividend growth.
As a side note, In July I received an overbought signal for ABR at the $17 level. If I was a capital gain investor, I could have sold for a nice $6 profit from my March purchase. I’m not a share flipper for capital gain, but an alpha dividend seeker growing my passive income over time. Here is the overbought email-alert.
ABR = $17.37 Yield = 9.67%
Fri, Jul 28, 7:51 AM
OverBought [4 dash]
[-] RSI = 70; is > than Limit of 70; (1) Days
[-] Z-score = 2.3; is > than Limit of 1.0
[-] Price SMA50 = 16.10%
[-] Price SMA200 = 20.83%
Conclusion
The first month of 2023 was positive for the market and generally indicates a positive market for the year. The market went through some rough patches in March and October that was not expected. Both negative market events were met with selling, and I took advantage of increasing shares that created additional income growth. I’m a buy-low-hold investor. I typically concentrate on the buying side of an investment.
Now for the final two months of the year the market is once again climbing in value and has put a stop to my oversold trading strategy. This looks like it will continue into the following year. I will wait patiently for buy alerts once again to increase shares. They don’t come often, but I’ll be ready to reinvest my surplus dividends.
It is my belief as a high yield income investor, stock price is an illusion because at times it does not reflect the true value of a company. Stock prices are influenced by many factors, such as supply and demand, investor psychology, and market manipulation.
These factors can create price distortions in the market, leading investors to overestimate or underestimate the potential returns of a stock. This is why I focus on the tangible side of an investment, namely the dividend and let price find its own way in this manic-depressive market.
As presented in this article I have removed the emotional behavior concerning stock prices by implementing a trading plan that uses technical analysis. I have accomplished this by using indicators to buy stocks when they have low RSI and low Z-score values, meaning they are oversold and undervalued relative to their historical average.
Conversely, I can sell stocks when they have both high RSI and high Z-score values, meaning they are overbought and overvalued relative to their historical average. This strategy assumes that prices tend to revert to their mean over time and that extreme deviations are temporary distortions.
For further details see:
21.3% Dividend Growth In 2023, Portfolio Yield 11%, Timing The Market Improves Performance