PMT - 3 Big Dividend Yields Up To 13%
Summary
- We own shares in all three picks.
- Up to 33% upside to book value. Some peers trade above book value.
- Dividends were steady. The only dividend reduction in the batch was less than 5%.
Get ready for charts, images, and tables because they are better than words. The ratings and outlooks we highlight here come after Scott Kennedy’s weekly updates in the REIT Forum. Your continued feedback is greatly appreciated, so please leave a comment with suggestions.
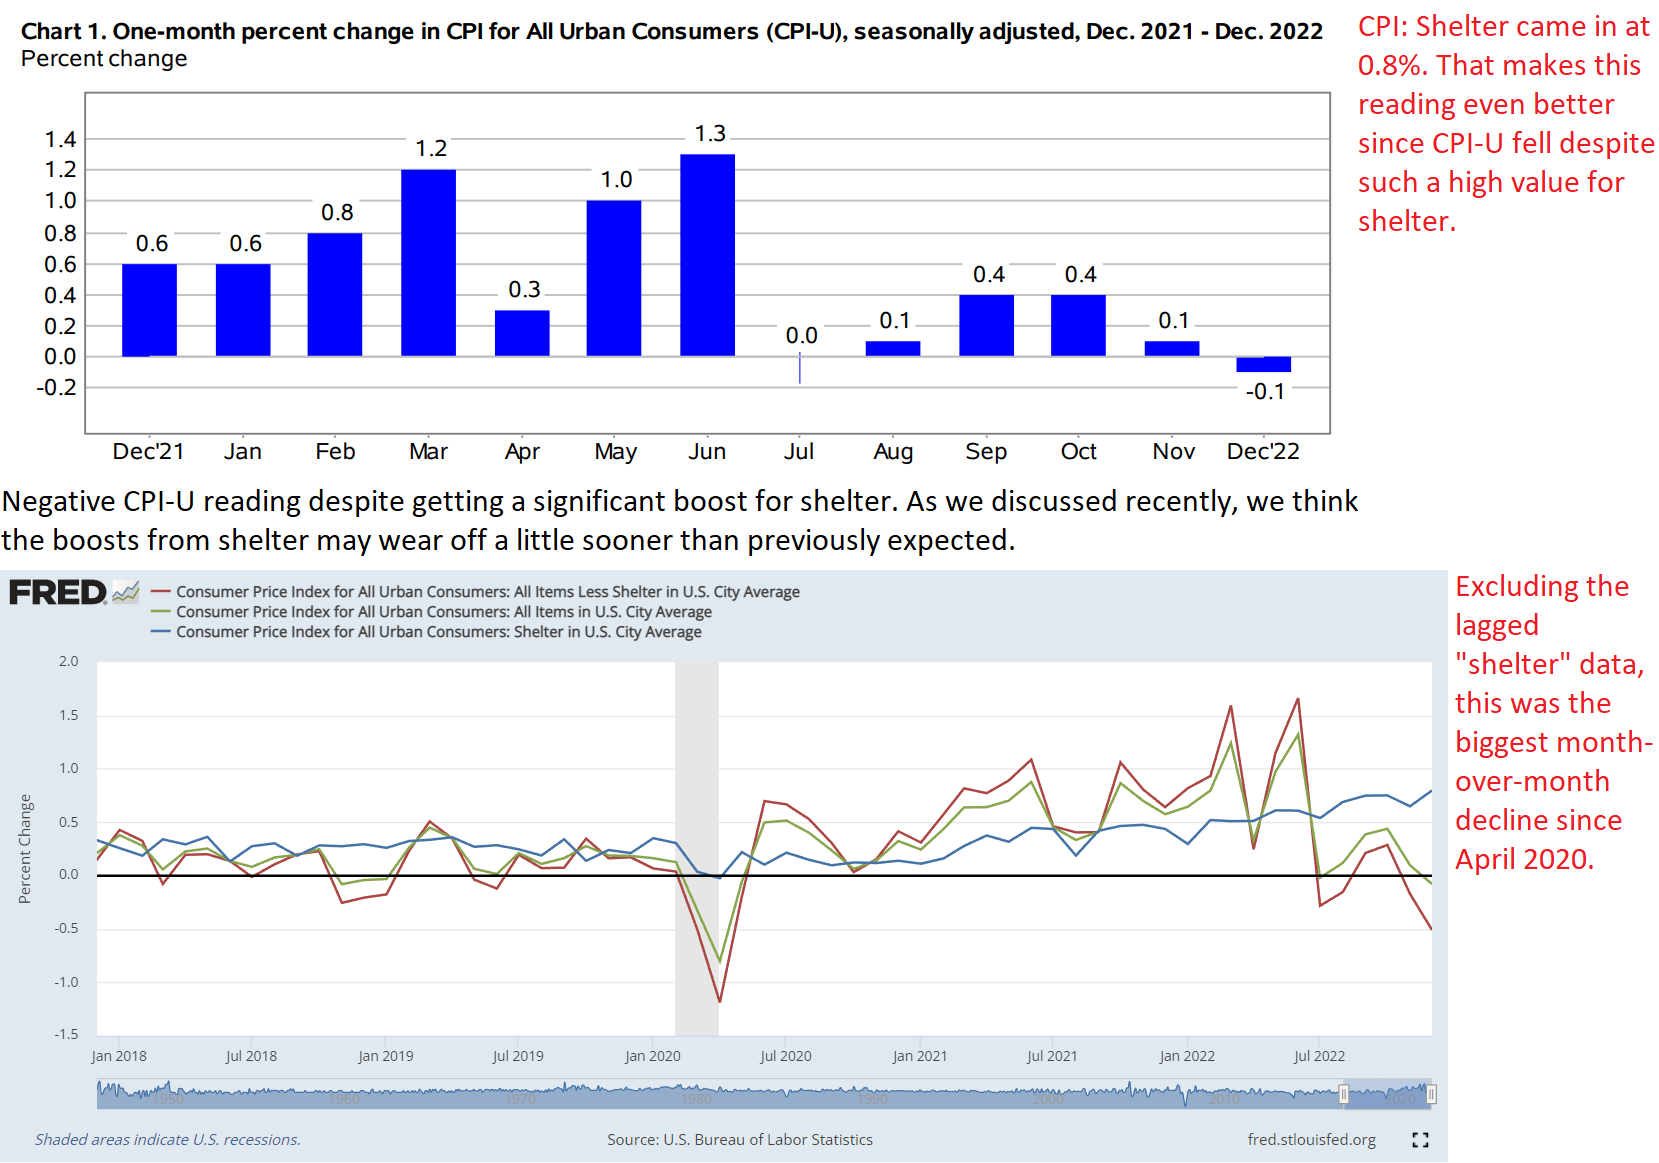
As we predicted repeatedly over the last several months, inflation continued to come in light. The latest report provided further evidence for our call:
FRED, BLS, The REIT Forum
Even with CPI: Shelter trying to inflate the reported values, inflation turned negative month-over-month. We don’t want to make too much out of a single reading given the volatility, but this deserves to make some headlines. Inflation died in early July 2022. It’s been six months with cumulative inflation of 0.9%. That annualized rate would be less than 2%. Excluding the lagged CPI: Shelter data, the total inflation is about negative 0.6% over the last six months. That’s coming from negative 0.5% this month and a cumulative negative 0.1% for the prior five months.
Well, I guess it’s time to queue up a few people who want to replace CPI with the "egg index." It doesn’t even need values. It’s just a few people screaming about egg prices. It transitions to yelling about how the Federal Reserve should raise interest rates instead of raising more egg-laying hens.
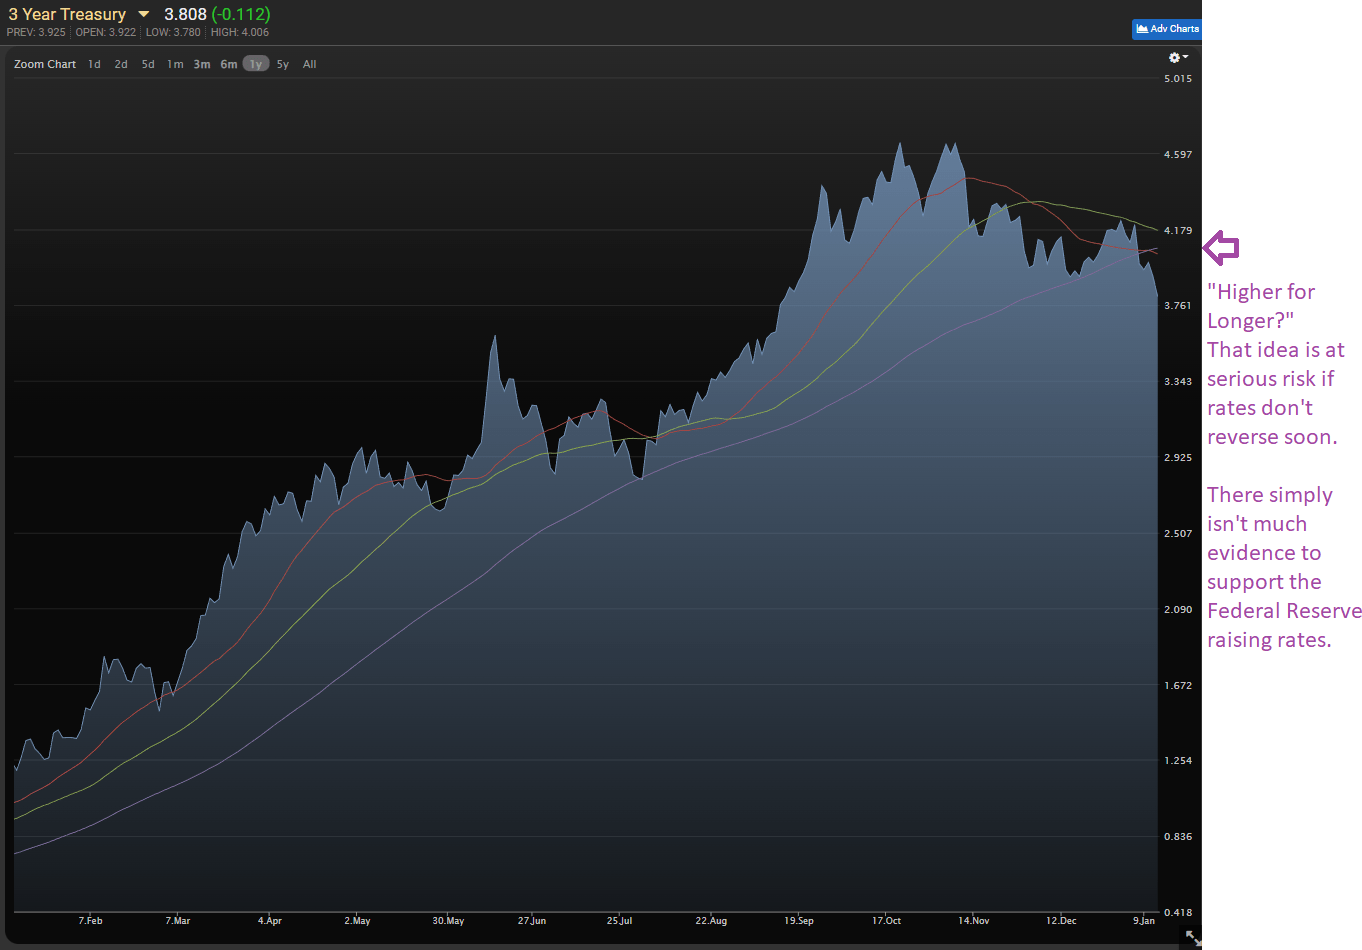
Treasury Rates
As the market catches up to the data on interest rates, we’re seeing a significant drop in Treasury yields. A few days ago, the 3-year Treasury broke below the 100-day moving average for the first time in over a year. Today’s report pushed the value even lower.
MBSLive
We’re not quite out of the woods yet, but the signs look very positive.
Now we’re going to get into some investing ideas.
Pair Trade
I’ll share several ideas.
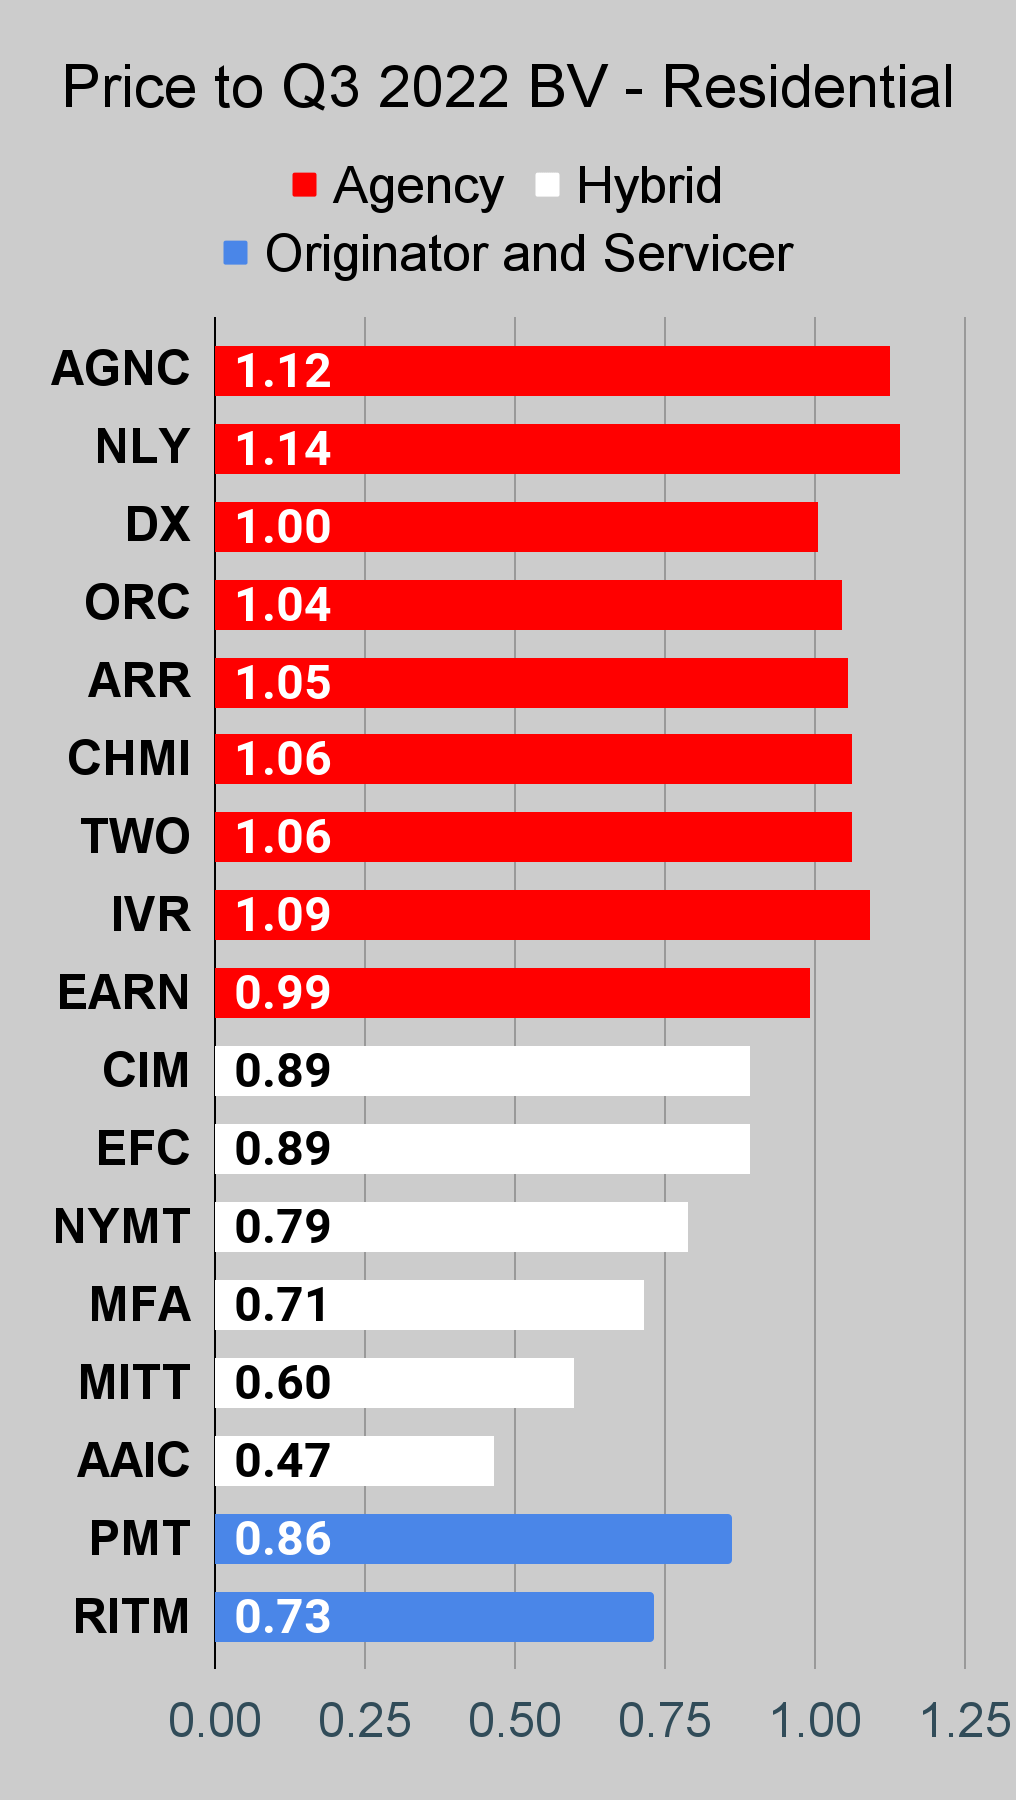
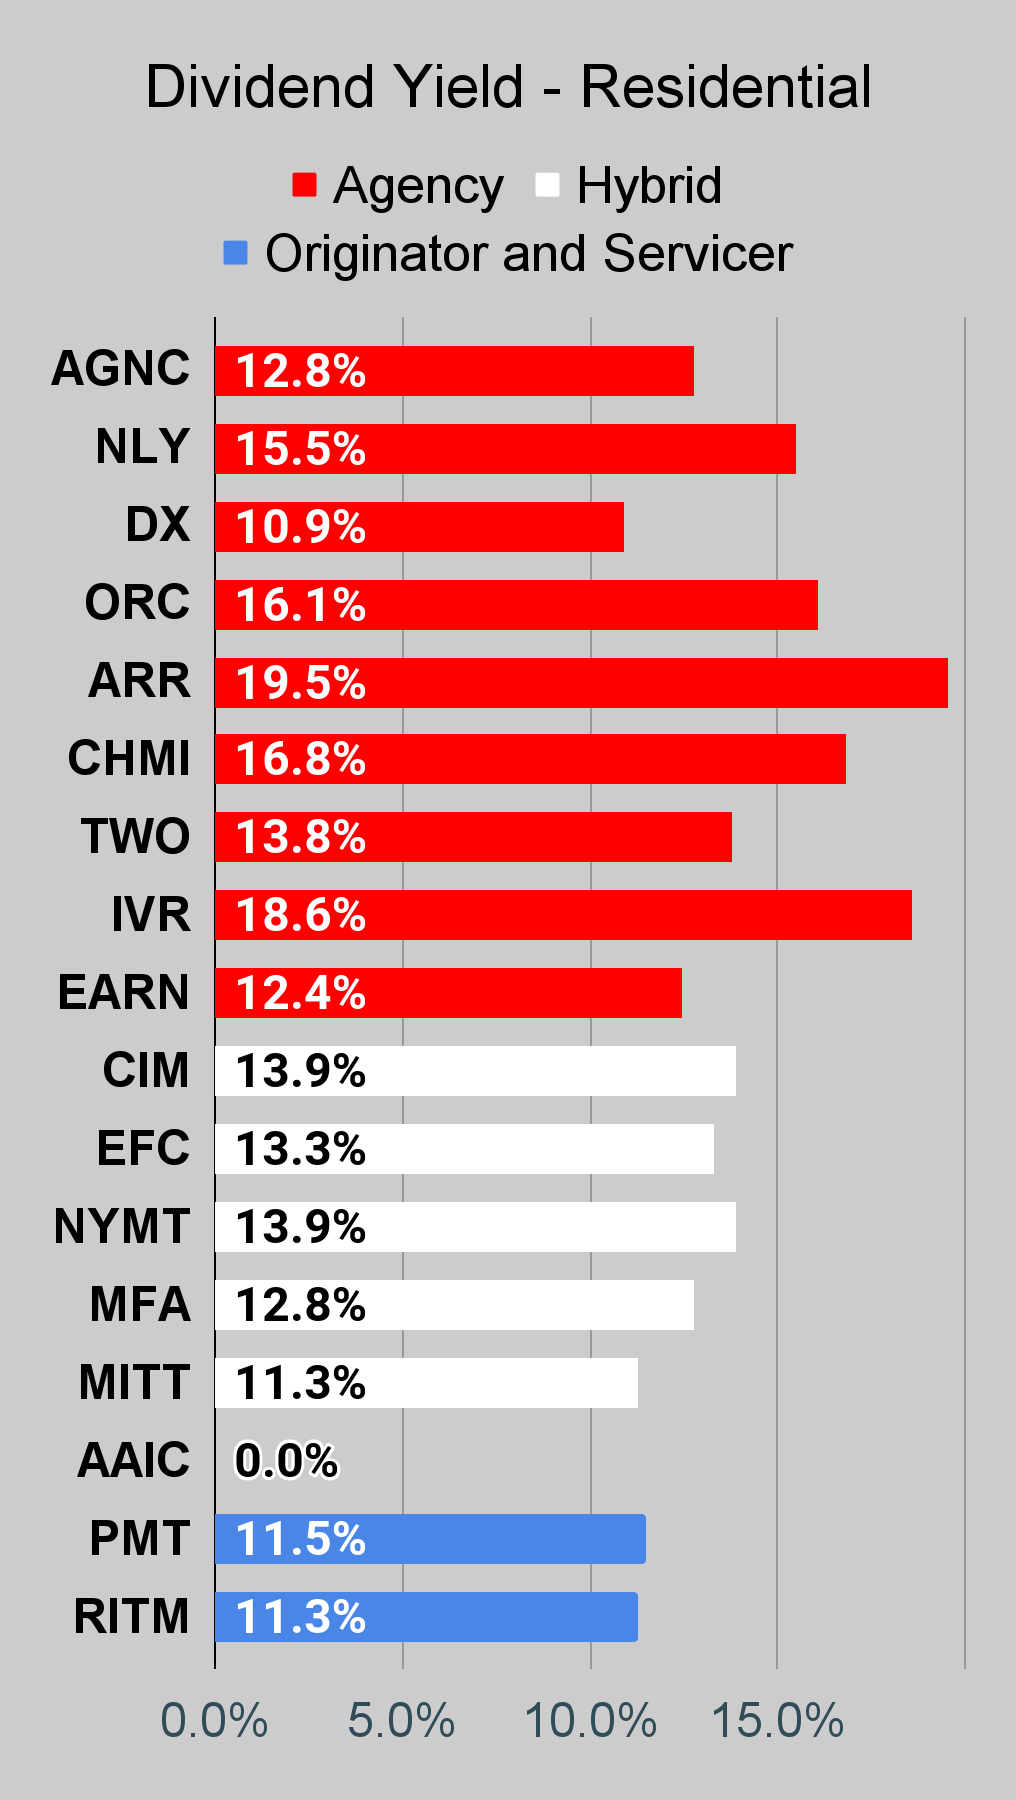
For investors who want to be in the agency mortgage REITs, we expect Dynex Capital ( DX ) to be a better choice than AGNC, NLY, TWO, ORC, ARR, CHMI, or IVR. Check back in a year or two and see if DX beat the average for that group. You can assume dividend reinvestment or taking dividends in cash, but the change in the share price must be in the equation. Whichever is worse for my theory. I should be right by a large margin to easily offset using whichever metric turns out worse. Yeah, I know there’s one or two readers who will claim only the dividend matters therefore they should buy the absolute highest yield. There’s a reason those guys can’t afford to retire.
We picked up some DX in late November, but it’s rallied a bit (along with several peers), so the discount isn’t quite as large. Still the best deal among the agency mortgage REITs. DX trades around .93x our estimated book value, whereas many peers are trading at 1.0x or higher. Investors who are looking for a small pair trade may want to look at pair trades here.
Shorting without a hedge would be too risky. But with DX there to benefit if spreads tighten, investors could play the difference in valuation.
How about a few other ideas?
Common Share Ideas
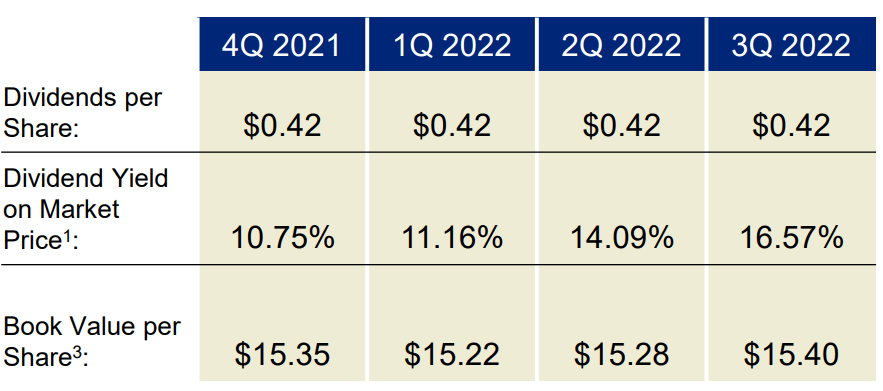
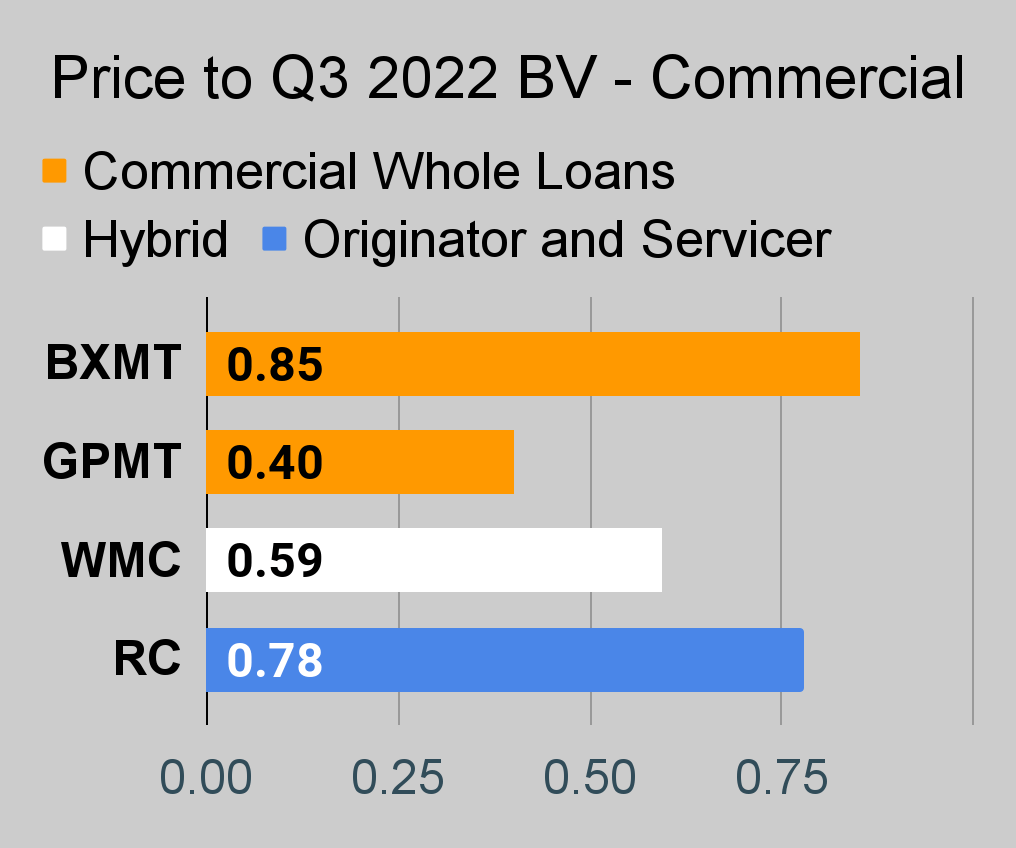
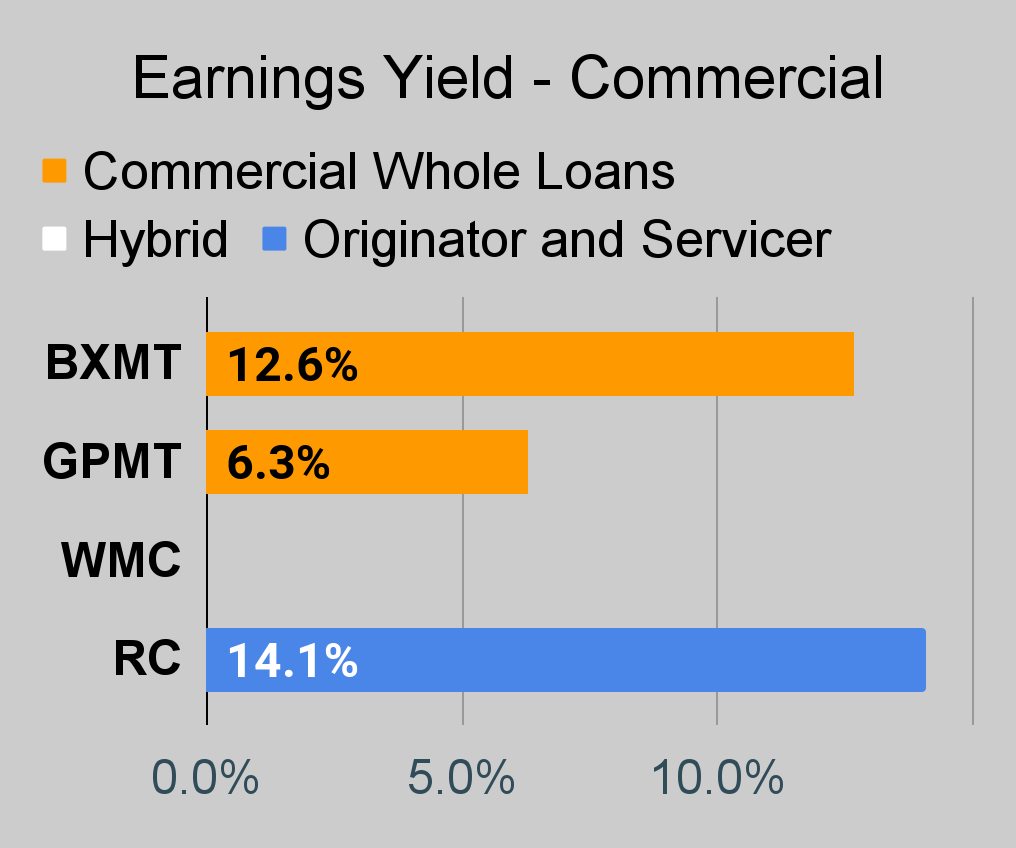
Rithm Capital Corp ( RITM ) and Ready Capital ( RC ) have price-to-estimated book ratios between .74 and .80. That’s a respectable discount and deserves to be on the radar. Those shares could rally quite a bit. Their portfolios withstood rising rates exceptionally well.
Want an example? Here’s RC’s book value per share:
Ready Capital Q3 Presentation
That’s pretty good, right? They did reduce the dividend, but it was only reduced from $.42 to $.40. Usually when you hear a mortgage REIT reducing their dividend it is a dramatic cut. Think book value swung dramatically in Q4 2022? We don’t. We’re projecting a pretty small change.
We own shares of RITM and RC. RITM is one of our largest positions at 7.38%.
Preferred Shares
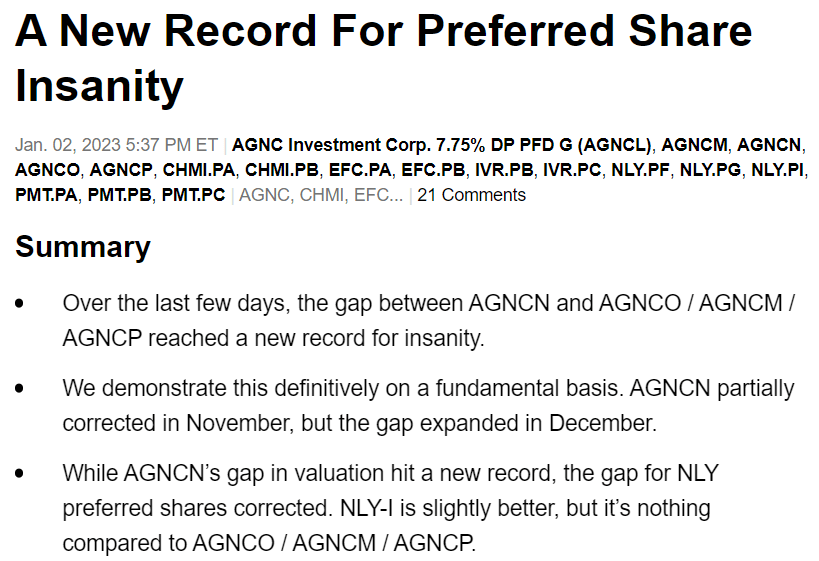
It’s time for a lesson on preferred shares. I published a massive subscriber article on preferred shares on Jan. 2.
Seeking Alpha
In the executive summary, we went on to say:
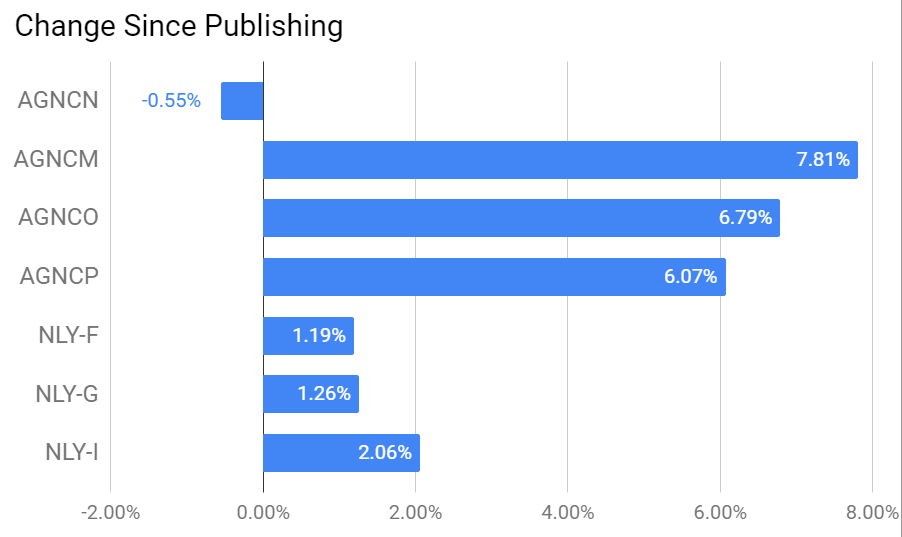
“The NLY preferred shares are fundamentally similar to AGNC preferred shares, yet the NLY preferred shares have only a moderate disparity in relative value. None of the other preferred shares we cover have a disparity remotely close to the disparity between AGNCN and AGNCO/AGNCM/AGNCP. I expect to actively trade between these shares when we have opportunities to enhance our risk/reward profile.”
How did that play out?
The REIT Forum
Some investors don’t want to bother swapping a position just to earn 6% to 7.8% instead of losing .55%. I can’t speak to their reasoning, but for me that difference is material. If you’re getting an extra 7% on $50,000, you’re talking about $3,500. That’s not life-changing money, but it’s better than a poke in the eye.
We own shares in AGNCP, AGNCO, and AGNCM. The combined position is worth over $100,000. I guess that makes the idea better than two pokes in the eye?
The reasoning
Preferred shares should be easier to analyze and compare than many other investments. To evaluate these shares on a fundamental basis, investors only need to:
- Look at projected future cash flows.
- Assess the relevant risks.
- Determine appropriate discount rates.
- Compare discounted cash flows.
That’s the simple version. It’s four steps. The most complicated part is evaluating the relevant exposure to each risk factor. That’s also the step where most analysts struggle. If that step is not handled correctly, the flaw will run through the rest of the steps to contaminate the results.
Discounted Cash Flows
If markets were actually efficient, every investment would be priced based on discounted cash flows. This makes sense because every investor could see the future interest rates in an efficient bond market and use that to discount every cash flow. Under efficient markets, every investor has this information and can do it instantly.
Of course, that doesn’t happen. The markets make significant mistakes frequently. If someone truly believes the markets are efficient, they should simply be looking to combine an “all world” index with a bond mutual fund to reach their target risk level.
Note: Under efficient markets, the purchase price and eventual sale price for any investment is still generated based on a perfect analysis of the discounted future cash flows. Therefore, two similar investments would have similar price movements by definition.
Discounted Cash Flows Drive NPV
The point of discounted cash flows is to generate the NPV (Net Present Value). If we have all the future cash flows figured out and the appropriate discount rate, we can find the net present value by discounting each future cash flow. Theoretically, the NPV of all future cash flows should be equal to the share price.
Of course, the market is not efficient. The NPV of future cash flows may be materially different from the share price. However, discounting future cash flows is a major part of our preferred share valuation process; it has worked very well across shares that are not AGNCN.
Market Failure
AGNCN is an outstanding example of market failure. Without a doubt, it is one of the best examples of a market failure I’ve ever seen. We can say this because of the huge disparity in valuation between:
It's particularly interesting because three of those shares have consistently sent similar signals about valuation:
- AGNCM
- AGNCO
- AGNCP
These three shares have rarely deviated from each other by more than 4% or so. Since they’ve stayed within a fairly tight range, but still moved back and forth, investors have enjoyed several opportunities to trade between them.
A New Position
The full article is much longer, but it’s almost time to publish. I’ve still got another share to mention.
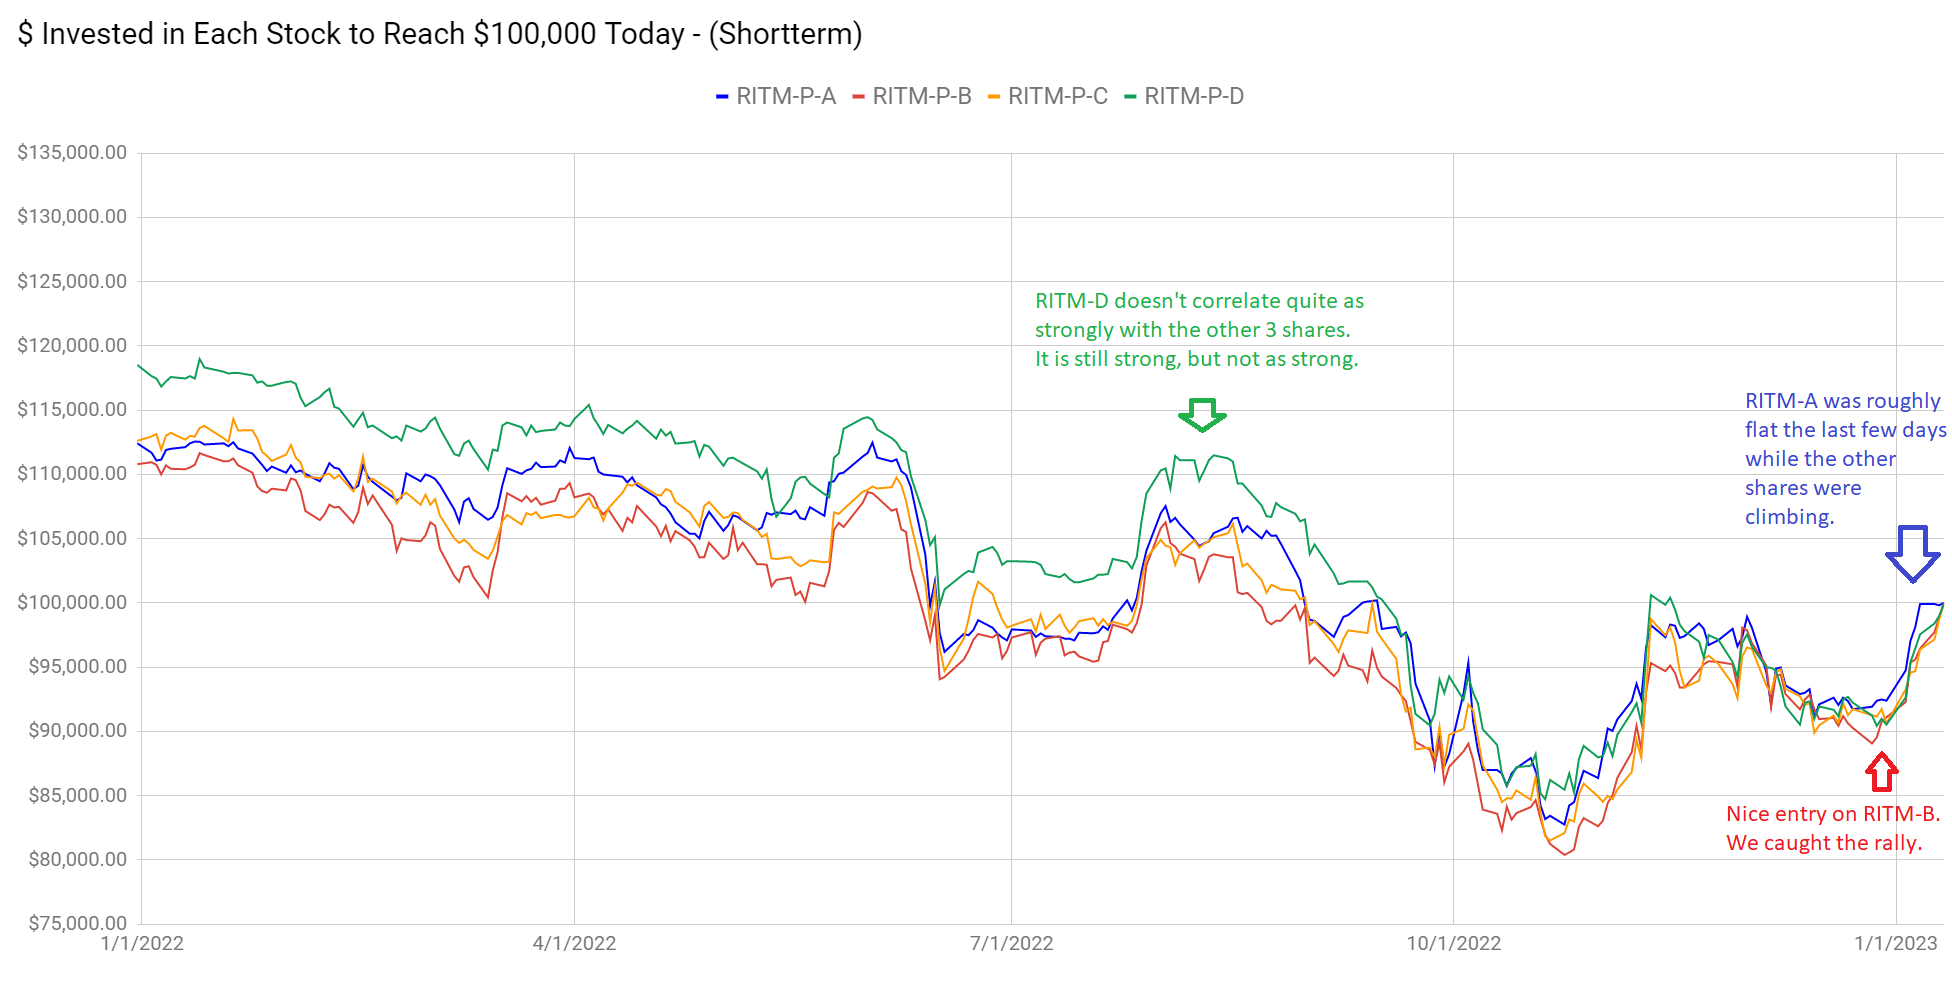
We finally purchased shares of RITM-A (RITM.PA).
- Sold 667 shares of RITM-B ( RITM.PB ) at $21.10
- Purchased 660 shares of RITM-A ( RITM.PA ) at $21.30.
It underperformed peers recently and finally gave us the right opportunity to pick up the shares. We closed out our position in RITM-B to fund the purchase. RITM-B was a great choice and did very well for us:
The REIT Forum
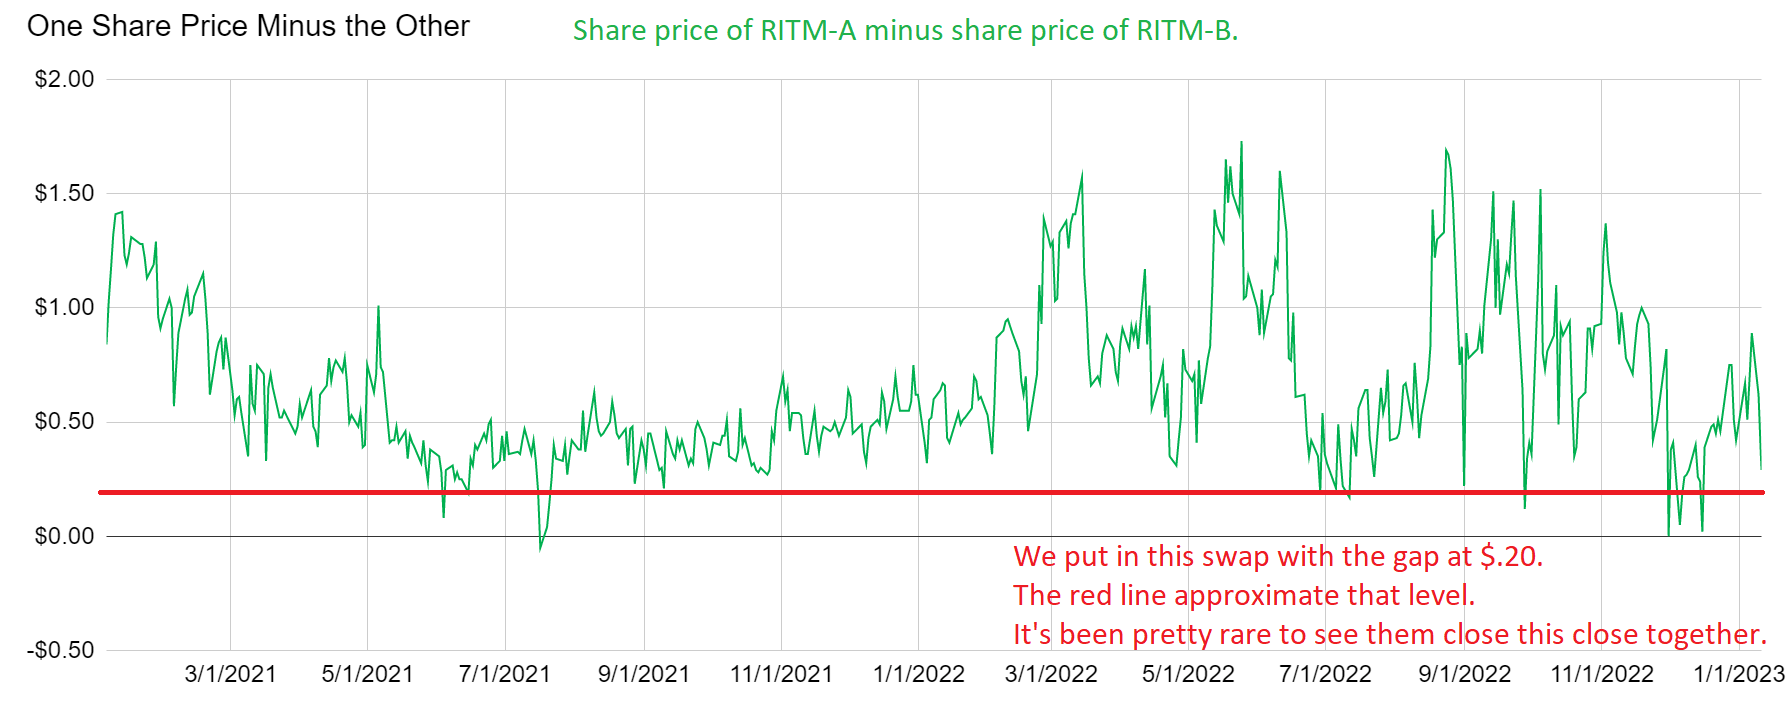
This was a disparity in the valuations that only showed up over the last few days. When we entered, RITM-B looked a little better. However, as shares put together quite a rally and modestly outperformed peers, I decided swapping to RITM-A would give us a slightly stronger position. This isn't a big change, but it's an opportunity to pick up some extra cash.
The REIT Forum
It made sense for us to pull the trigger when the gap was only $.20. I think RITM-A is another solid choice today. Of course, the other preferred shares from RITM look good also. We moved over because the relative valuation was unusually attractive.
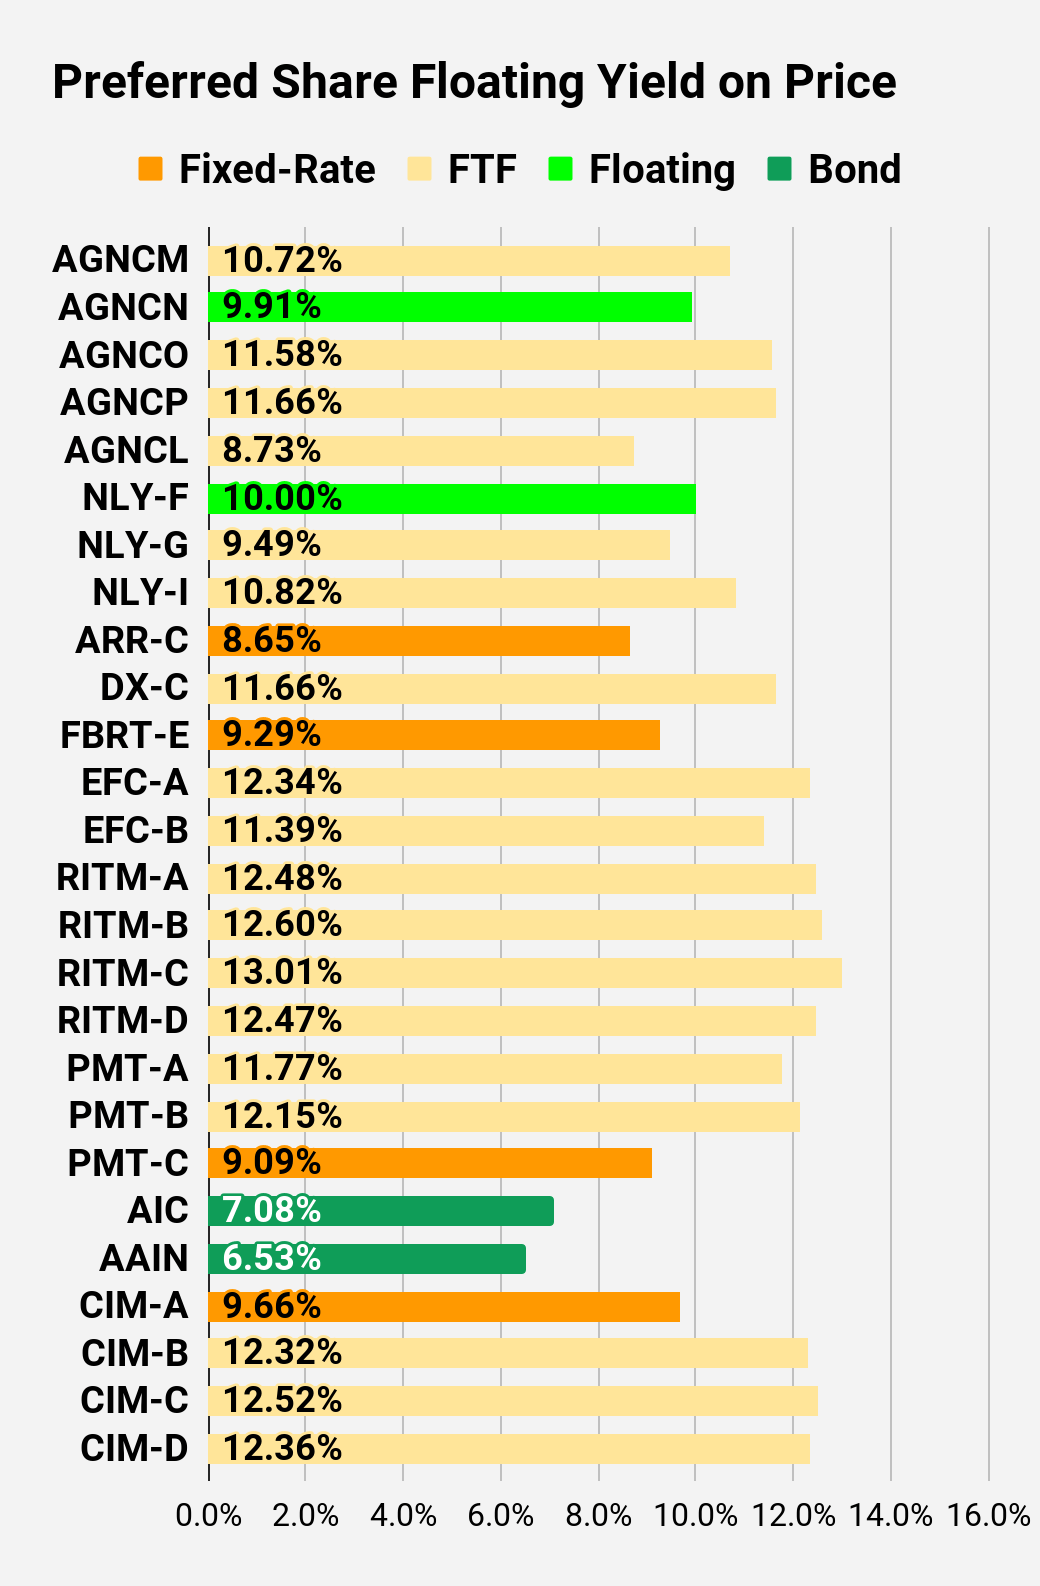
Shares have an 8.82% dividend yield today, plenty of upside to call value since they trade at $21.26, and if shares were floating today (floating begins 8/15/2024), the floating yield on today’s price would be 12.48% (much higher than the 8.82% we are collecting today).
Stock Table
We will close out the rest of the article with the tables and charts we provide for readers to help them track the sector for both common shares and preferred shares.
We’re including a quick table for the common shares that will be shown in our tables:
| Type of REIT or BDC |
| Residential Agency |
| Residential Hybrid |
| Residential Originator and Servicer |
| Commercial |
| BDC |
Let the images begin!
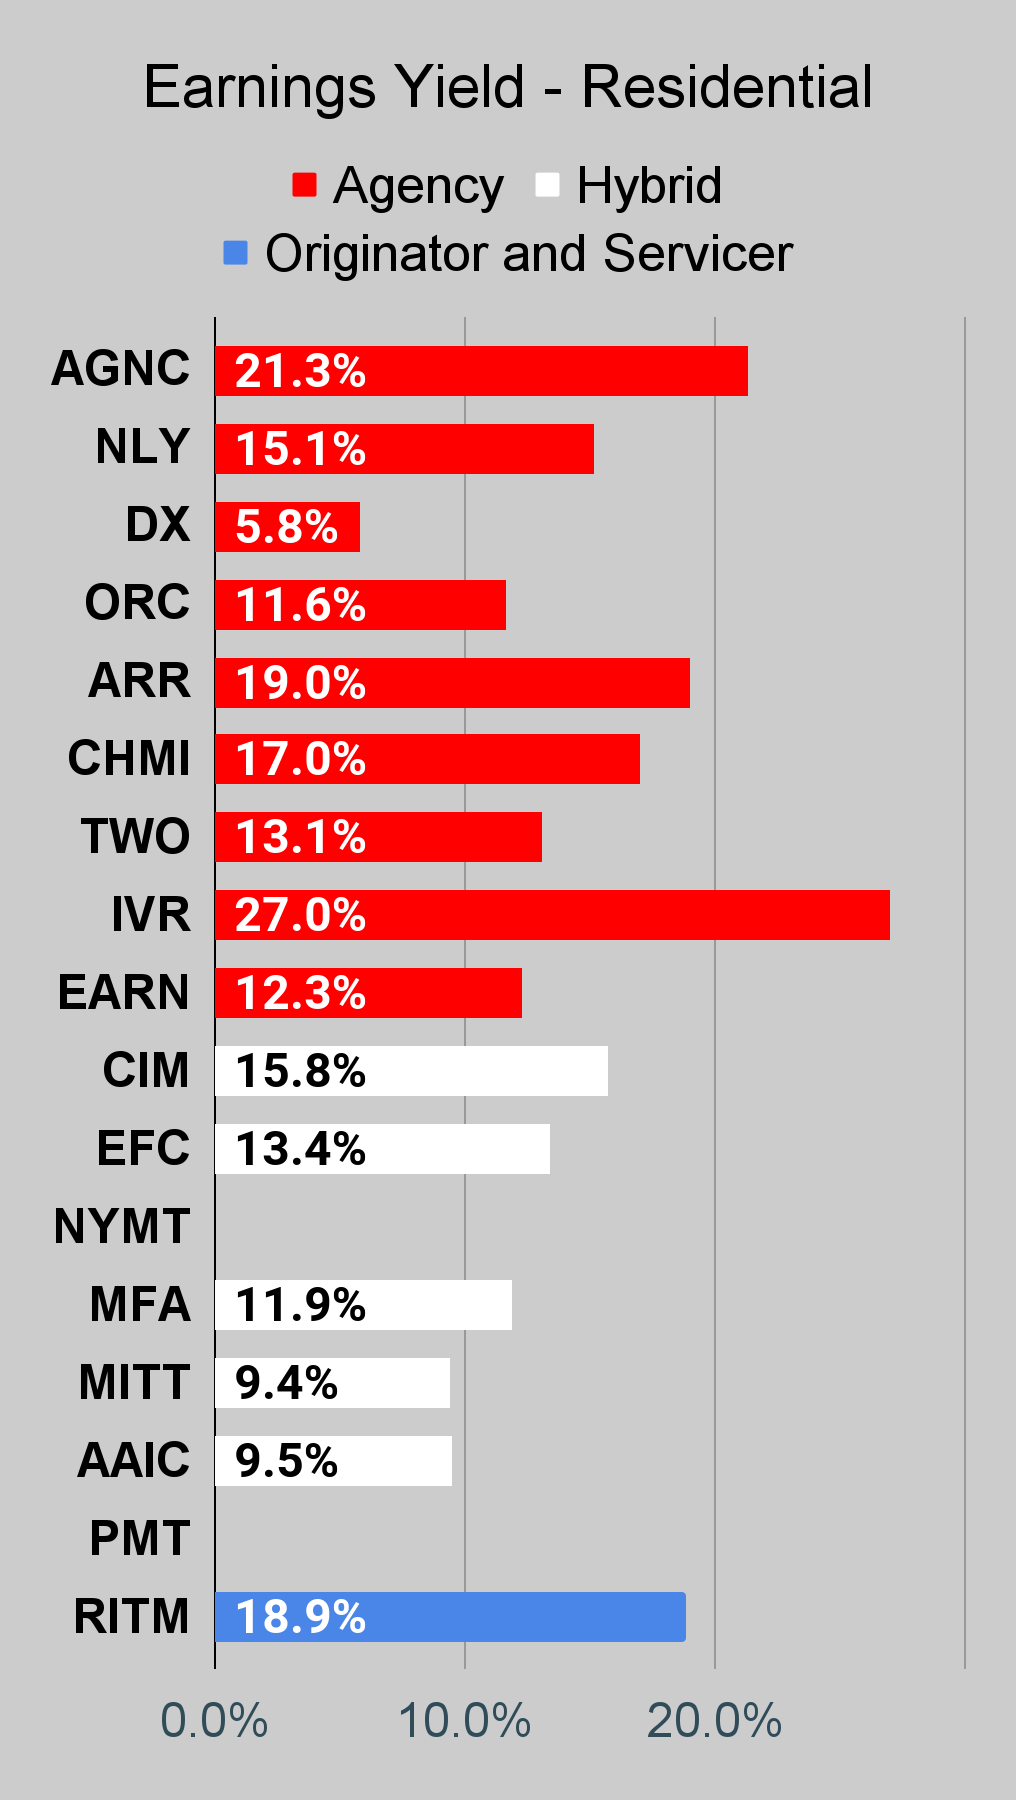
Residential Mortgage REIT Charts
Note: The chart for our public articles uses the book value per share from the latest earnings release. Current estimated book value per share is used in reaching our targets and trading decisions. It's available in our service, but those estimates are not included in the charts below. PMT and NYMT are not showing an earnings yield metric as neither REIT provides a quarterly “Core EPS” metric.
Second Note: Due to the way historical amortized cost and hedging is factored into the earnings metrics, it's possible for two mortgage REITs with similar portfolios to post materially different metrics for earnings. I would be very cautious about putting much emphasis on the consensus analyst estimate (which is used to determine the earnings yield). In particular, throughout late 2022 the earnings metric became less comparable for many REITs.
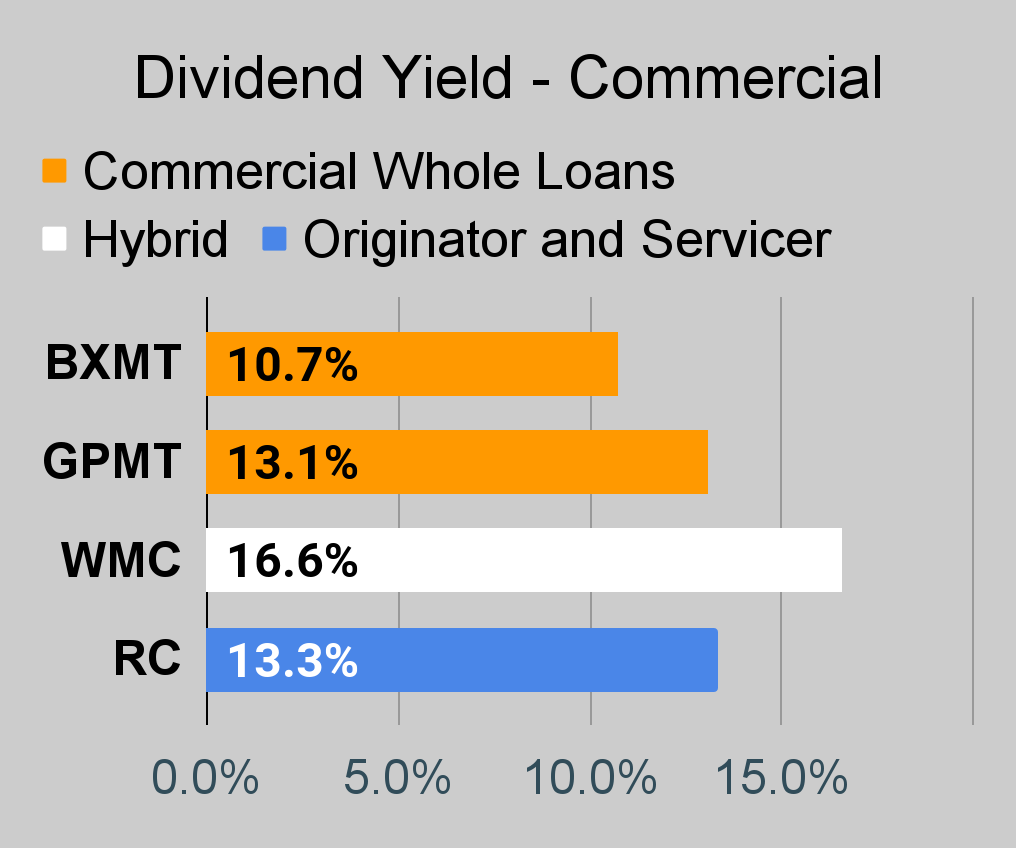
Commercial Mortgage REIT Charts
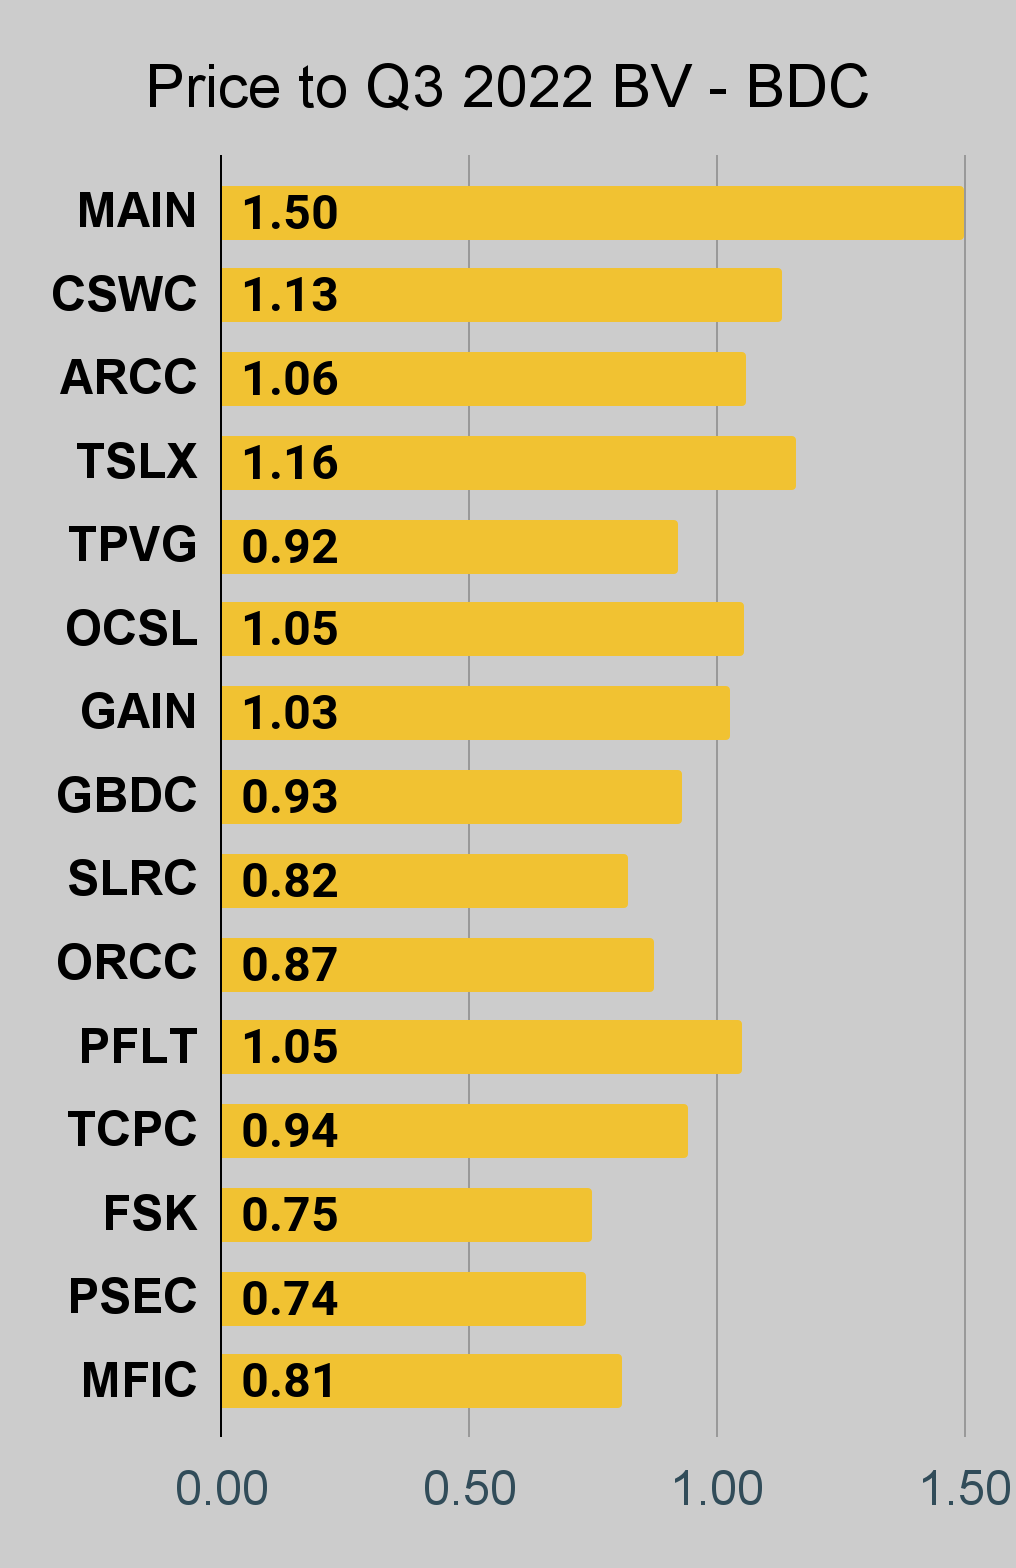
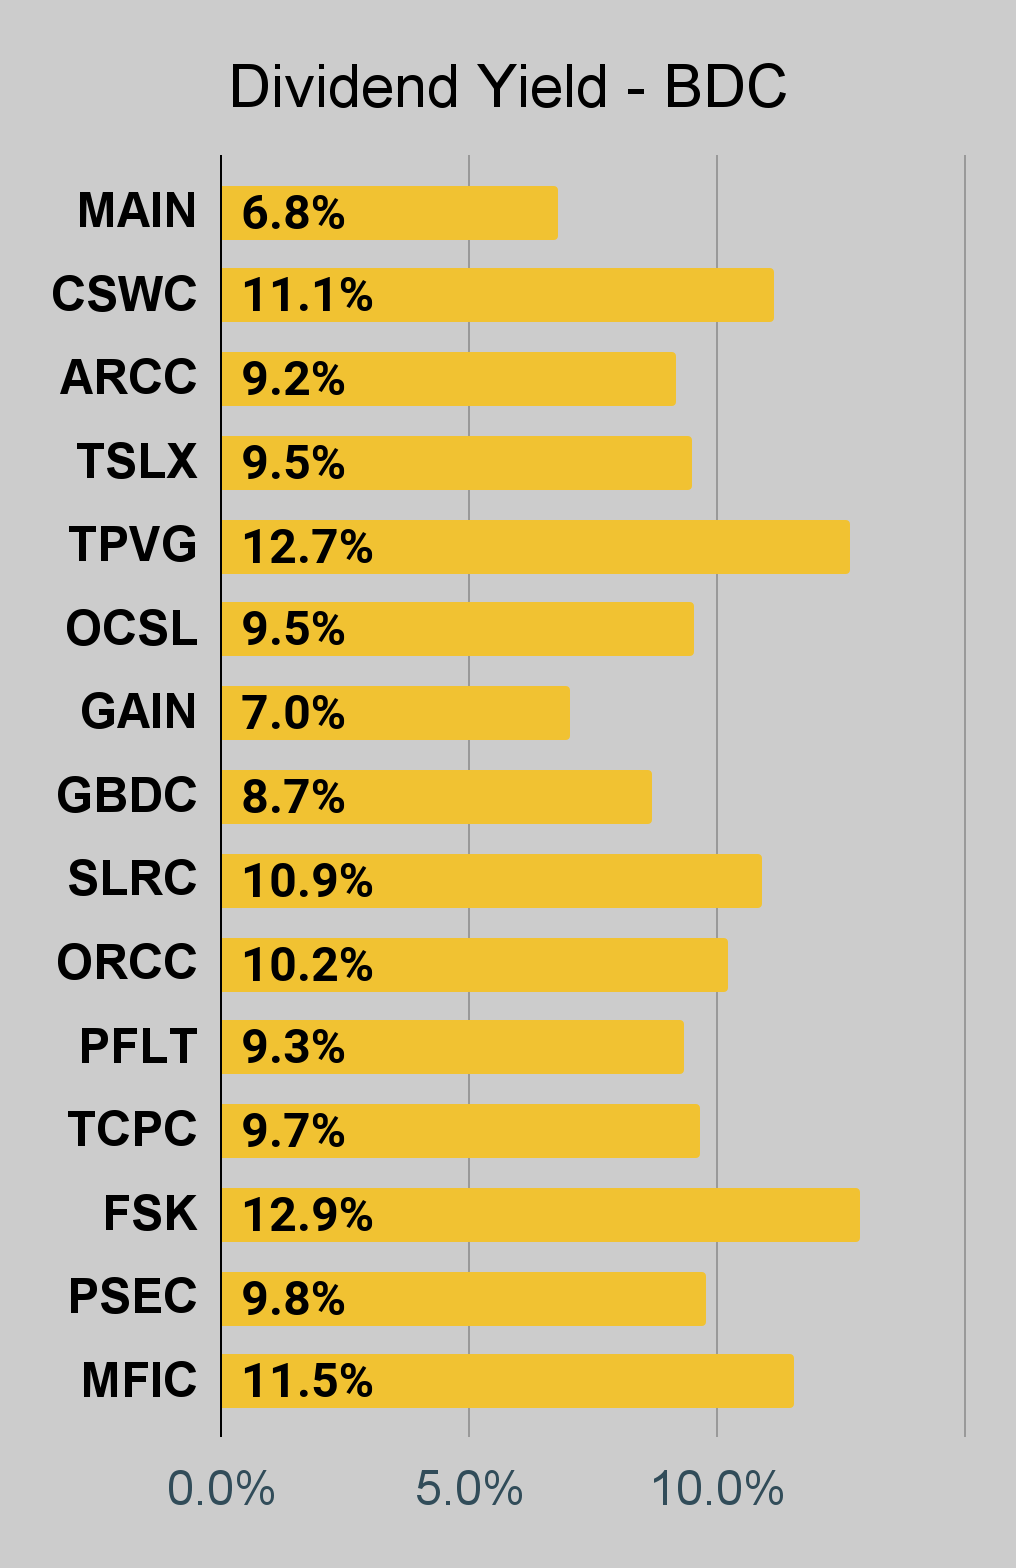
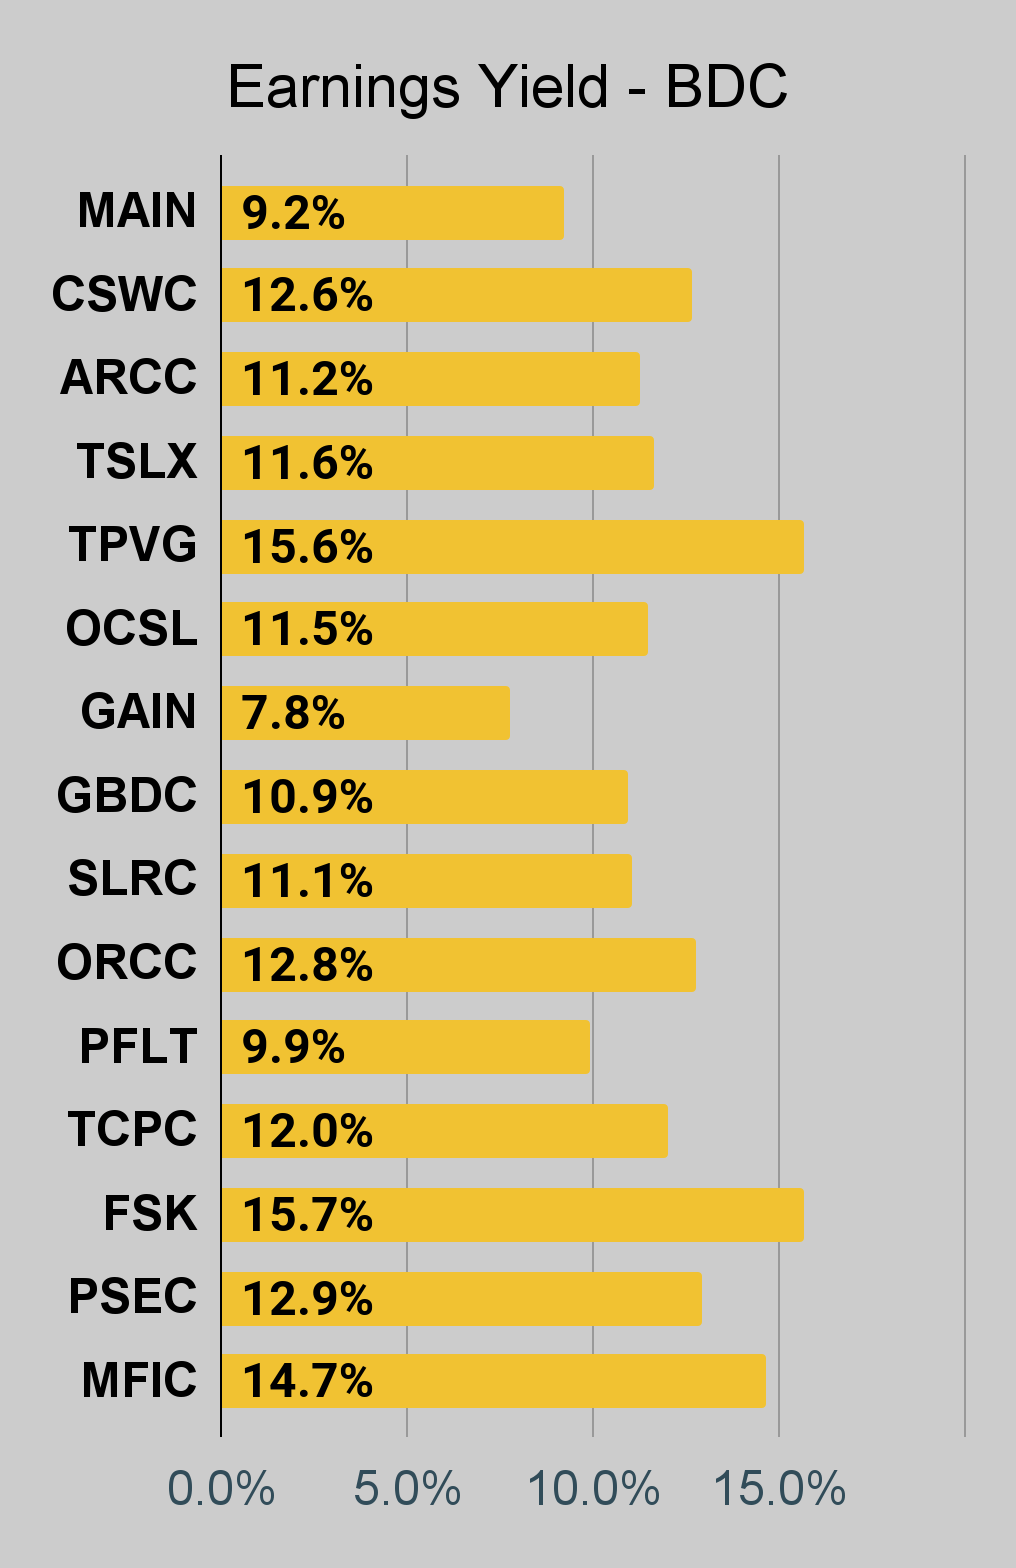
BDC Charts
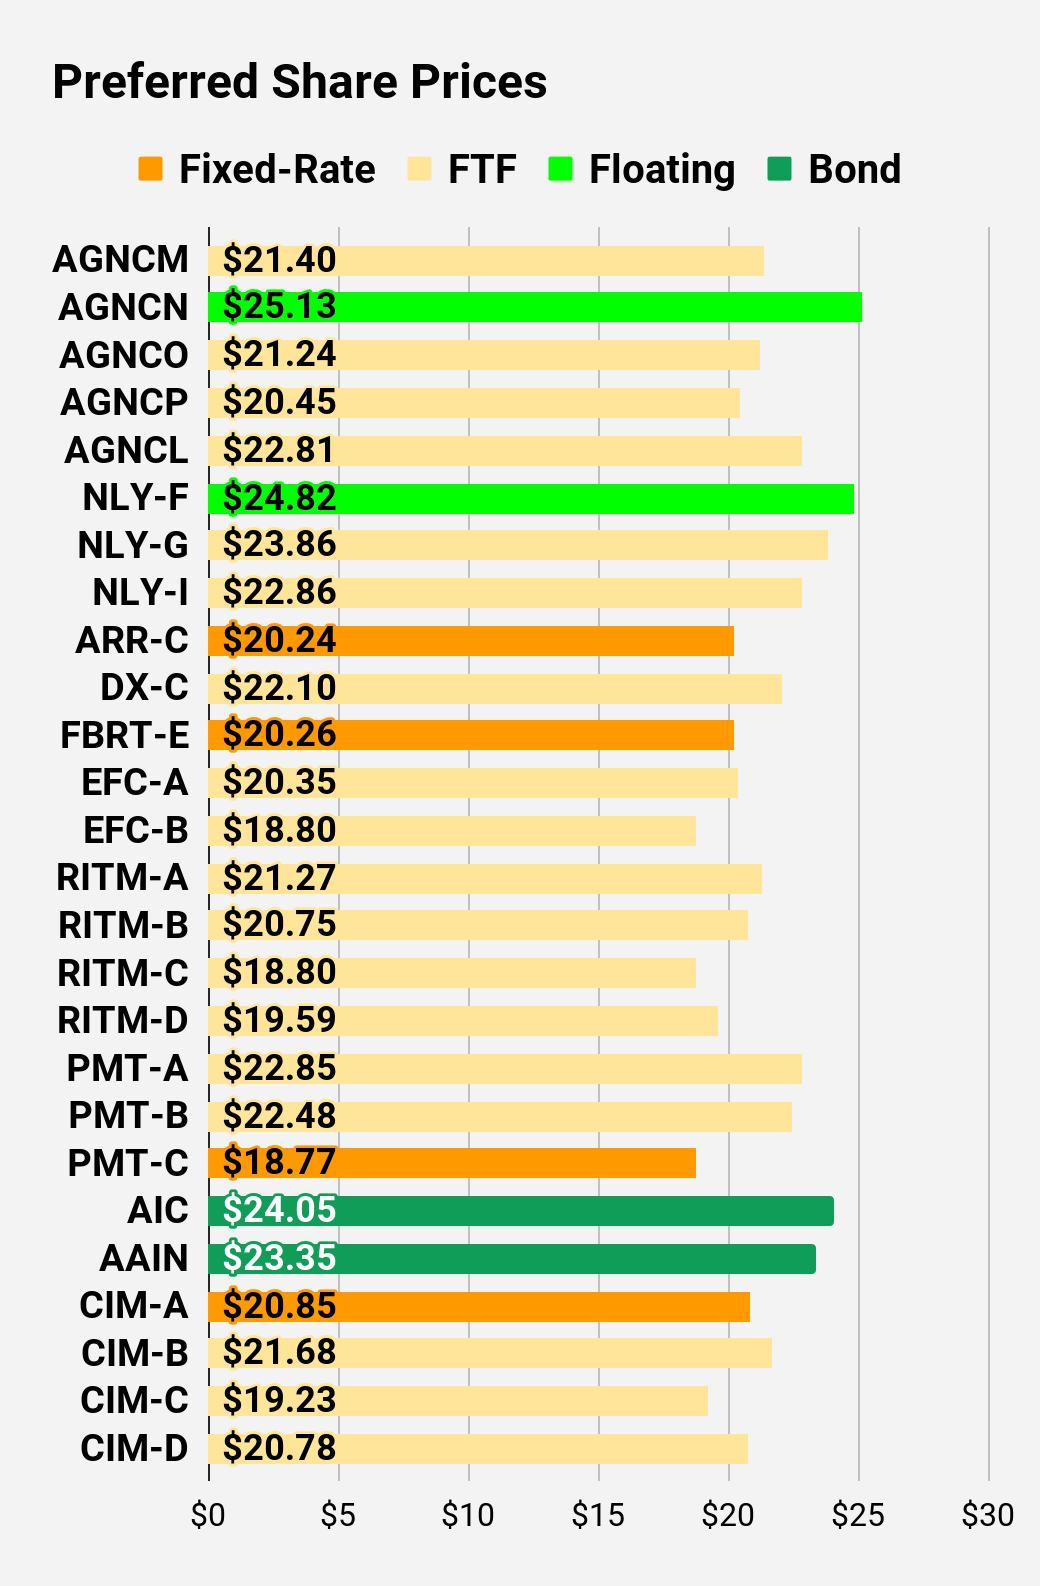
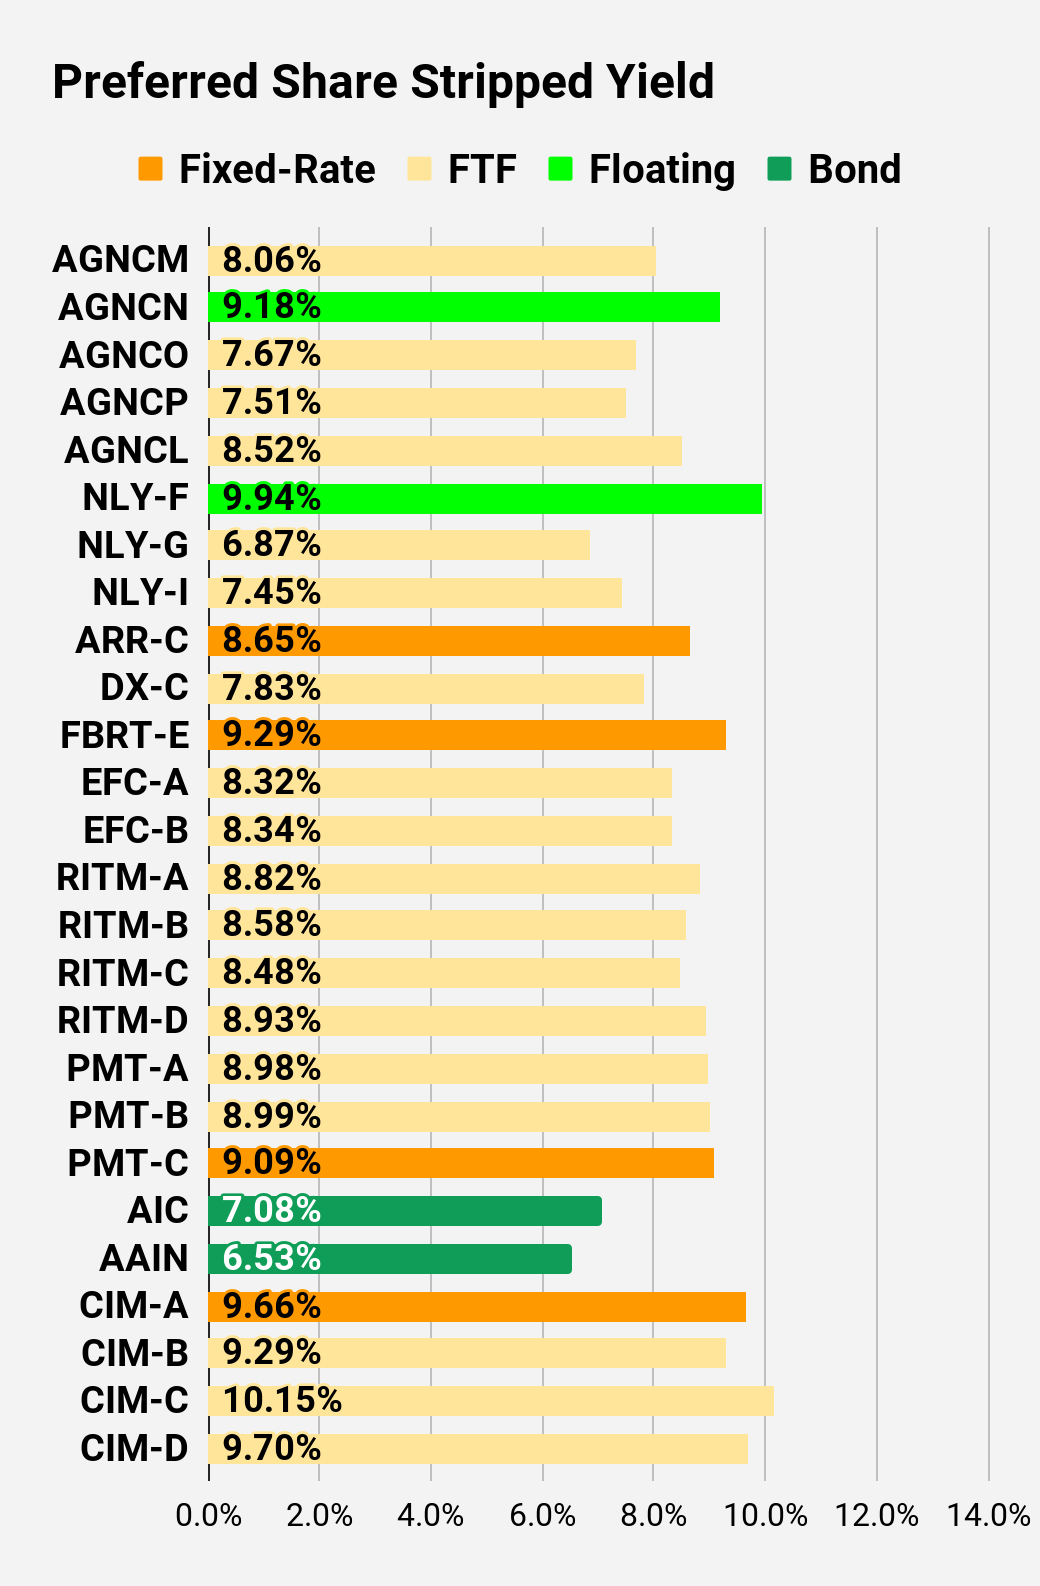
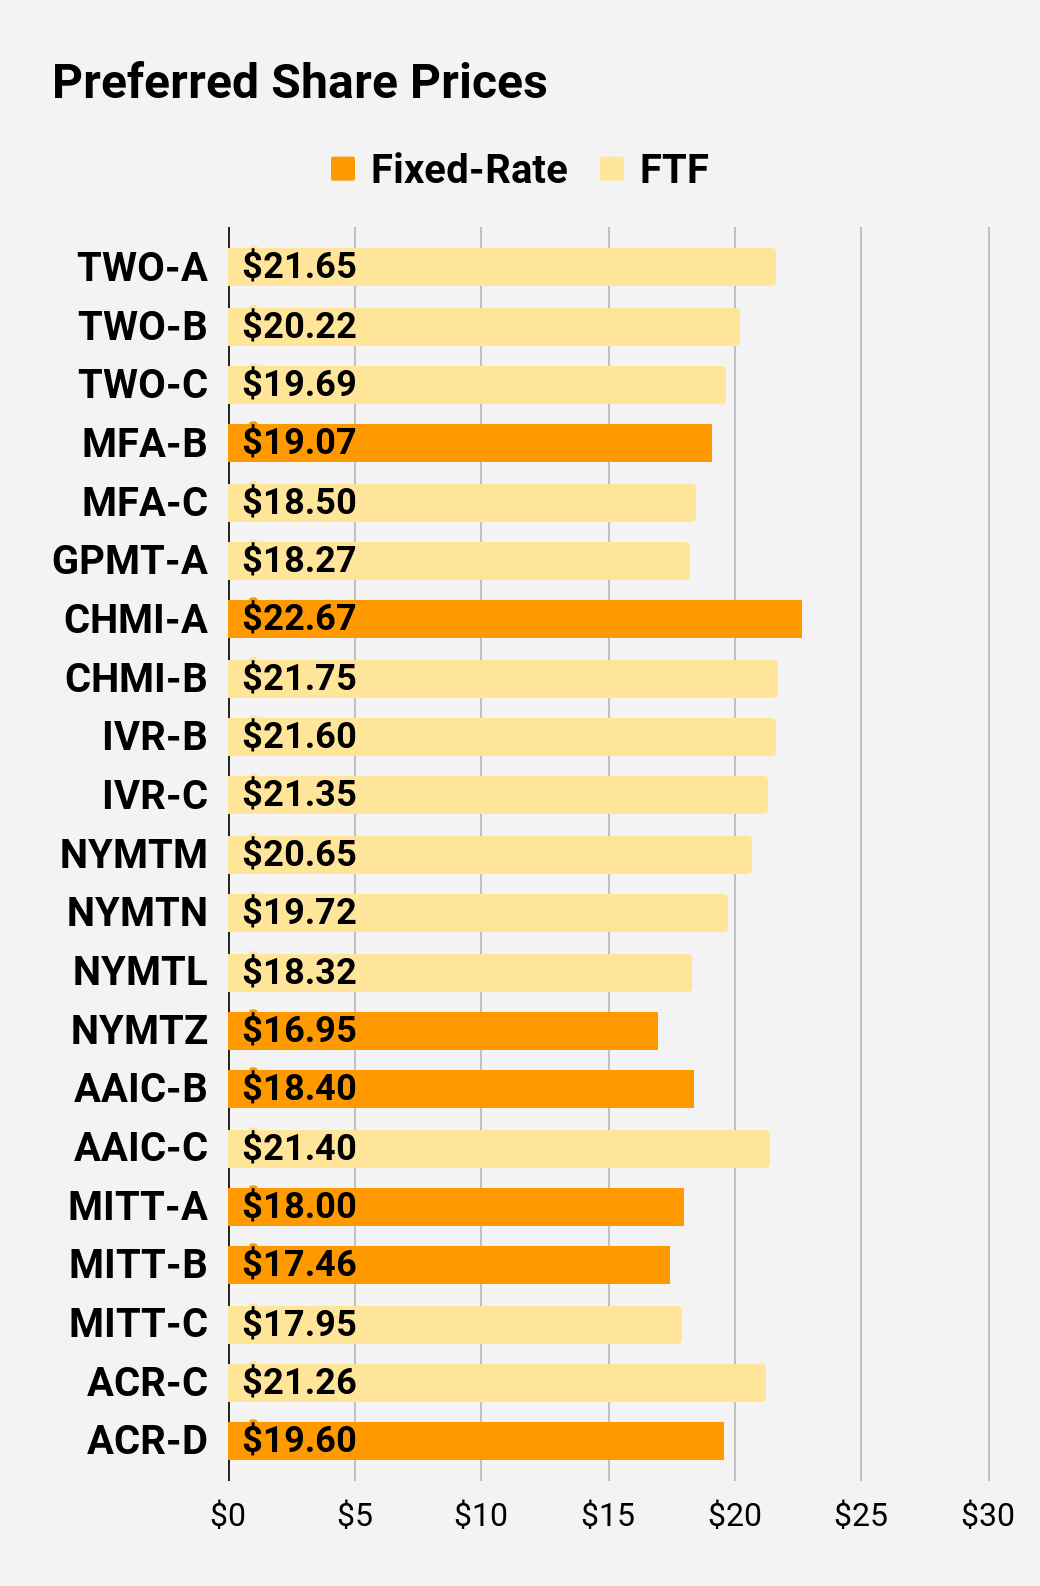
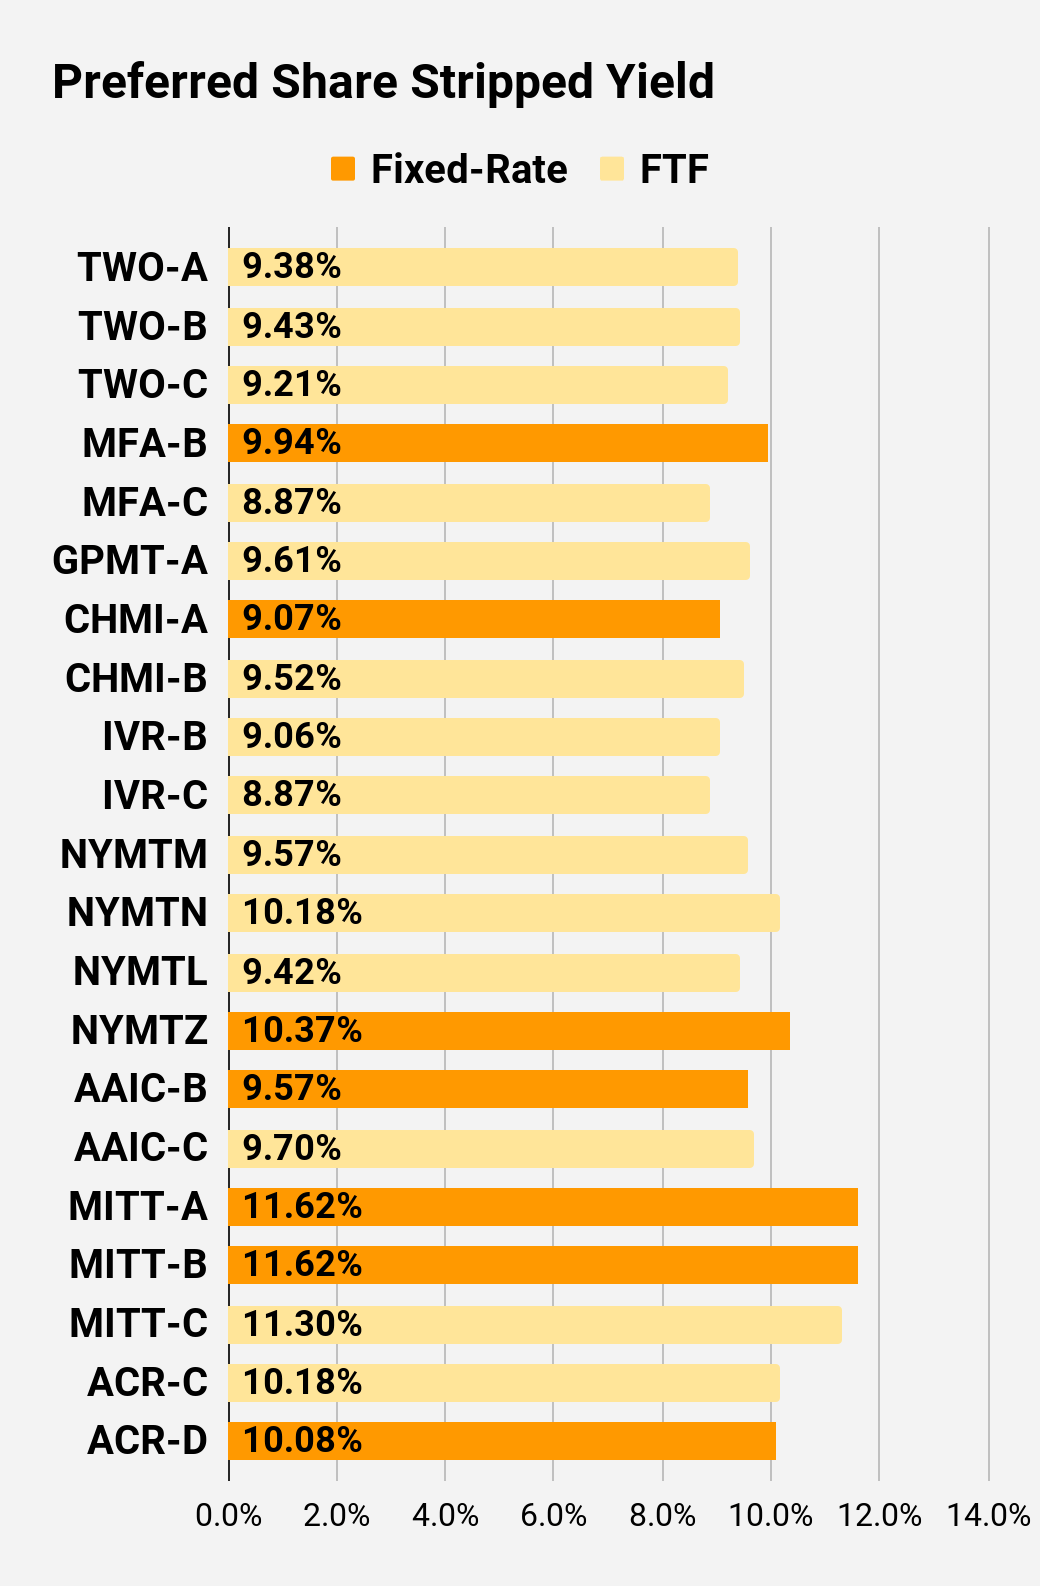
Preferred Share Charts
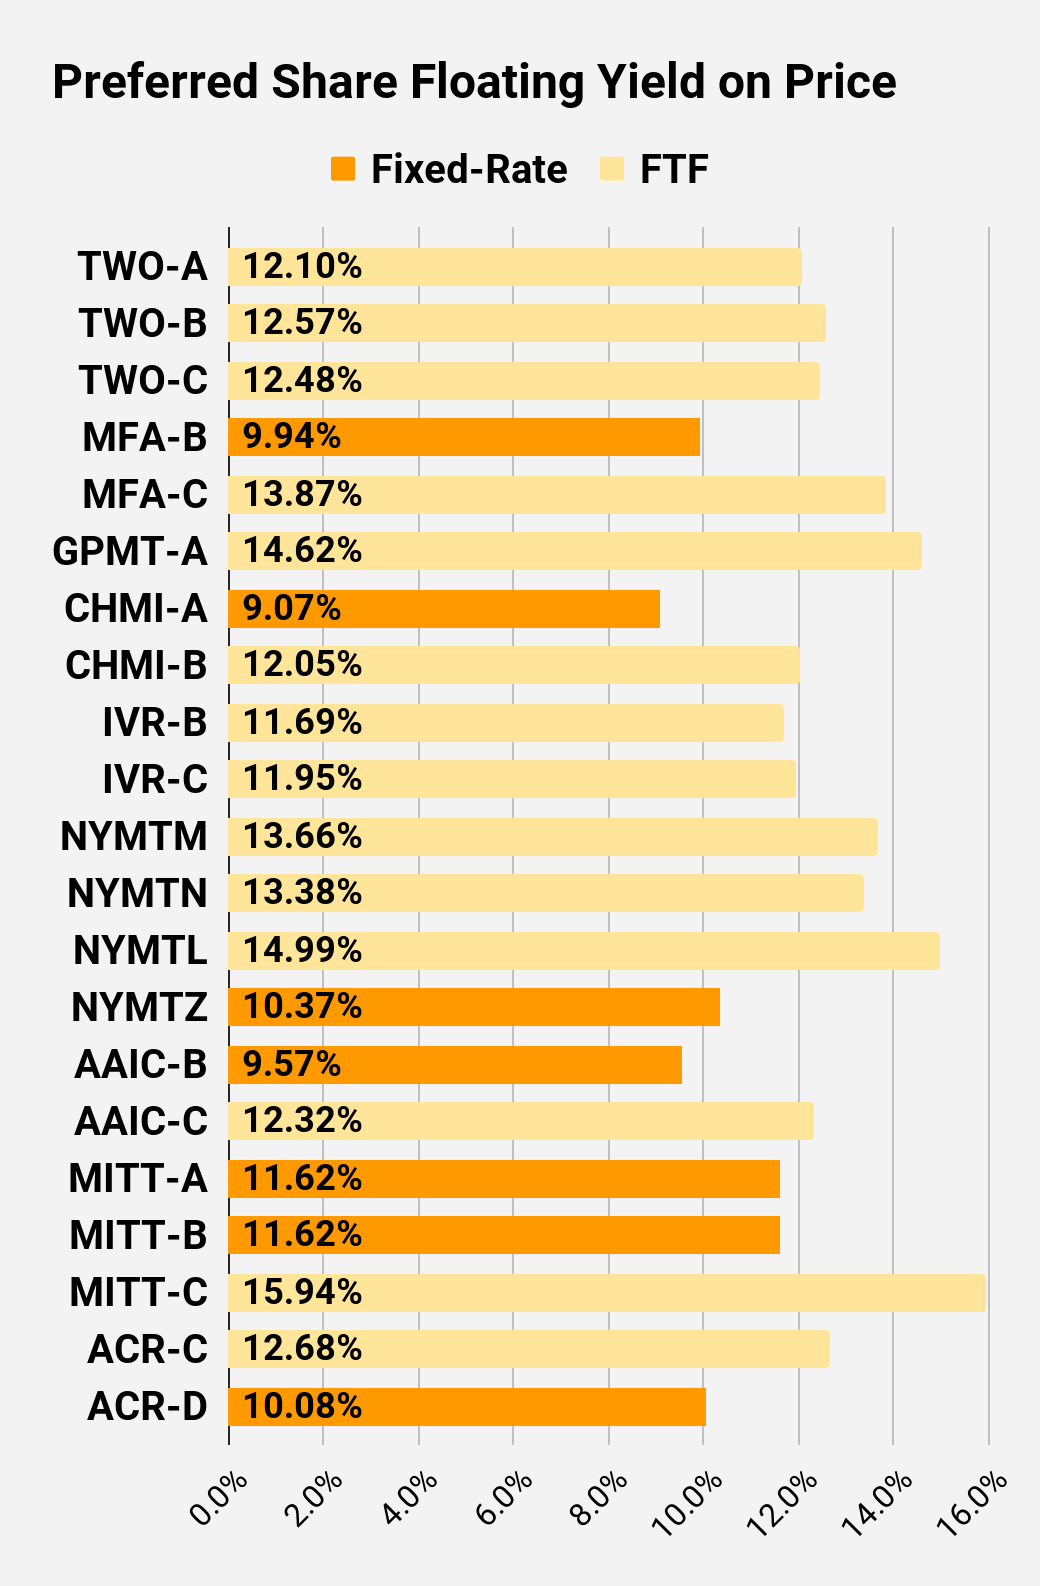
I changed the coloring a bit. We needed to adjust to include that the first fixed-to-floating shares have transitioned over to floating rates. When a share is already floating, the stripped yield may be different from the “Floating Yield on Price” due to changes in interest rates. For instance, NLY-F already has a floating rate. However, the rate is only reset once per three months. The stripped yield is calculated using the upcoming projected dividend payment and the “Floating Yield on Price” is based on where the dividend would be if the rate reset today. In my opinion, for these shares the “Floating Yield on Price” is clearly the more important metric.
Preferred Share Data
Beyond the charts, we’re also providing our readers with access to several other metrics for the preferred shares.
After testing out a series on preferred shares, we decided to try merging it into the series on common shares. After all, we are still talking about positions in mortgage REITs. We don’t have any desire to cover preferred shares without cumulative dividends, so any preferred shares you see in our column will have cumulative dividends. You can verify that by using Quantum Online. We’ve included the links in the table below.
To better organize the table, we needed to abbreviate column names as follows:
- Price = Recent Share Price - Shown in Charts
- BoF = Bond or FTF (Fixed-to-Floating)
- S-Yield = Stripped Yield - Shown in Charts
- Coupon = Initial Fixed-Rate Coupon
- FYoP = Floating Yield on Price - Shown in Charts
- NCD = Next Call Date (the soonest shares could be called)
- Note: For all FTF issues, the floating rate would start on NCD.
- WCC = Worst Cash to Call (lowest net cash return possible from a call)
- QO Link = Link to Quantum Online Page
| Ticker |
| Price |
| BoF |
| S-Yield |
| Coupon |
| FYoP |
| NCD |
| WCC |
| QO Link |
| P-Link |
| $21.40 |
| FTF |
| 8.06% |
| 6.88% |
| 10.72% |
| 4/15/2024 |
| $5.76 |
| $25.13 |
| Floating |
| 9.18% |
| 9.19% |
| 9.91% |
| 2/11/2023 |
| $0.05 |
| $21.24 |
| FTF |
| 7.67% |
| 6.50% |
| 11.58% |
| 10/15/2024 |
| $6.61 |
| $20.45 |
| FTF |
| 7.51% |
| 6.13% |
| 11.66% |
| 4/15/2025 |
| $8.00 |
| $22.81 |
| FTF |
| 8.52% |
| 7.75% |
| 8.73% |
| 10/15/2027 |
| $11.40 |
| $24.82 |
| Floating |
| 9.94% |
| 9.75% |
| 10.00% |
| 2/11/2023 |
| $0.47 |
| $23.86 |
| FTF |
| 6.87% |
| 6.50% |
| 9.49% |
| 3/31/2023 |
| $1.55 |
| $22.86 |
| FTF |
| 7.45% |
| 6.75% |
| 10.82% |
| 6/30/2024 |
| $4.67 |
| $20.24 |
| 8.65% |
| 7.00% |
| 8.65% |
| 1/28/2025 |
| $8.27 |
| $22.10 |
| FTF |
| 7.83% |
| 6.90% |
| 11.66% |
| 4/15/2025 |
| $6.78 |
| $20.26 |
| 9.29% |
| 7.50% |
| 9.29% |
| 2/11/2023 |
| $4.88 |
| $20.35 |
| FTF |
| 8.32% |
| 6.75% |
| 12.34% |
| 10/30/2024 |
| $7.68 |
| $18.80 |
| FTF |
| 8.34% |
| 6.25% |
| 11.39% |
| 1/30/2027 |
| $12.53 |
| $21.27 |
| FTF |
| 8.82% |
| 7.50% |
| 12.48% |
| 8/15/2024 |
| $6.56 |
| $20.75 |
| FTF |
| 8.58% |
| 7.13% |
| 12.60% |
| 8/15/2024 |
| $6.94 |
| $18.80 |
| FTF |
| 8.48% |
| 6.38% |
| 13.01% |
| 2/15/2025 |
| $9.41 |
| $19.59 |
| FTF |
| 8.93% |
| 7.00% |
| 12.47% |
| 11/15/2026 |
| $11.99 |
| $22.85 |
| FTF |
| 8.98% |
| 8.13% |
| 11.77% |
| 3/15/2024 |
| $4.69 |
| $22.48 |
| FTF |
| 8.99% |
| 8.00% |
| 12.15% |
| 6/15/2024 |
| $5.52 |
| $18.77 |
| 9.09% |
| 6.75% |
| 9.09% |
| 8/24/2026 |
| $12.46 |
| $24.05 |
| Bond |
| 7.08% |
| 6.75% |
| 7.08% |
| 2/11/2023 |
| $1.21 |
| $23.35 |
| Bond |
| 6.53% |
| 6.00% |
| 6.53% |
| 8/1/2023 |
| $2.77 |
| $20.85 |
| 9.66% |
| 8.00% |
| 9.66% |
| 2/11/2023 |
| $4.39 |
| $21.68 |
| FTF |
| 9.29% |
| 8.00% |
| 12.32% |
| 3/30/2024 |
| $5.82 |
| $19.23 |
| FTF |
| 10.15% |
| 7.75% |
| 12.52% |
| 9/30/2025 |
| $11.11 |
| $20.78 |
| FTF |
| 9.70% |
| 8.00% |
| 12.36% |
| 03/30/2024 |
| $6.72 |
Second Batch:
| Ticker |
| Price |
| BoF |
| S-Yield |
| Coupon |
| FYoP |
| NCD |
| WCC |
| QO Link |
| P-Link |
| $21.65 |
| FTF |
| 9.38% |
| 8.13% |
| 12.10% |
| 04/27/2027 |
| $11.97 |
| $20.22 |
| FTF |
| 9.43% |
| 7.63% |
| 12.57% |
| 07/27/2027 |
| $13.35 |
| $19.69 |
| FTF |
| 9.21% |
| 7.25% |
| 12.48% |
| 1/27/2025 |
| $8.93 |
| $19.07 |
| 9.94% |
| 7.50% |
| 9.94% |
| 2/11/2023 |
| $6.15 |
| $18.50 |
| FTF |
| 8.87% |
| 6.50% |
| 13.87% |
| 3/31/2025 |
| $10.16 |
| $18.27 |
| FTF |
| 9.61% |
| 7.00% |
| 14.62% |
| 11/30/2026 |
| $13.50 |
| $22.67 |
| 9.07% |
| 8.20% |
| 9.07% |
| 2/11/2023 |
| $2.41 |
| $21.75 |
| FTF |
| 9.52% |
| 8.25% |
| 12.05% |
| 4/15/2024 |
| $5.75 |
| $21.60 |
| FTF |
| 9.06% |
| 7.75% |
| 11.69% |
| 12/27/2024 |
| $7.30 |
| $21.35 |
| FTF |
| 8.87% |
| 7.50% |
| 11.95% |
| 9/27/2027 |
| $12.58 |
| $20.65 |
| FTF |
| 9.57% |
| 7.88% |
| 13.66% |
| 1/15/2025 |
| $8.29 |
| $19.72 |
| FTF |
| 10.18% |
| 8.00% |
| 13.38% |
| 10/15/2027 |
| $14.78 |
| $18.32 |
| FTF |
| 9.42% |
| 6.88% |
| 14.99% |
| 10/15/2026 |
| $13.13 |
| $16.95 |
| 10.37% |
| 7.00% |
| 10.37% |
| 1/15/2027 |
| $15.05 |
| $18.40 |
| 9.57% |
| 7.00% |
| 9.57% |
| 2/11/2023 |
| $6.71 |
| $21.40 |
| FTF |
| 9.70% |
| 8.25% |
| 12.32% |
| 3/30/2024 |
| $6.07 |
| $18.00 |
| 11.62% |
| 8.25% |
| 11.62% |
| 2/11/2023 |
| $7.28 |
| $17.46 |
| 11.62% |
| 8.00% |
| 11.62% |
| 2/11/2023 |
| $7.81 |
| $17.95 |
| FTF |
| 11.30% |
| 8.00% |
| 15.94% |
| 9/17/2024 |
| $10.52 |
| $21.26 |
| FTF |
| 10.18% |
| 8.63% |
| 12.68% |
| 7/30/2024 |
| $6.98 |
| $19.60 |
| 10.08% |
| 7.88% |
| 10.08% |
| 5/21/2026 |
| $11.92 |
Strategy
Our goal is to maximize total returns . We achieve those most effectively by including “trading” strategies. We regularly trade positions in the mortgage REIT common shares and BDCs because:
- Prices are inefficient.
- Long term, share prices generally revolve around book value.
- Short term, price-to-book ratios can deviate materially.
- Book value isn’t the only step in analysis, but it's the cornerstone.
We also allocate to preferred shares and equity REITs. We encourage buy-and-hold investors to consider using more preferred shares and equity REITs.
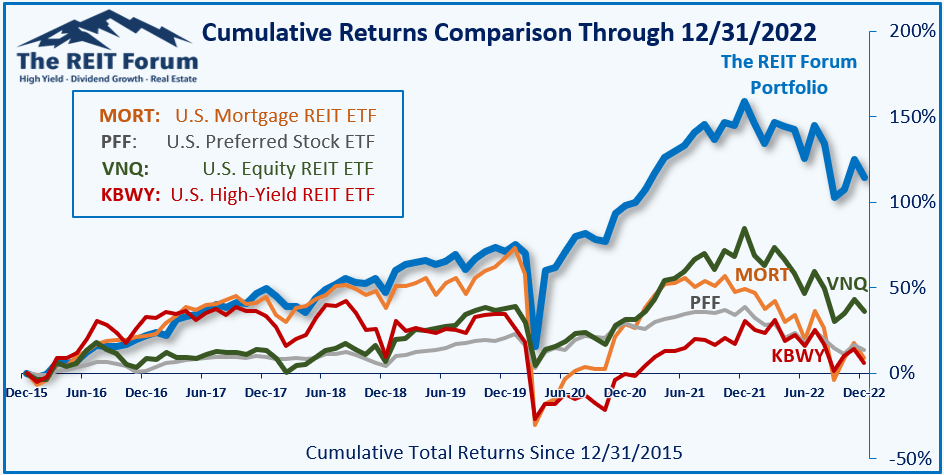
Performance
We compare our performance against four ETFs that investors might use for exposure to our sectors:
The REIT Forum
The four ETFs we use for comparison are:
| Ticker |
| Exposure |
| One of the largest mortgage REIT ETFs |
| One of the largest preferred share ETFs |
| Largest equity REIT ETF |
| The high-yield equity REIT ETF. Yes, it has been dreadful. |
When investors think it isn’t possible to earn solid returns in preferred shares or mortgage REITs, we politely disagree. The sector has plenty of opportunities, but investors still need to be wary of the risks. We can’t simply reach for yield and hope for the best. When it comes to common shares, we need to be even more vigilant to protect our principal by regularly watching prices and updating estimates for book value and price targets.
Ratings: Bullish on RITM, RC, and preferred share RITM-A
For further details see:
3 Big Dividend Yields Up To 13%