VTHR - 3 Core U.S. Equity ETFs For 2023
Summary
- I scanned my U.S. Equity ETF Database for large-cap funds with average volatility, low fees, and high quality. I found 33 ETFs you can consider to be core holdings.
- This article summarizes selected fundamental metrics for all ETFs, highlighting the best ones to own based on diversification, volatility, growth, valuation, and profitability.
- I've also highlighted industry-level fundamentals for 3 ETFs of particular interest, depending on your investment style: ILCV, BKLC, and VTI. In addition, an ESG-themed ETF is worth exploring.
- Past performance is unlikely to repeat. I recommend readers rely on the latest fundamentals to make investment decisions, and this article helps clarify each ETF's pros and cons.
Introduction
High-quality, low-fee ETFs form the backbone of most investors' portfolios. They move in line with the market, track Indexes that include the most successful companies, and generally work out well in the long run. However, finding the right one that meets your needs can be challenging. Making that job easier for you is the purpose of this article.
Some readers may know that I calculate dozens of fundamental metrics for 850+ U.S. Equity ETFs. I started doing this after reviewing feedback from readers questioning why they should sell their current ETF in favor of the one recommended. These questions were reasonable, and I quickly realized that my analysis was incomplete unless I considered these alternatives in advance. It took some effort, but I can now confidently state that I have done the research, and my articles are fact-based, comprehensive, and timely.
For this analysis, I looked for broad-based ETFs satisfying four screens:
- five-year betas between 0.95 and 1.05
- profitability scores above 9/10 (based on Seeking Alpha Factor Grades)
- expense ratios 0.10% or below
- assets under management above $200 million
- have a large or total market cap focus
It sounds straightforward. However, there were only 33 results. This article presents a variety of fundamental metrics for each in summary format, then highlights three in more detail that may match your investment style.
The Selections
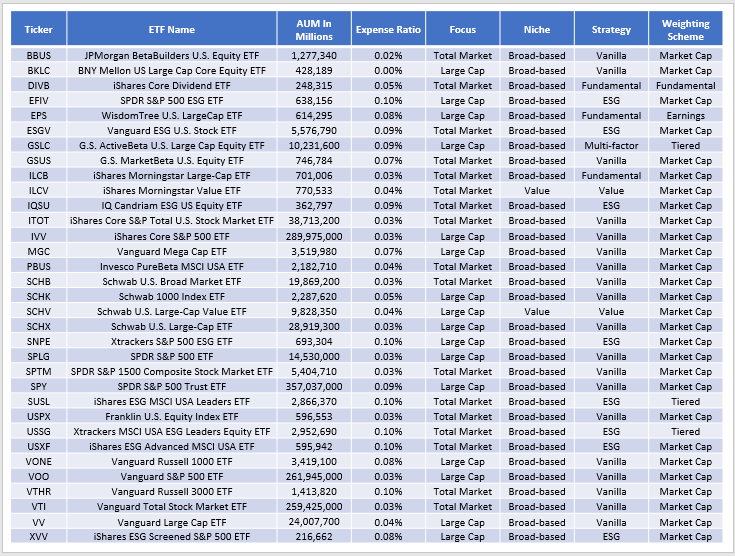
To begin, the following table highlights basic information for these 33 ETFs. I've included the ETF's focus, niche, strategy, and weighting scheme, along with the expense ratio and assets under management. Most are market-cap-weighted, but a few alternatively-weighted ETFs can help you diversify away from mega-cap companies.
The Sunday Investor
There are advantages to focusing on the largest ETFs by assets under management. They often have the smallest bid-ask spreads, thereby limiting trading costs. However, remember that with ETFs, market makers provide a secondary level of liquidity. The best measure of an ETF's liquidity is the liquidity of the underlying holdings, and since these are all large or total market ETFs, they all seem suitable to me.
ETF Fundamentals
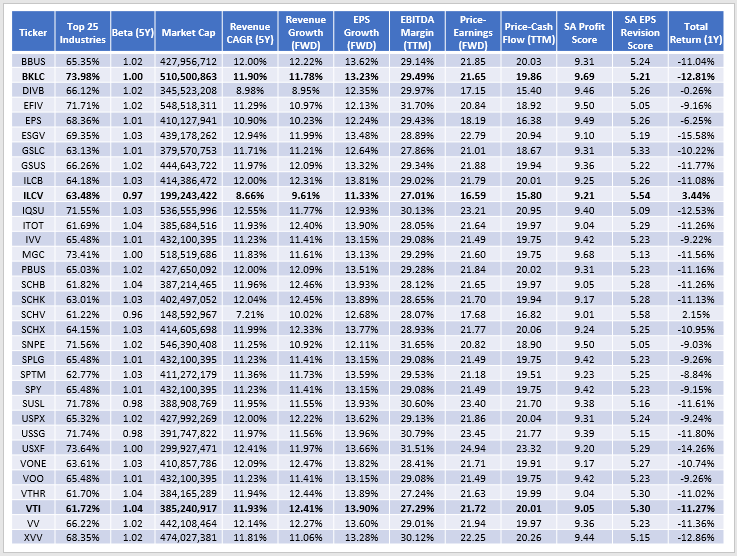
The following table highlights 12 fundamentals for each ETF. I've bolded three that stand out based on estimated earnings per share growth, forward price-earnings ratio, and overall profitability.
The Sunday Investor
I also included each ETF's total return over the last year, from December 2021 to November 2022. ETFs with low valuations have outperformed. One example is the iShares Morningstar Value ETF ( ILCV ), which trades at 16.59x forward earnings and is up 3.44% over that period. Let's look at that ETF first.
iShares Morningstar Value ETF
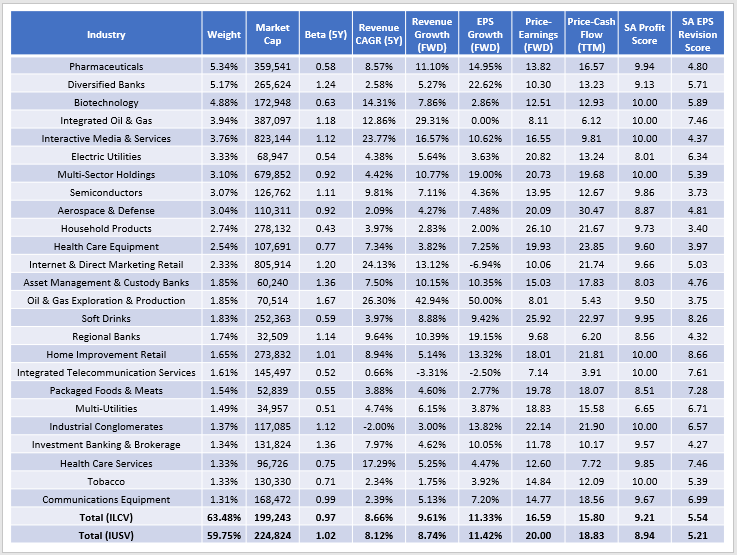
ILCV tracks the Morningstar US Large-Mid Cap Broad Value Index , selecting 500 U.S. large- and mid-cap stocks based on a ten-point factor model. ILCV doesn't get much coverage and has just 383 followers on Seeking Alpha. However, it's the second-oldest total-market-cap value ETF and has the same low 0.04% expense ratio as the more popular iShares Core S&P U.S. Value ETF ( IUSV ). IUSV missed the cut for this analysis because of its 0.94 five-year beta and has a relatively low 9.02/10 profitability score compared to 9.24/10 for ILCV. Here's a closer look at ILCV's fundamentals for its top 25 industries, and I've included the same for IUSV in the bottom row.
The Sunday Investor
Currently, I view ILCV as superior across the board. It's less volatile than IUSV, as indicated by its lower five-year beta (0.97 vs. 1.02). It has solid sales growth and nearly identical estimated earnings growth but trades at a 3-4 point discount on forward earnings and trailing cash flow. Finally, its selections are surprisingly more profitable with better earnings sentiment, as measured by Seeking Alpha's Profitability and EPS Revision Grades. I expect ILCV's relative underperformance to reverse soon.
Portfolio Visualizer
BNY Mellon US Large Cap Core Equity ETF
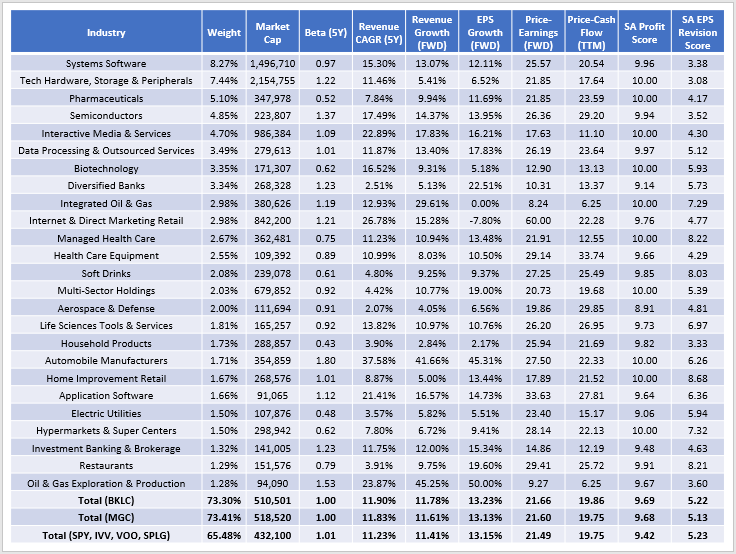
The BNY Mellon US Large Cap Core Equity ETF ( BKLC ) stands out because of its 9.69/10 profitability score. Tracking the Morningstar U.S. Large Cap Index , BKLC has 210 holdings, or about 40% the size of S&P 500 ETFs like SPY , IVV , VOO , and SPLG . Readers may consider the Vanguard Mega Cap ETF ( MGC ) a more suitable peer, as the two have a 96% weight overlap, according to the ETF Research Center's Fund Overlap Tool .
The Sunday Investor
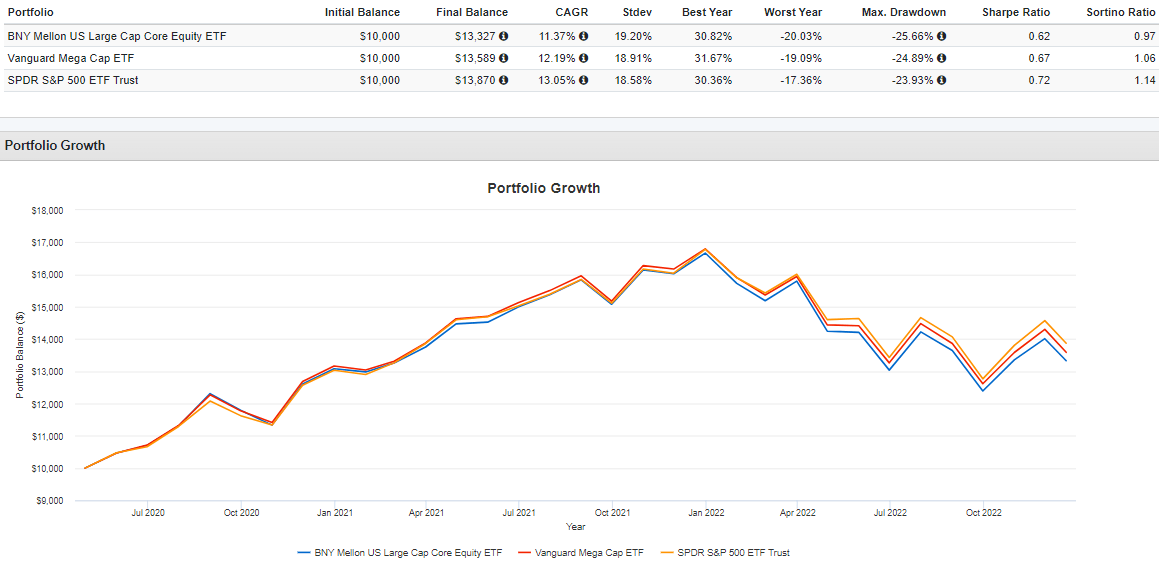
You can see the similarities between BKLC's and MGC's fundamentals, and that is because they both genuinely are mega-cap ETFs. Each has weighted-average market capitalizations above $500 billion compared to $432 billion for SPY. There's a solid argument here that BKLC is the superior of the three, at least currently. Remember, its expense ratio is zero and has virtually identical growth and valuation metrics compared to the four S&P 500 Index ETFs but better profitability.
Unfortunately, past performance may hold back AUM growth. Also, the fund's most recent turnover was 17% compared to 4% and 2% for MGC and SPY. Therefore, while the above metrics suggest similar performance going forward, there could be a little too much activity to the detriment of shareholders.
Portfolio Visualizer
Vanguard Total Stock Market ETF
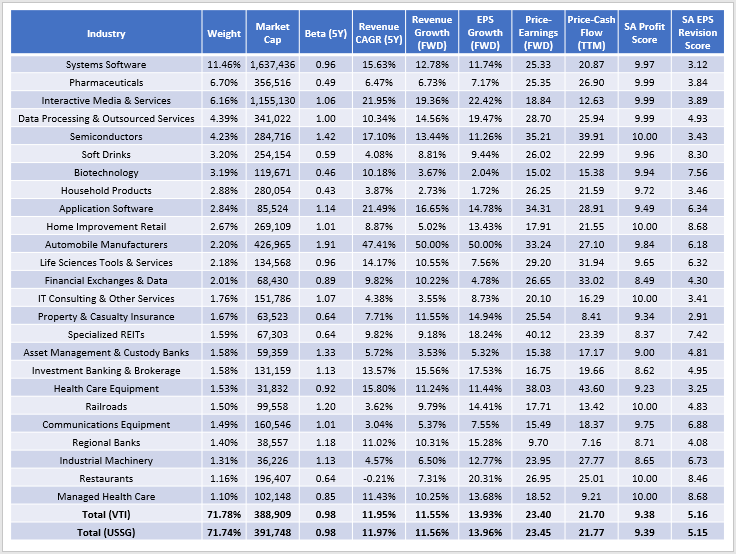
The Vanguard Total Stock Market ETF ( VTI ) has you covered if you're looking to access all size segments with above-average earnings growth. VTI's expense ratio is low at 0.03% and provides higher estimated growth metrics than S&P 500 Index ETFs. The downside is that adding small- and mid-cap stocks makes VTI more volatile and less profitable. I chose the Xtrackers MSCI USA ESG Leaders Equity ETF ( USSG ) for comparison purposes. You may view it as a slightly unusual choice, but USSG excels in earnings growth despite having less than half exposure to the high-growth Energy sector. Put this one on your list of ETFs to watch should inflation, led by lower oil prices, falls.
The Sunday Investor
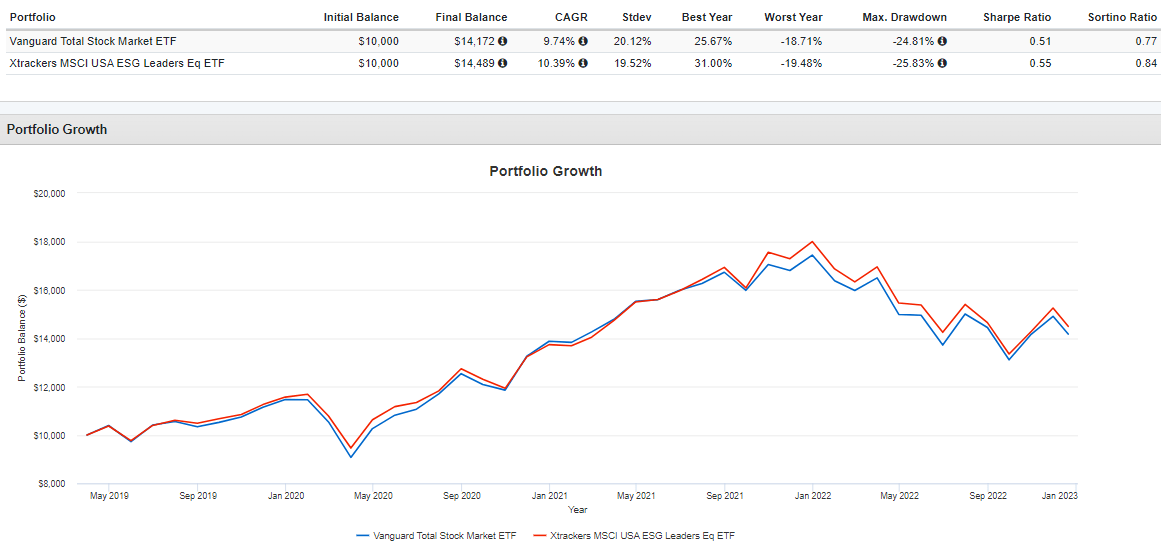
Interestingly, USSG has outperformed VTI with lower volatility since its inception in February 2019. It's one example where you shouldn't judge a book by its cover. The ESG theme is a negative for some investors, but USSG proves that performance isn't always sacrificed. Based on the metrics above, USSG is nearly identical to VTI in all areas, with outperformance likely linked only to slight sector exposure differences.
Portfolio Visualizer
Historical Performance
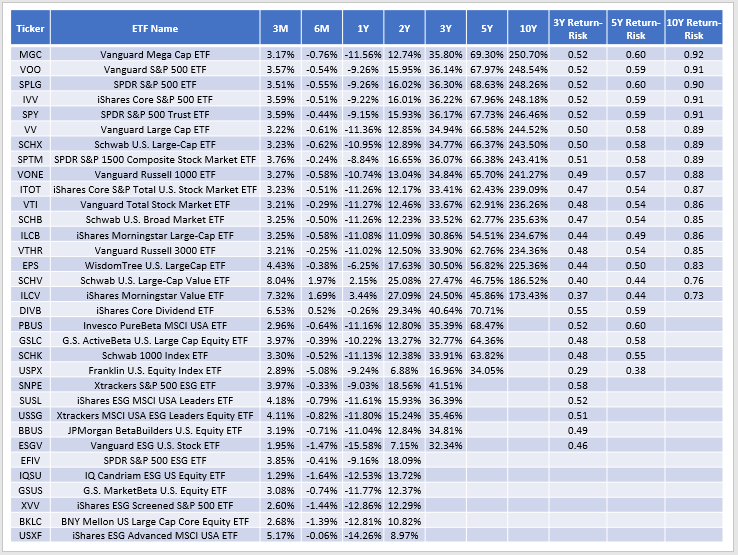
For some, it all comes down to past performance. While I disagree that it's an acceptable way to assess an ETF, past performance provides concrete evidence of how well a strategy performed over a particular period. Therefore, consider these historical returns through November 2022 for all ETFs listed in this article. I've organized them by best ten-year performance, then five-year, and so forth.
The Sunday Investor
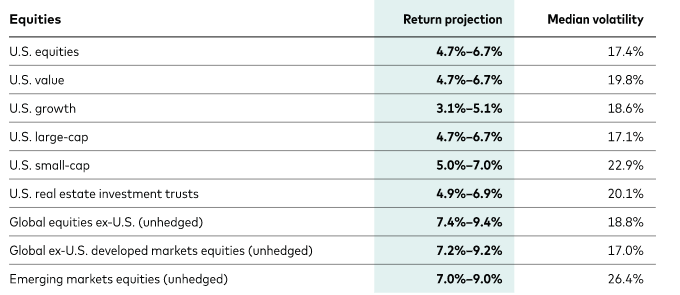
This table also includes return-to-risk ratios based on annualized returns divided by the annualized standard deviation. MGC, VOO, SPLG, IVV, and SPY have the best ten-year annualized returns and risk-adjusted returns, but it's crucial to recognize the shift that's occurred recently. For example, ILCV lagged MGC by 77.27% over ten years but has outperformed by 15% in the last year. As a reminder, the fundamentals described earlier indicate ILCV offers a lower risk-return profile that I think works in its favor. Furthermore, Vanguard's ten-year projections are for value to outperform growth, so I caution readers against relying too much on historical performance.
Vanguard
Conclusion
This article aimed to highlight all ETF options for investors wanting simple exposure to the U.S. large-cap market. As core holdings, the ETFs presented had average volatilities, low fees, high profitability scores, and relatively high assets under management. The historical performance table showed how well highly-profitable mega-cap ETFs like MGC performed over the last decade, but the fundamentals suggest a different market. Value-focused ETFs like ILCV feature meaningful valuation discounts for only small sacrifices in estimated growth and are more likely to outperform going forward.
If I missed anything or you have questions about another ETF you use as a core holding, please let me know in the comments section below. Thanks for reading, and Happy Holidays!
For further details see:
3 Core U.S. Equity ETFs For 2023