AOD - 3 High Performing CEFs At Reasonable Prices
2023-07-18 06:56:36 ET
Summary
- Liberty All-Star Equity, BlackRock Science and Technology Trust, and abrdn Total Dynamic Dividend are large, liquid, and reasonably priced closed-end funds with high yields and minimal leverage.
- All three funds focus on diversified portfolios across various sectors and market segments, aiming for long-term capital appreciation and regular income generation.
- While all three funds have exposure to leading tech stocks, they are not as top-heavy as the S&P 500 index, offering stability and the ability to capitalize on a broadening market leadership.
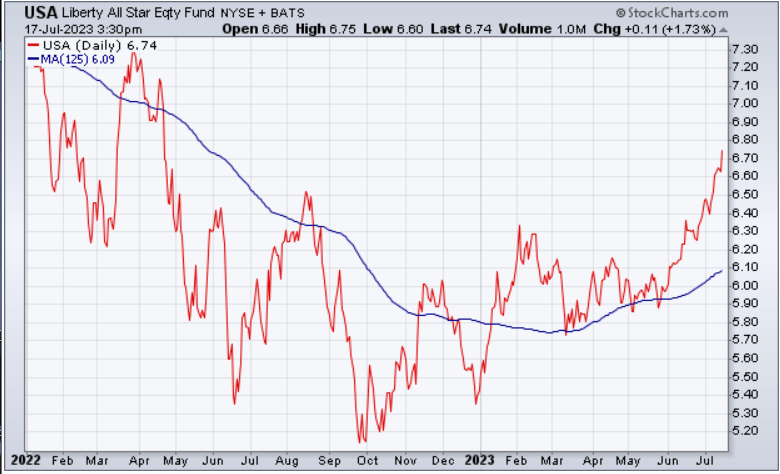
Liberty All-Star Equity ( USA ) is a closed-end fund listed on the New York Stock Exchange. The fund primarily focuses on equity investments with the objective of providing long-term capital appreciation and current income. Liberty All-Star Equity is known for its diversified portfolio of high-quality stocks and its approach of actively managing the fund's assets.
The fund's portfolio managers select securities for investment based on their fundamental analysis, market research, and evaluation of potential growth prospects. The fund typically invests in a diversified portfolio of common stocks, including both large-cap and small-cap companies across various sectors.
Liberty All-Star Equity maintains a diversified portfolio to spread investment risk and capture opportunities across different market segments. The fund's holdings are carefully selected by the portfolio managers, who aim to identify companies with strong growth potential, solid financials, and attractive valuation metrics. The diversified approach helps to mitigate the impact of individual stock performance on the overall fund's returns.
In addition to capital appreciation, Liberty All-Star Equity seeks to provide current income to its investors. The fund achieves this through the dividends and interest payments received from its equity investments. This income can be particularly appealing to investors who prioritize regular cash flow and income generation from their investments.
The fund's investment approach combines a bottom-up stock selection process with a top-down analysis of macroeconomic trends and industry dynamics. The portfolio managers conduct rigorous research to identify companies that they believe are undervalued or have the potential for significant growth. They also consider factors such as corporate governance, competitive positioning, and industry trends to make informed investment decisions.
Liberty All-Star Equity is managed by a team of experienced investment professionals who have a deep understanding of the equity markets and a track record of successful investing. The team's expertise and knowledge play a crucial role in the fund's stock selection process and portfolio management.
It is important to note that Liberty All-Star Equity does not utilize leverage as part of its investment strategy. While leverage can amplify returns in favorable market conditions, it also increases risk, as losses can be magnified during market downturns.
USA by the numbers
| Market Value (Morningstar) |
| $1.8 Bn |
| Total Distribution Rate (Morningstar) |
| 9.65% |
| 10-Year CAGR with Dividends Reinvested (dqydj.com) |
| 11.6% |
| Total Return YTD (Morningstar) |
| 22.2% |
| Last Actual Premium to NAV (Morningstar) |
| 1.07% |
| 3-Year Average Premium to NAV (Morningstar) |
| 0.95% |
| Total Leverage Ratio (Morningstar) |
| 0.00% |
Ten largest holdings Portfolio
Weight
| Microsoft Corp. |
| 3.13% |
| UnitedHealth Group Inc. |
| 2.16% |
| Amazon.com Inc. |
| 2.09% |
| Alphabet Inc. Class C |
| 2.05% |
| Visa Inc. Class A |
| 1.97% |
| Booking Holdings Inc. |
| 1.75% |
| Adobe Inc. |
| 1.68% |
| ServiceNow Inc. |
| 1.68% |
| S&P Global Inc. |
| 1.60% |
| Sony Group Corp. ADR |
| 1.52% |
USA daily prices from January 2022 to present. (stockcharts.com)
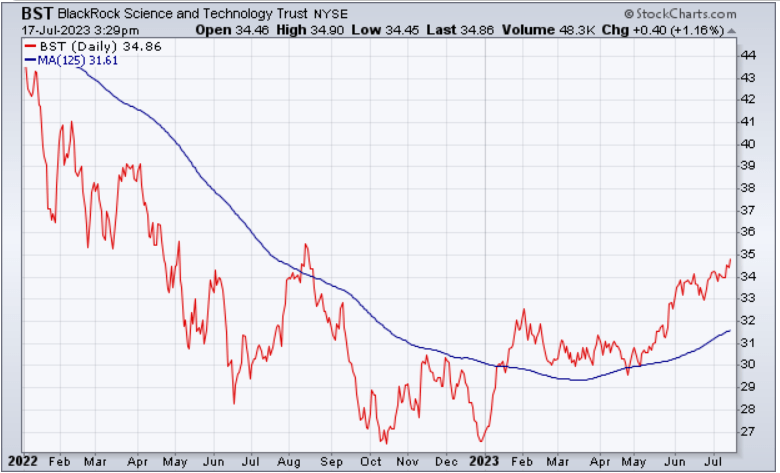
BlackRock Science and Technology Trust ( BST ) is a closed-end fund that specializes in investing in companies within the science and technology sector. The fund's primary objective is to provide long-term capital appreciation by capitalizing on the potential growth and innovation in the science and technology industries. BlackRock Science & Tech Trust is known for its focus on high-growth companies and its commitment to staying at the forefront of technological advancements.
BlackRock Science & Tech Trust follows an actively managed investment strategy that focuses on investing in companies within the science and technology sectors. The fund seeks to identify innovative companies with high growth potential and invest in their securities. The portfolio managers conduct in-depth research and analysis to select companies that they believe will benefit from technological advancements, industry trends, and market disruptions.
The fund's investment focus is on the science and technology sectors. This includes companies involved in areas such as information technology, biotechnology, healthcare technology, telecommunications, software development, semiconductor manufacturing, and other industries driving technological innovation. By concentrating on these sectors, BlackRock Science & Tech Trust aims to take advantage of the potential for significant growth and capital appreciation in these industries.
BlackRock Science & Tech Trust maintains a diversified portfolio of investments across various science and technology sectors. This diversification helps to spread risk and minimize the impact of any single investment on the overall performance of the fund. The fund's holdings may include both large-cap and small-cap companies, providing exposure to different stages of growth and innovation.
The fund is actively managed by a team of experienced investment professionals who specialize in the science and technology sectors. These portfolio managers utilize their expertise and industry knowledge to identify companies with strong growth prospects and assess their investment potential. They continuously monitor the portfolio, make adjustments based on market conditions and new investment opportunities, and aim to generate long-term capital appreciation for shareholders.
BlackRock Science & Tech Trust places a significant emphasis on investing in innovative companies that are at the forefront of technological advancements. The fund seeks out companies that are developing disruptive technologies, creating new business models, or driving industry transformations. This focus on innovation positions the fund to potentially benefit from emerging trends and advancements in the science and technology sectors.
BST by the numbers
| Market Value (Morningstar) |
| $1.1 Bn |
| Total Distribution Rate (Morningstar) |
| 8.71% |
| 10-Year CAGR with Dividends Reinvested (dqydj.com) |
| 13.93% |
| Total Return YTD (Morningstar) |
| 28.45% |
| Last Actual Discount to NAV (Morningstar) |
| -.72% |
| 3-Year Average Discount to NAV (Morningstar) |
| -.01% |
| Total Leverage Ratio (Morningstar) |
| 0.07% |
Ten largest holdings Portfolio
Weight
| Microsoft Corp. |
| 8.75% |
| Apple Inc. |
| 7.97% |
| NVIDIA Corp. |
| 5.59% |
| ASML Holding NV |
| 2.88% |
| Cadence Design Systems Inc. |
| 2.45% |
| Mastercard Inc. Class A |
| 2.43% |
| Broadcom Inc. |
| 2.19% |
| Tesla Inc. |
| 2.03% |
| Alphabet Inc. Class A |
| 1.84% |
| Amazon.com Inc. |
| 1.82% |
BST daily prices from January 2022 to present. (stockcharts.com)
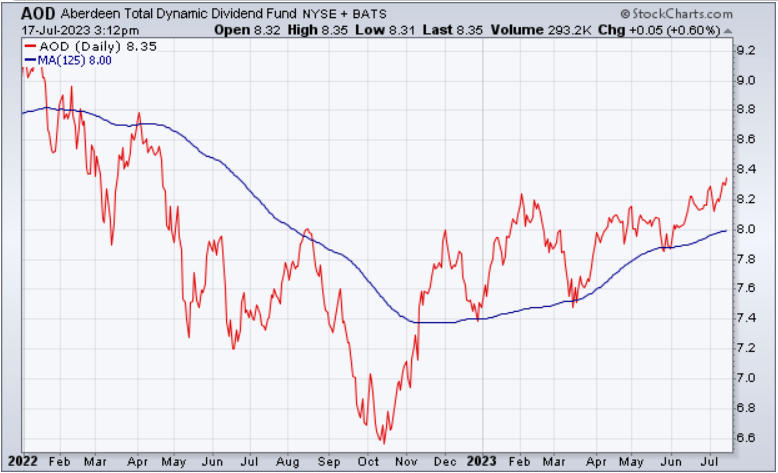
abrdn Total Dynamic Dividend (AOD) is a global equity closed-end fund that focuses on providing investors with a consistent stream of income through dividend payments. The fund's objective is to generate a high level of current income while also seeking capital appreciation over the long term. abrdn Total Dynamic Dividend is known for its dynamic dividend strategy and its portfolio of diverse income-generating investments.
abrdn Total Dynamic Dividend follows a dynamic dividend strategy, which means that the fund's managers actively adjust the portfolio composition to optimize income generation. The fund invests in a diversified range of income-producing securities, including dividend-paying stocks, real estate investment trusts (REITs), preferred stocks, and other income-generating instruments. The investment strategy aims to capture attractive dividend yields while managing risk and enhancing total returns.
The primary objective of abrdn Total Dynamic Dividend is to generate income for its investors. The fund's portfolio is constructed with a focus on securities that offer attractive dividend yields. Dividend payments from the underlying investments contribute to the fund's income stream, providing regular cash flows to shareholders. This income can be particularly appealing to income-oriented investors seeking consistent payouts.
abrdn Total Dynamic Dividend maintains a diversified portfolio across different countries, asset classes and sectors. The fund's holdings span various industries, including but not limited to utilities, financials, consumer goods, healthcare, and energy. This diversification helps to spread risk and reduces the impact of any single investment on the overall performance of the fund.
The fund is actively managed by a team of experienced investment professionals who specialize in income-focused strategies. The portfolio managers utilize their expertise to identify securities with attractive dividend potential while considering factors such as dividend sustainability, earnings growth, and financial health of the underlying companies. They continuously assess market conditions, monitor the portfolio, and make adjustments to optimize income generation and total returns.
abrdn Total Dynamic Dividend aims to distribute income to shareholders on a regular monthly basis. The fund may also distribute capital gains, if any, periodically. The specific distribution amounts and frequency can vary based on the performance of the underlying investments and the fund's dividend policy.
AOD by the numbers
| Market Value (Morningstar) |
| $875 Mil |
| Total Distribution Rate (Morningstar) |
| 8.31% |
| 10-Year CAGR with Dividends Reinvested (dqydj.com) |
| 16.35% |
| Total Return YTD (Morningstar) |
| 11.01% |
| Last Actual Discount to NAV (Morningstar) |
| -13.90% |
| 3-Year Average Discount to NAV (Morningstar) |
| -11.55% |
| Total Leverage Ratio (Morningstar) |
| 4.30% |
Ten largest holdings Portfolio
Weight
| Apple Inc. |
| 4.21% |
| Microsoft Corp. |
| 3.36% |
| Broadcom Inc. |
| 1.83% |
| BE Semiconductor Industries NV |
| 1.68% |
| Alphabet Inc. Class C |
| 1.67% |
| Engie SA |
| 1.65% |
| Lowe's Companies Inc. |
| 1.56% |
| TJX Companies Inc. |
| 1.53% |
| RWE AG Class A |
| 1.52% |
| Schneider Electric SE |
| 1.49% |
AOD daily prices from January 2022 to present. (stockcharts.com)
Summary
I chose these three CEFs because they are large, liquid, and reasonably priced. They have high yields, very good 10 year CAGRs, and very little leverage. While they all have exposure to the mega cap tech stocks that have been leading the market this year, they are not as top-heavy as the cap weighted S&P 500 index. Being diversified across other market segments adds stability and enables these funds to capitalize on the broadening out of market leadership.
For further details see:
3 High Performing CEFs At Reasonable Prices