MLI - 3 Things Look Different For Mueller Industries This Cycle
2023-04-13 14:29:29 ET
Summary
- Company margins are not declining in line with copper prices down year over year.
- Piping segment's margins have entered a new historically higher zone.
- Climate segment has become a meaningful portion of total company results.
- Why I'm not worried about recent insider sales.
- Despite the rally, the stock may be a true hold versus a sale at this point, and over time, it may garner a higher valuation range.
Introduction
I try to write articles about companies and theses that are not commonly found on this site. Almost three years ago, I wrote such an article about Mueller Industries ( MLI ) which you can find here . It had been almost three years before that date since anyone on Seeking Alpha had written about the company, and there was no real street coverage to speak of, making it a perfect candidate to share from the companies I follow. MLI was trading at $26.75 the day before my article came out. Fast forward to today, and the stock has recently traded in the mid-$70s. As you might suspect, we've had many more articles written since then, including seven total last year with two more so far this year. Writing about stocks that have tripled getting this much attention is not my usual offering. However, the fundamental performance over the last three quarters suggests that something significant might have changed with this company's consolidated prospects, and looking forward I can see the possibility for this stock to receive a higher valuation range than it has historically.
For a value investor such as I am, suggesting that a stock might garner a more favorable valuation from the market looking forward is no small suggestion. In fact, it's perfectly antithetical to the basic investment philosophy which I espouse. If you've been following me on Twitter, or were reading the comments to that original article, then you know that I shared back in mid-July of 2022 that I cut my MLI position in half when it was trading in the mid-60s:
In the first article I talked about how the stock behaves relative to copper pricing, and in fact, tends to peak and trough before copper futures prices. The peak in copper prices came in the fall of 2021, and while prices hadn't started to deteriorate meaningfully at that point, the year-over-year comparisons for copper were turning down in that Q2 of 2022 suggesting the Bull phase was at an end. Normally it's best to sell cyclical stocks before the downturn begins as the market tends to discount Industrial stocks by at least six months. With the stock trading up into the mid-70s and fundamental earnings performances that continue to post historically massive figures for this company, the appropriate response is to investigate the possibilities as to why this is happening and see if there's any sustainability to what seems like a different level of fundamental performance for this company. If I were seeing this thesis from other authors then I wouldn't bother writing this. I think the stock action has attracted authors, but I don't see the necessary understanding of how MLI's business has historically worked in their analysis to realize that something significant might have changed in the business model. There are three points I'm going to discuss that have my interest piqued in their long-term performance moving forward, and have kept me from selling any more shares in the stock despite its current valuation versus historical ranges like Price-to-Book value.
Copper Price Trends and MLI's Consolidated Margins
MLI SEC Filings and Investing.com Copper Price
The chart above shows the quarterly consolidated EBITDA margin for MLI with the historical average quarterly price of copper futures . It's not an overstatement to call the change in margin production massive this time versus the 2010-2011 period when copper prices were last in this neighborhood. Normally MLI's stock outperforms when copper prices are heading up as they gain a little leverage on their fixed costs. However, they haven't been a price setter, but a price taker, as the majority of their product portfolio will change pricing in line with the change in copper prices. This is due to the declining share of copper and brass piping in the construction industry as PVC pipes have continued to take share of the overall market. MLI has been the consolidator in an industry with a shrinking share of the market, which has left them as one of a very few options left in this market space.
That's not the whole story that I would point to as being of interest here in how MLI's fundamentals behave relative to copper prices. In fact, there's a very specific reason why I've waited until now to write this article as I wanted to be sure we'd seen enough quarters reported to believe this is more than a normal temporary phenomenon. There have been other periods in MLI's history where we've seen margins hold up or improve even though the quarter saw a negative year-over-year decline in copper prices. However, we haven't seen that happen for three quarters in a row which just happened with the report of their fourth quarter from last year.
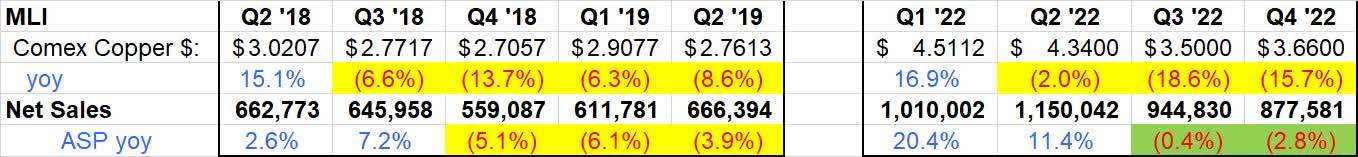
Here are the two most recent periods where we've seen year-over-year copper prices decline on a quarterly basis, and how the average selling prices ((ASP)) behaved for the consolidated results. You can see how it often takes a quarter before the ASPs decline similarly with the copper pricing. It's not always the exact magnitude, but to a large degree, they have moved together. The delay is partly due to the variability of our quarterly measuring stick here, and the fact that we're using futures pricing versus the spot market. These last two periods though in 2022 produced a change which I highlighted in green. While Q3 and Q4 did show negative ASPs overall, they were materially less than what we've seen in the last downturn and previous cycles for that matter. This of course led to significant margin expansion and some very impressive quarterly reports last year.
MLI SEC Filings + Copper Prices from Investing.com
Another way of describing this change is to see the rate of change, or delta, between MLI's average selling prices and the year-over-year change in copper prices. The chart above shows how the spread is growing during this cycle, and the upside for ASPs over Copper is higher than what occurred at the peak in the last cycle of 2018-2020. This is not a slam dunk depiction as we saw a larger decline briefly there in 2021, but it's another datapoint in the mosaic that suggests something appears to be different this time in their business model. The next logical question is to ask what is driving this fundamental response and is it sustainable.
The Piping Segment's Changing Performance
Arguably the biggest fundamental change in MLI's response to declining copper prices has been in the Piping Segment's performance. Historically, the segments of Piping and Industrial Metals tend to follow with the trend in copper prices, but this cycle we're seeing a very different response from Piping.
Copper Comex Price (MLI SEC Filings) Piping Segment Gross Margins (MLI SEC Filings)
The gross margin in the Piping segment has doubled from previous levels, but I'd highlight that the margin trend began before copper prices started to rise. It also hasn't receded to the same degree as copper pricing has over the last three quarters. This is not the performance that we've seen from the other copper pricing sensitive segment in Industrial Metals. It would be easier to believe there is a single answer but like life it's more likely complex with debatable degrees in sensitivity. The company has been both acquiring and divesting certain businesses in this segment for many years, and it is hard to argue against the thesis that these changes have slowly had an impact on this segment's fundamental performance.
The magnitude of the total change in margins, however, suggests that more may be a part of the answer. The company has been focused on their suite of businesses being no worse than the second largest in their respective markets, but it also may be time to consider that the market itself has changed to the point where the Piping segment is now more of a price-setter than taker. There simply may be too few competitors left in these markets, allowing MLI to maintain pricing power even as copper pricing recedes. This is just speculation that will take many more quarters to verify, but whatever the reasons are for the change in Piping's performance, the results are vastly superior to anything we've seen before from the company and suggest their prospects may be fundamentally altered for the better into the future.
Climate Segment #2 For Total Results
MLI EBITDA Margins by Segment (MLI SEC Filings)
In my previous MLI article, I noted how the Climate segment was small but the company was building through acquisitions over time. The attractiveness was clear in its higher-margin profile and less sensitivity to copper pricing. The chart above shows how that trend has continued with Climate's EBITDA margins reaching levels even higher than Piping's performance. At the same time, the Metals segment has remained mostly static within a tight range in the mid-teens.
This segment doesn't get enough attention. MLI only started to provide data for Climate as an independent segment about seven years ago. Before that there were parts of it included within the Piping segment, but the growth and current impact cannot be understated.
MLI's EBITDA Contribution by Segment (MLI SEC Filings)
The above chart shows each segment's contribution to total company EBITDA. Piping is still the most important, but Climate now is the second largest contributor while Metals has declined to just over 10%. Considering each segment's EBITDA margins as well, you can see how the total company's margins have not only improved but should be less sensitive to the cyclical influence of copper pricing overall. The implications of that statement are profound, as it suggests the possibility that MLI's stock is worthy of reassessment by the market. A company that is less cyclical to commodity pricing with higher total margin profiles should garner a higher valuation multiple range from the market over time. In a nutshell, this is why MLI's fundamentals are worthy of attention right now.
Risks Including Insider Sales
As I mentioned at the start, this is not the same type of article I wrote nearly three years ago. As I previously mentioned, in mid-July last year I cut my position in half which I shared in the comments section of the previous article and on my Twitter feed.
True Value Investors don't chase stocks and know that when cyclical stocks look cheap by earnings and cash flow measures like P/E and EBITDA, then they usually are near the peaks of their cycles and should be avoided. Hence, my reference to a better cyclical valuation measure of Price to Book Value in the comment above.
As one may suspect from such a significant move in MLI's stock price both from an absolute and relative viewpoint, the insiders have responded with some stock sales which would appear to confirm the time-to-sell sentiment.
I've seen other articles suggesting this is a problem as well, and confirming their view that the stock should be avoided. In this case, however, I think it's important to review the context by which these sales are occurring. Management has been steadily and materially increasing its total ownership of the shares outstanding in the company, and it's now up to just under 5% of the total enterprise. Considering the magnitude of the absolute move of the stock over this period of time, it's not surprising at all that insiders would want to monetize some of their holdings. Bottom line is they're acquiring more stock over time than they are disposing of in the market.
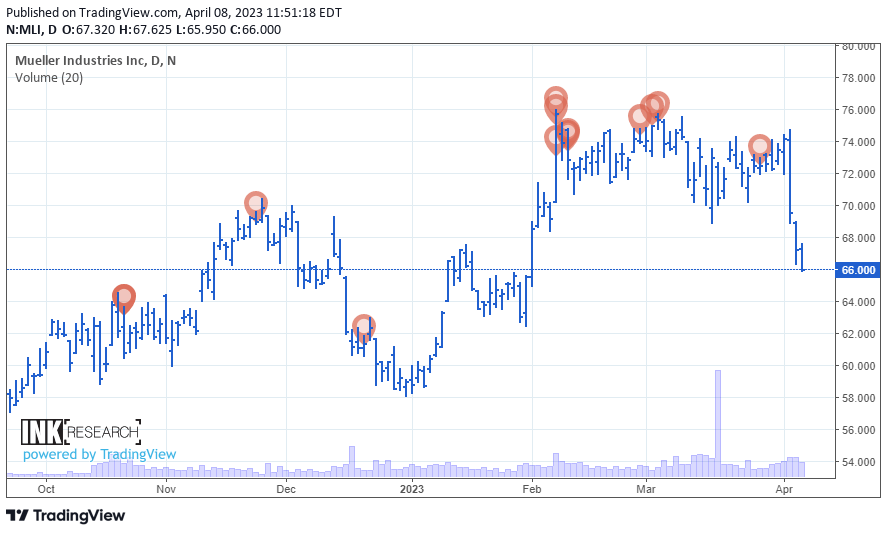
Another risk is one that just appeared out of nowhere. I actually started to write this article back at the start of March, but the first true bank runs in nearly a century stole my attention and time from completing this review. Then on April 3rd, the company issued this press release that a tornado hit their plant in Tennessee. While it states that they expect the financial impact to be immaterial to their results, the market has clearly taken a very different view of the potential impact to the risk/reward calculation and sold the stock off on the news. The stock has essentially traded straight down since the news hit after the close on April 3rd until recently stabilizing.
Obviously, this is the unknown and considering I had written a lot already about how the performance looks different than from previous cycles, as well as why I waited until three quarters after the copper price declines started to feed through their results, this news could skew the next few quarters results in a way that may be hard to determine whether the trends I've been discussing are continuing or were just a head-fake. If the company is correct and we see margins and EBITDA hold up better than previous cycles, then we've got something. Regardless of whether insurance covers damages, if production is getting shifted to other facilities there has to be some negative impact to margins. The degree to which is what we don't know at this point.
Valuation and the Potential Market Shift
Hopefully, I've been able to make the case well enough to suggest things really may be different this cycle for MLI warranting further examination and attention. The big question is if these trends really are the harbinger of a material and permanent change in the return profile of this company, then how will the market respond moving forward in its valuation profile? Clearly, one should expect that it is a higher range, but to what extent and what could the new range be moving forward? Without some idea of what appropriate answers might be to these questions, we can't derive either buy or sell zones that would be anything beyond technical or guessing. I consider this the fun part so let's take a look.
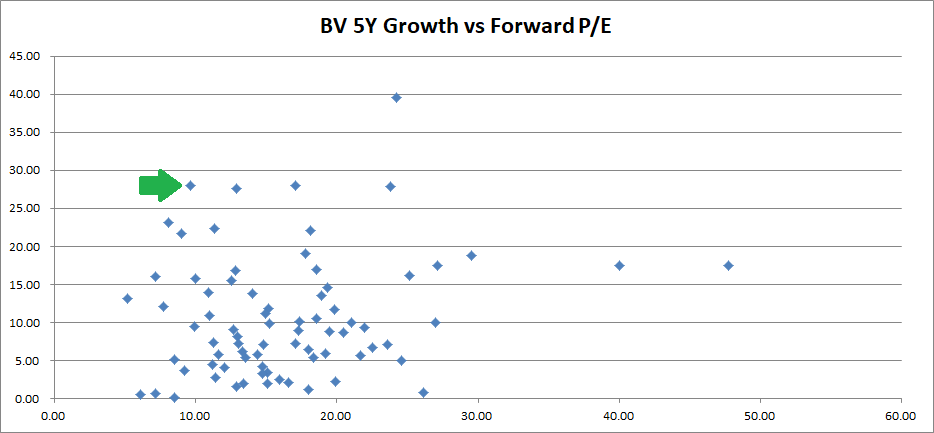
The above is a scatter chart showing 76 industrial Mid-Cap stocks from a Fidelity Investments screen for the sector. The X-axis is the forward P/E ratio and the Y-axis is the five-year average book value rate of growth. I wanted something that would capture the cycle more completely than just the last year or trailing twelve months for the group comparison. The green arrow shows the mark for MLI. As you can see it tends to be one of the cheaper stocks on a forward basis considering it's in the elite section of growth for the market. Hence, there is plenty still being discounted on the forward outlook.
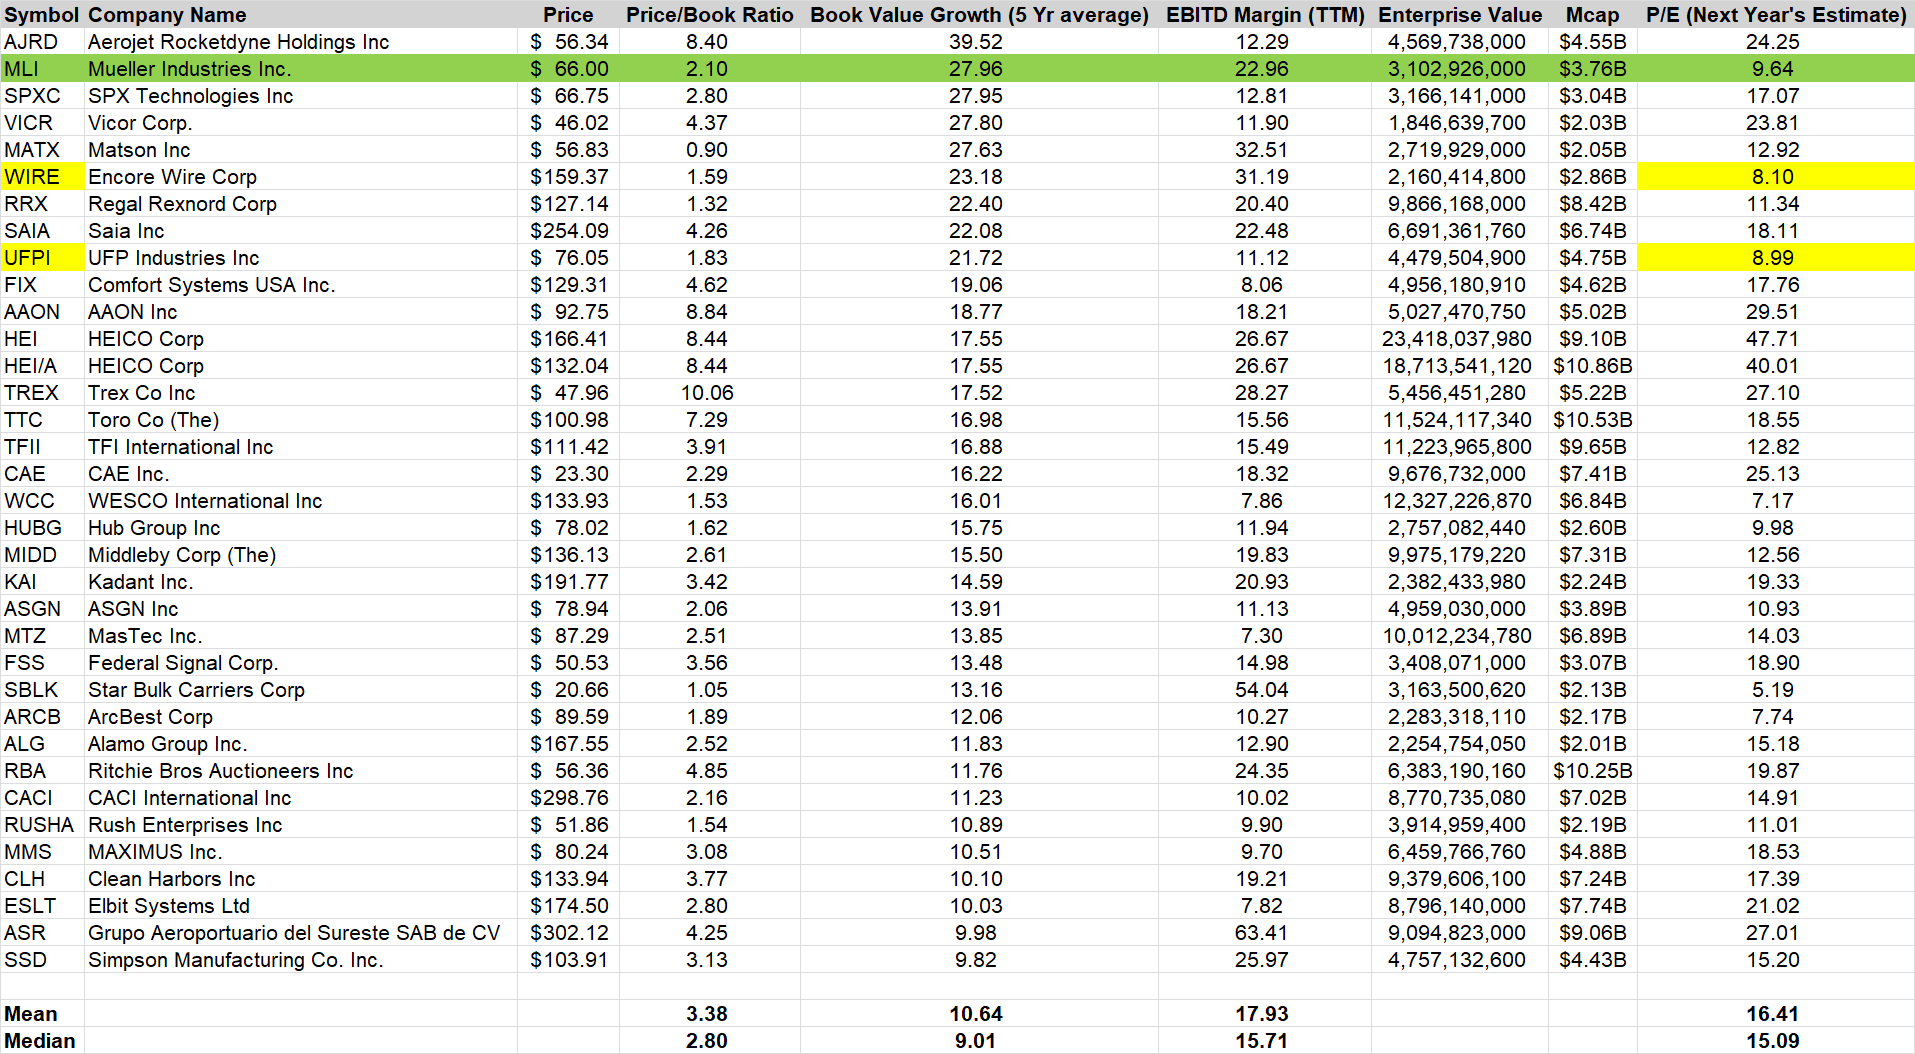
The above list is the top portion of the peer group I culled from the screen generated by Fidelity. I highlighted MLI in green and sorted in descending order by the five-year average book value growth of each company. I also included the mean and median averages at the bottom of the total peer group. I also highlighted in yellow two stocks due to their similarity to MLI. Specifically, Encore Wire Corp. ( WIRE ), and UFP Industries, Inc. ( UFPI ), both have generated similar growth rates but suffer low forward valuations. WIRE, in particular, is instructive in this case, because their business also produces significant copper-based products.
Notice the general trend in trailing twelve month EBITDA margin the two companies have shared dating back till the start of 1994. Each period wasn't exact for each company, but there's a clear link long-term between the two. There are two ways to look at the above chart in this case. The negative view suggests that the changes at MLI which I mentioned previously have less to do with them specifically than we would hope. WIRE has seen the expansion as well and to an even greater degree. Hence, this looks more wide-spread which could reverse, and that explains the forward market's view of discounting with low valuation multiples. On the other hand, the fact that this appears to be more wide-spread in its impact could just as easily suggest that its staying power too is being underestimated. Perhaps this supports the thesis that this market has turned into price-setters versus takers from consolidation. The below total construction industry growth rate will keep new competition from entering, but those that remain will generate returns on their assets that exceed previous historical performance. Only time will tell which view turns out to be accurate, but again I think all of these datapoints suggest this is worthy of our attention.
Let's hypothesize a bit more on this scenario. If MLI's profile is changing into one that generates a higher rate of return through each cycle, then what could it rationally receive as a market multiple moving forward? I cut that above peer group chart off at a specific point for a reason. The last company shown on it is Simpson Manufacturing Co. ( SSD ), which is currently trading at 15.20x forward P/E multiple. That's just about what the median average of this Mid-Cap Industrial peer group is trading for. Could MLI receive something similar eventually?
SSD happens to be a business and company I know well. You can see how well they've maintained their EBITDA margins over a very long period of time. Their end markets are more residential construction historically, so outside of the collapse in residential housing in 2008, they've usually maintained a margin in the high-teens to low 20% range. MLI has just reached this level for the first time. It should take a while to prove to the market this is sustainable before being granted a similar multiple. Still, we're talking about 50%-60% further upside just on multiple expansion, so this is absolutely worthwhile paying attention too.
Conclusion
Clearly, as our exploration through the peer group in the valuation section suggests, this potential change in MLI is not definitive quite yet. However, I do see those three primary reasons for optimism that perhaps something different is happening here in the return profile for this company. The similar behavior from WIRE confirms that something more broad has changed for these businesses that the market hasn't fully embraced yet. The magnitude of the margin gains, the limited pullback in those margins during these last three quarters of declining copper prices, and the absolute level of those margins are worthy of our attention. The moves in margins have attracted attention from some short sellers but not to as large of a degree as I would have expected. WIRE's short interest as a percent of the float is 12.1%, and MLI's is only 7.9%. Both are up but not at a level that screams short conviction yet in my opinion.
My investment style doesn't usually leave me to hold cyclical businesses like these for too long once they've had significant moves. I like to sell into strength and buy into weakness as I did last year with MLI. However, I'm intrigued enough to hold on in this case to what I currently have in MLI. This is a true HOLD, not a closet sell recommendation. If you don't have a position yet and are looking for an entry, then I'd probably suggest you wait on the sidelines for a better opportunity. This article is not a table-pounding recommendation with a ton of conviction. We don't know yet with enough certainty, but I hope I've conveyed enough to the reader that I'm very intrigued with what we've seen here over these recent quarters. Normally the performance should have come in a lot more than it has so far. If margins and returns continue to resist returning to their previous historical norms, then there may be another leg up in MLI's stock price just due to multiple expansion.
Last, in the previous article I mentioned that the stock usually behaves well in a bull market for copper and materials stocks. I sold off my broad commodity exposure to the market quite a while ago, and normally wouldn't be looking to make the case here for a resurgence. However, I'm a lot more open to the concept after the bank runs we've seen last month. The Fed is caught between the rock and hard place that those of us who have been critical of their ultra-low interest rate policy have been concerned about. I suspect that it will be exceedingly more difficult for the Fed to continue to fight inflation as their policy has already begun to break things within the financial system. Note that despite the performance of Mega-Tech stocks lifting market cap weighted indexes last month, the bank indexes have continued to languish and the best that can be said is they've stopped free-falling. I don't think we're out of the woods here yet. Thus, I've been taking some exposure to the materials sector which is technically in a relative Buy signal and suggests stocks like MLI as well may fare well in the future sentiment-wise from the market. Good luck out there investing, everyone.
For further details see:
3 Things Look Different For Mueller Industries This Cycle