BTAL - 4 ETFs To Bet On Falling Equities
Summary
- Shorting equity markets generally has historically been a high-risk proposition, but the risk of significant and protracted downturns is currently very high.
- Four ETFs, SH, TAIL, DWSH, and BTAL are examined according to three criteria -- performance, risk, and exposure to specific market scenarios.
- Even though SH has never and will never perfectly match the inverse performance of the S&P 500, it is likely to be an effective tool for beating the market.
- BTAL is a more conservative and more cyclically-oriented way of betting on a downturn that is also less dependent on timing the market while TAIL's emphasis on Treasuries also reduces risk relative to a pure bearish play.
- DWSH's emphasis on relative strength makes it a good way to take an aggressively bearish position without exposing oneself to the problem of leveraged ETFs.
Over the last twelve months, I have been arguing for both cyclical and "secular" downturns across the entire equity space, with tech leading the way lower. This thesis is rooted in the notion that markets do not behave in the way a bottom-up logic would suggest but that they instead behave in a way that implies a kind of systemic logic tied into specific valuation, inflation, geopolitical/ideological, and technological dynamics. Some of the indicators that equity markets are preparing to transition (from a "secular" bull market to a "secular" bear market) include very high PE ratios, high earnings growth, highly dispersed long-term sectoral returns, high tech/low energy performance, the rising prospects of a violent global political realignment, the market saturation phase of a technological supercycle, and an energy shock. Inverted yield curves have also been signals within this context, and all of these conditions had been met by the beginning of this year.
The main pillars of this argument can be found here:
A Primer On Long-Term Sector Rotations And Where We Are Now
Conjunction & Disruption: Technology, War, And Asset Prices
The Death of Irrational Exuberance
How And Why I Am Breaking My Rules For Commodity Trading
As I argued last week , long-term Treasuries are probably the best asset class to be in right now and for the next two years, if only because the outlook for equities and commodities is so depressing.
Thesis
In this article, however, I want to talk about four ETFs that are likely to appreciate over the coming selloff and how they might be expected to function over the coming months and quarters. In other words, I am not going to reargue my macro case here but rather focus on how a select set of instruments might behave, assuming that my overall market outlook is correct-namely that equities are likely to be flat to negative for the remainder of the decade and that such a long-term bear market is likely to be cyclically volatile. Cyclical volatility typically implies a couple of years of extreme pain followed by a couple of years of boom only to be followed by another couple of years of extreme pain. Such was the pattern of the three long-term bear markets of the 1930s, 1970s, and 2000s. This interaction between secular and cyclical was discussed in the Treasury article linked above and in Being A Bear Is More Complicated Than It Looks .
The four ETFs I want to compare are the ProShares Short S&P 500 ETF ( SH ), the AdvisorShares Dorsey Wright Short ETF ( DWSH ), the AGFiQ U.S. Market Neutral Anti-Beta Fund ( BTAL ), and the Cambria Tail Risk ETF ( TAIL ). I expect each of these funds will both outperform the S&P 500 over the next two years and see absolute gains. But, because they short the market in different ways, they have different idiosyncrasies and vulnerabilities.
DWSH is likely to experience the greatest appreciation from the peak to the trough of the market, followed closely behind by SH, but DWSH's relative strength strategy exposes it to volatility. BTAL will almost certainly underperform other short ETFs between the market peak and trough, but it appears much less dependent on timing. TAIL is the ETF least vulnerable to being directionally wrong. SH, the only ETF among the four that is not dependent on things like stock betas, put options, or relative strength--factors that are not easy to track or model--is the purest play, but the longer it is held, the more likely it is to undershoot the inverse performance of the S&P 500.
The relative risks of FOMO and SHTF
In a number of articles, I have argued that betting against equities or even just stepping away from them is a very risky endeavor from an historical point of view. The last century and a half of stock market returns in the US suggests that the odds are against you. Unfortunately (from the perspective of equity investors), history is much larger than the last 150 years of equity returns in the US, even accepting that US returns have probably been a good proxy of global equity returns. Nonetheless, most mainstream market commentary seems to apply the wisdom of the American philosopher Steven Wright in shaping its future market expectations: "I intend to live forever; so far so good."
Both Mr Wright and the American equity market's respective records of long-term returns will eventually fail. There is a good chance that, at least on the latter point, we may be on the brink of such a failure, but my outlook is not entirely dependent on that. I am more confident that a cyclical downturn has begun and--within the context of the conditions described in the first paragraph--the chances of a very deep downturn are elevated.
This is all a long-winded way of acknowledging the dangers that arise when it comes to shorting equities. Those dangers are real, but it is equally absurd to take long-term asset appreciation for granted.
I have heard an objection to this argument before that goes something like this: " Never bet on the end of the world , because it only happens once." There is some wisdom here. If you are stocking up on physical gold in your bunker out in Idaho in expectation of an apocalypse, this is actually a hedge against a rather specific probability, i.e., that gold will not only appreciate in value but be both safe to store and easy to trade. As Barton Biggs pointed out in his 2008 book, Wealth, War, & Wisdom , there were situations and periods in occupied France in the 1940s where gold's 'utility value' and 'chart value' decoupled. As Biggs put it,
you had to find either a real buyer or a black market dealer. Both were dangerous in that in a savage society rife with informers and treachery, anything could happen, and you might end up in an alley with a knife in your back or in a cellar with the Gestapo….[W]ith either buyer, you had to accept a significant discount from the true value of your gold….
Nonetheless, he continued, "gold buried in the backyard was a less dangerous, less expensive sale than any of the other alternatives like property or a business. [But] the people that got rich in France during the war were the black marketers."
Dreams of apocalypse push people to buy gold-and with good reason, as Biggs showed-but asset allocation is likely to be much less important than one's social position in whatever that new world order is likely to be. The same can be said for those who intend to buy farms in anticipation of a collapse in food production. If you are anticipating a food crisis of a scale so large that you would put all of your assets in farmland, you are implicitly imagining a scenario in which your land and your crops would be at risk of expropriation, perhaps violent expropriation.
The same logic is at play-albeit in the opposite direction-in the "never bet on the end of the world" argument, which is trotted out as an excuse to bet against even the slightest negative outcome. It is clever, but it is a strawman. In effect, we are being asked to believe that anything other than nuclear annihilation is a reason to be long the market.
My point is that there are a lot of very negative outcomes that lie between burying gold in your backyard and buying triple leveraged bullish Nasdaq ETFs. So, it is prudent to acknowledge that global equities, especially US equities, have had a 'hot hand' for a very, very, very long time but it is also prudent to be on the lookout for sustained macro challenges and for ways to profit off of them, if they cannot be avoided.
My analysis suggests that the balance between FOMO outcomes and SHTF outcomes has been increasingly shifting towards the latter outcome, but primarily through a shift in the center of gravity of global markets, economies, and sociopolitical stability.
Chart A. Tail risks are rising because downside risk generally is rising. (Author)
In such a world, "Never bet on the end of the world, because it only happens once" is a bad strategy, unless it is taken in its most literal sense. Short of that, worlds come and go. In my discussion of short equity ETFs below, I want to focus on:
- Maximizing gains from declining markets,
- Lowering risk against the consequences of being directionally wrong, and,
- How some of these ETFs are likely to respond to different market conditions.
Four ETFs for shorting equities
A good place to start is their respective historical performances against the SPDR S&P 500 ETF ( SPY ).
Chart B. All of these ETFs have consistently and massively underperformed the market over the duration of their respective existences! (Stockcharts.com)
Over the course of their collective existence, they have only experienced two bear markets, and the 2020 Covid bear market is the only one in which all of them participated.
Chart C. Each of these four ETFs beat the market by a wide margin during the 2020 crash. (Stockcharts.com)
The simple fact of the matter is that they have grossly underperformed the broader market. Again, the risks entailed in shorting the market are real. In the current bear market, the performances of each of these ETFs have looked nearly identical, apart from TAIL.
Chart D. Each of these instruments has consistently beat the market in this year's selloff. (Stockcharts.com)
The Cambria Tail Risk ETF
TAIL is perhaps the most conservative and oddly-structured of the four. Cambria describes its product thusly (emphasis mine):
The Cambria Tail Risk ETF seeks to mitigate significant downside market risk. The Fund intends to invest in a portfolio of "out of the money" put options purchased on the U.S. stock market. TAIL strategy offers the potential advantage of buying more puts when volatility is low and fewer puts when volatility is high. While a portion of the fund's assets will be invested in the basket of long put option premiums, the majority of fund assets will be invested in intermediate term US Treasuries. As the fund is designed to be a hedge against market declines and rising volatility, Cambria expects the fund to produce negative returns in the most years with rising markets or declining volatility.
Over 80% of the fund is invested in 10-year Treasuries, meaning it will have at least some tendency to track ETFs like IEF, while the rest is invested in long put options which should appreciate when the S&P 500 falls. As Juan de la Hoz, who has covered TAIL extensively, explains it , the likeliest explanation for TAIL's failure to meaningfully beat the S&P 500 this year is the weak performance of Treasuries. "TAIL's S&P 500 put options have performed as expected, posting significant gains as equity markets tumble. TAIL's treasury holdings have not, posting significant losses as inflation sends rates skyrocketing upwards."
Chart E. TAIL is a middle way between a pure bet against equities and a bet on Treasuries. (Stockcharts.com)
As the chart above shows, TAIL has tended to be less risky than SH (in green) but riskier than Treasuries (in orange). The ratio of TAIL to IEF, in the lower panel, suggests, however, that the relatively weak performance of TAIL this year is not entirely due to Treasury weakness. It appears that the bear rally in equities over the last two months did enough to damage to put option strategy of TAIL to erase its April-June outperformance of Treasuries.
In any case, as I explained in "IEF: Treasuries Are The Least Worst Option" linked to at the beginning of the article, there are reasons to expect Treasuries to outperform and even see real appreciation in price. The combination of stabilizing Treasury yields and a resumption of the bear market in equities should see TAIL rise in value over the coming quarters. In sum, TAIL is a relatively low-risk yet roundabout way of betting against the S&P 500.
ProShares Short S&P 500
SH is the purest play of the four, since it is the only one of the funds that is a straightforward attempt to provide daily -1x returns relative to the S&P 500. Other ETFs, such as the Direxion Daily S&P 500 Bear 1X Shares ( SPDN ), attempts the same and with a lower expense ratio but with much less liquidity. Much of what is said about SH can likely be applied to SPDN, but SH is essentially the bearish benchmark, and so we will stick to it.
SH has a few shortcomings which detractors can be quick to point out when it comes to considering the fund. SH has consistently underperformed the inverse performance of the S&P 500 during each of the major selloffs of the last fifteen years, as illustrated in the chart below.
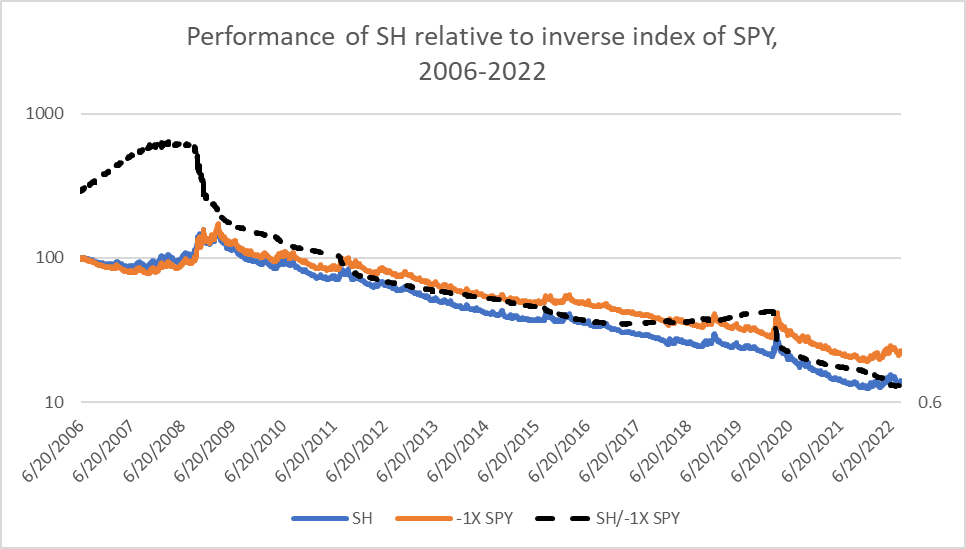
Chart F. SH has underperformed the inverse performance of SPY in virtually every bear market or major correction. (Author calculations from Stockcharts.com data.)
This is a ratio of SH to the inverse performance of the S&P 500. Between 2006 and 2022, SH underperformed the inverse performance of the market by over 30% . And, much of the underperformance occurred during the GFC in 2008-2009.
But, these statistics are somewhat misleading. Take SH's worst underperformance (by this metric) in the GFC. By my calculations, SH underperformed a -1x SPY index by about 12% between August 2008 (the peak of the ratio in Chart F) and the March 2009 market bottom, but in that period, SPY was down 46% while SH was up 58% . That is, by my calculations, SH rose more than SPY fell by about 12%!
How is it that the SH rose more than the SPY fell in that period, even though the SH rose less than an inverse index of the SPY? I believe a simple thought experiment illustrates this.
| A hypothetical market index |
| INDEX |
| Index -1x |
| Bear fund |
| Year 1 |
| 1 |
| 1 |
| 1 |
| Year 2 |
| 2 |
| 0.5 |
| 0.49 |
| Year 3 (peak) |
| 4 |
| 0.25 |
| 0.2401 |
| Year 4 |
| 2 |
| 0.5 |
| 0.470596 |
| Year 5 (trough) |
| 1 |
| 1 |
| 0.922368 |
| Peak to trough performance |
| -75% |
| 300% |
| 284% |
In the table above, a bear fund that has a built-in tracking error of -2% per year relative to an inverse index of a market index rises less than the inverse index (284% - 300% = -16%) but also rises substantially more than the market index fell during the bear market (284% - 75% = 211%).
People who criticize SH's performance are not wholly wrong. SH has a 0.89% expense ratio; using derivatives does tend to lower returns; and it is not meant to be held in perpetuity. Moreover, by nature of its goal to match one day returns, as markets rise, one's losses are likely to be compounded (although to a much lesser degree than leveraged ETFs like QID). But, at the end of the day, SH has provided considerable downside returns for those who felt they wanted to risk being the alpha bear at those moments. It is just not for the faint of heart or the risk averse.
AGFiQ U.S. Market Neutral Anti-Beta Fund
BTAL has much less risk but provided downside protection in the 2020 crash and throughout 2022, as illustrated in Charts C and D. BTAL is, as the label on the tin says, "anti-beta". It shorts high-beta stocks and is long low-beta stocks. Among its roughly 400 long and short holdings , for example, it is long Intel ( INTC ) and short Nvidia ( NVDA ). As the chart below illustrates, on a sectoral basis, it is net short tech and health care at the moment, but there is no sectoral bias.
Chart G. BTAL is market- and sector-neutral.
At the moment, it is acting as a bet against high-beta, small-cap, high-valuation companies, which are precisely the kind that might be expected to suffer in a cyclical downturn. As the chart below shows, PE ratios for shorted companies in BTAL are nearly twice the level of longs, and market caps are 20-30% higher in the long portfolio than in the short. In a piece on the last century's worth of small-cap stock performance, I argued that small caps across virtually every sector tended to be high beta , so the present bias against small caps in BTAL may be a persistent feature.
Chart H. In practice, BTAL is acting as a bet against small-cap, high-valuation stocks.
Let me define "cyclical downturn" here, however. A cyclical downturn is more than just a short-term bear market or recession. I define the cycle primarily from the momentum in corporate earnings and secondarily in industrial metals and interest rates . Stocks typically ignore these cycles, especially in "secular" bull markets. It is really only during "secular" bear markets where equities (and GDP) become "cyclical".
By this definition, you can have a cyclical downturn during a bull market. And, BTAL appears to be an ETF that can appreciate in value even during bull markets in equities. BTAL rose nearly 50% throughout the 2018-2020 period, when corporate earnings and industrial metals were declining and safe havens like gold and Treasuries were rising. I have tried to illustrate these tendencies in the four charts of the panel below. The findings are summarized in the final two panels, which shows that over nearly every 69-week period of the last decade, BTAL has been negatively correlated with yields and positively correlated with the gold/copper ratio, itself a shorthand way of presenting the market cycle.
Chart I. BTAL has appreciated when risk appetite declines, even when the broader market is not in decline. (Stockcharts.com)
The negative correlation between BTAL and the ten-year treasury yield ( in the chart above) has become strongly positive as high-beta stocks have rolled over even as yields have risen. Something similar occurred in 2018, as yields rose but decelerated going into the 2018-2020 downturn.
BTAL's tendency to become stronger as defensive assets like gold and bonds strengthen relative to risk-on assets like industrial metals and equities makes it a good alternative to an ETF like TAIL, which is directly tied into Treasuries, for those who think yields will continue to rise and damage high-beta growth stocks in the process. And, because it is neutral relative to the market as a whole, much of the angst that comes from a pure short play is removed.
The three charts below compare the performances of SH and BTAL over the three last cyclical downturns.
Chart J. BTAL outperformed SH during the 2015 and 2016 corrections. (Stockcharts.com) Chart K. BTAL was ahead of the game when Covid struck. (Stockcharts.com) Chart L. BTAL was ahead of the game again in 2022. (Stockcharts.com)
In each case, BTAL outperformed, in most cases because equities were late to catch up with the cyclical downturn that BTAL was already profiting from. BTAL solves a lot of the problems that arise with ETFs like SH. Less downside risk and less timing risk.
We have not seen how BTAL performs in a sustained meltdown like the GFC of 2008-2009. SH nearly doubled from trough to peak in 2007-2009. That is a performance BTAL would not be able to match, but you would likely have beat the market and then some. As long as investors keep in mind that BTAL is not a pure short play, it ought to provide a lot of the aggressive defensiveness that many might look for in a prospective downturn.
AdvisorShares Dorsey Wright Short ETF
DWSH is in many ways similar to BTAL, except that it has no long positions, and it shorts stocks with low relative strength rather than those with high beta. "Dorsey Wright identifies and short sells those securities with the highest relative weakness within an investment universe primarily comprised of large-capitalization U.S.-traded equities. DWSH's investment process is purely systematic and removes any human emotion from the day-to-day decision making," the AdvisorShares website says. What the elements of that process are, Dorsey will not say .
Chart M. DWSH's relative strength strategy has turned the fund against small- and mid-cap equities. (AdvisorShares) Chart N. For now, DWSH is also a bet against tech, consumer discretionary, and healthcare. (AdvisorShares)
I talked about the effectiveness of using short-term relative strength (about 10 months) as a long-term strategy in my previous articles on Treasuries. The historical evidence suggests this has been a fairly reliable strategy for the last century. Over a decade ago, Meb Faber wrote a paper showing that relative strength was a consistent source of alpha at the sectoral/industrial level of analysis over the course of the previous 80+ years. Because momentum is a widely studied equity factor, it is unlikely that the formula that Dorsey Wright uses is especially esoteric. Of course, one can never be sure, but it would be reasonable to expect that it their algorithm is built on the chassis of this historical research.
Practically speaking, this has put the ETF strongly overweight short positions in small- and medium-cap stocks, as well as information tech, consumer discretionary, and healthcare stocks (see Charts M and N above), precisely the sectors that I have argued will likely underperform over the remainder of the decade:
Amazon And Tesla Are Likely To Reverse XLY's Gains
XLK: Apple And Microsoft Likely To Weigh The Index Down
Health Care Fund XLV: Likely To Underperform Long-Term
DWSH is the youngest of the four funds, so we do not have a lot of historical data to look at.
Chart O. DWSH outperformed SH during the 2020 selloff, but was crushed in the rebound. (Stockcharts.com)
Year-to-date, as pointed out earlier, DWSH, SH, and BTAL have performed nearly identically. DWSH outperformed SH during the 2020 bear market by a wide margin, but then underperformed by an even wider margin as markets rebounded.
Interestingly, DWSH beat both the -2X leveraged ProShares UltraShort S&P 500 ETF ( SDS ) and the ProShares UltraShort QQQ ( QID ) during the 2020 bear market, as well (see the chart below), even though DWSH is unleveraged.
Chart P. Curiously, DWSH beat leveraged ETFs in the 2020 bear market. (Stockcharts.com)
DWSH has clearly underperformed against QID in 2022, however, probably because the bear market this year has been so heavily concentrated in tech stocks.
Ultimately, DWSH, by virtue of its emphasis on relative performance, behaves as a leveraged ETF but without taking on the risks specific to leverage. It is more aggressive than SH and thus has more risk, especially where relative strength shifts from one direction to another, as it appears to have done in the 2020 rebound, but it is much less vulnerable to the compounding risks that come from buying into leveraged ETFs before they go in the wrong direction.
DWSH is, I believe, a good way to take a very aggressive bearish position.
Summary
Each of these four ETFs offer different ways to hedge against or bet on a bear market. As someone who believes that we are still in the early stages of a cyclical downturn, I believe that all four will both see substantial relative and absolute gains over the next two years.
SH, for all of its faults, is probably the simplest and most straightforward way of betting on a general downturn.
BTAL is probably the safest way of betting on a downturn, and it is good way of hedging against the difficulties that come with timing bear markets.
TAIL, with its heavy concentration in Treasuries, is also a relatively safe way of betting against the market, although how precisely its put options will behave under different scenarios is very difficult to model, and it is both the weakness of Treasuries and the suboptimum performance of the put options strategy that has contributed to TAIL's relatively weak performance compared to the other three ETFs covered here.
DWSH is the most aggressive of the bunch and is the ETF most likely to approximate the returns one might expect from a leveraged bearish ETF while avoiding the risks specific to 'compounding error'. As with the other actively managed ETFs, BTAL and TAIL, the formulas that power it will always remain somewhat opaque. You have to have some faith in the power of relative strength and in Dorsey Wright's ability to utilize that power.
Conclusion
When you short the market, you are not only shorting a century's worth of positive returns but a century's worth of positive inflation. You are betting that an entire asset class will decline substantially in price, even though the monetary regime is geared towards producing consistently positive inflation. If you short the market, you have to believe either that the inflation machine has fundamentally broken down or that you can time a hiccup or idiosyncrasy in the machine that permits one to profit from it.
These kinds of ETFs are designed for the types of sociopaths that believe that they can anticipate either fundamental breakdowns or hiccups and idiosyncrasies in the monetary system and their relationship with the behavior of a specific asset class, in this case equities. I believe that history suggests that such hiccups are to some degree predictable and that the risk of a major deviation from the norms of the last century are very high, even high enough to open the possibility of a fundamental breakdown in the monetary regime.
To my mind, the size and probability of a crisis outweighs the size and probability of a resumption in the bull market. These ETFs each provide different ways of hedging against or profiting from the risks of such a crisis, and hopefully the discussion above helps readers think about when and how they might make use of such instruments.
For myself, because I want to maximize my exposure to the downside, I prefer buying DWSH and mixing and matching with even more aggressive leveraged ETFs like QID, SSG, and SOXS. If I were more risk averse, I would probably opt for BTAL, because it is less dependent on timing and is less likely to result in catastrophic losses if one gets the direction of the overall market wrong. For those reasons, I find DWSH and BTAL the most interesting of the four, but for the reasons stated throughout this article, there is no reason to be dogmatic about preferring one to the other.
For further details see:
4 ETFs To Bet On Falling Equities