WST - 4 Factor Dividend Growth Portfolio - Deep Dive Analysis
2023-07-21 17:26:15 ET
Summary
- My portfolio based on the stock selection methodology of The Dow Jones US Dividend 100 Index has returned 21.72% since its inception 8.5 months ago.
- This deep dive analysis tested the contribution that each of the 4 factors played on the final return of the portfolio.
- I performed simple linear regression analysis and single and multi-factor analysis which generated surprising results.
4 Factor Dividend Growth Portfolio
For the last 8.5 months I've been live testing a theory based on the stock selection methodology of SCHDs underlying index, The Dow Jones US Dividend 100 Index. The latest results of the actual portfolio can be found here . In the month-end June update the portfolio had a 19.88% return since inception, as of today that return is 21.72%. The portfolio is cruising towards a very good first year but lessons have been learned along the way, and there is always room for improvement. Through deep analysis I've made a few key observations that will lead to changes in the strategy when it comes time to rebalance the portfolio at the end of October this year.
In the last update several seeking alpha users requested an even deeper dive into the data and this is what I will provide in this article. My deep dive, as recommended, began with linear regression analysis and extended to single and multi-factor analysis in search of what is driving the strong results for this strategy and if there is even more room for improvement.
The results were not all favorable but I did make several key observations that will be shared next.
Deep Dive Into The Data
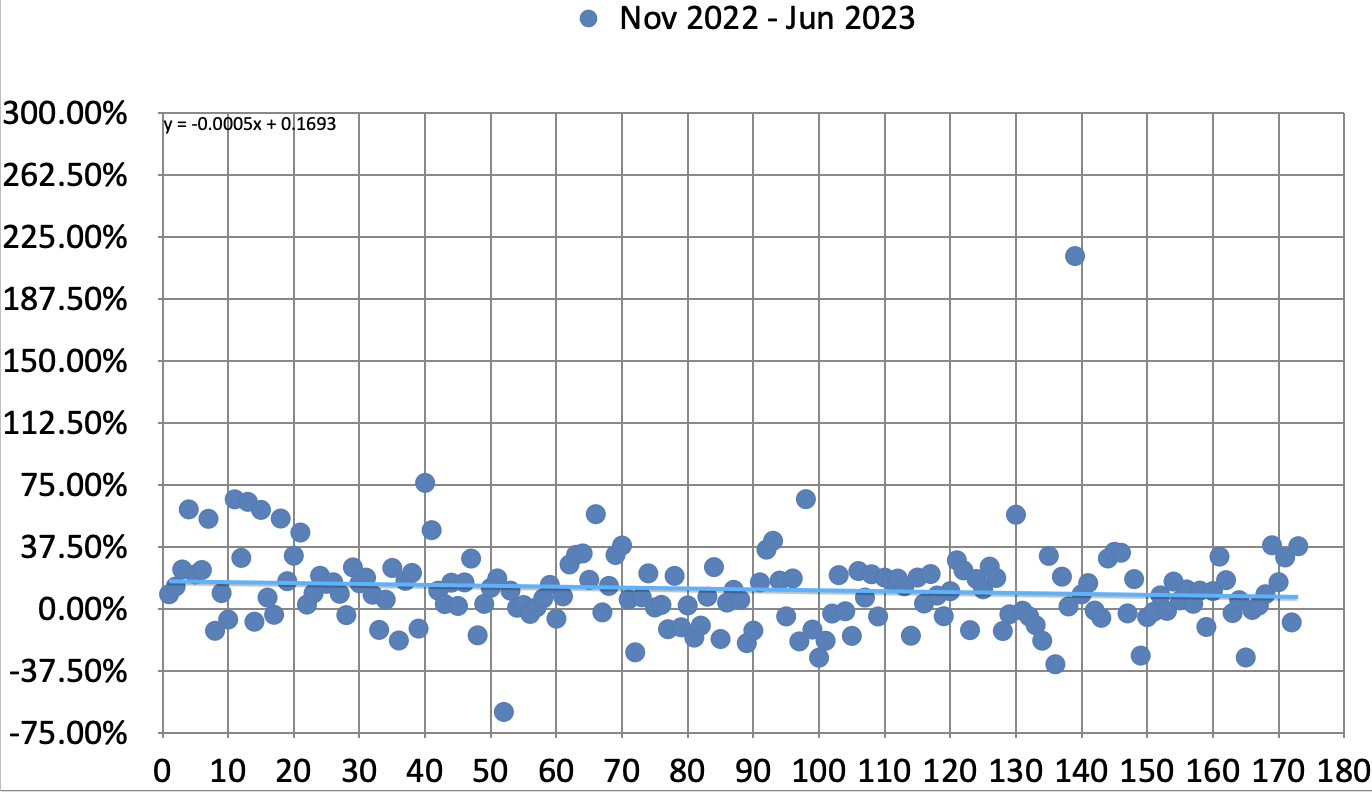
Let me start out with a scatter plot mapping the 8-month returns (Nov 2022 - Jun 2023) for all 173 stocks from the initial universe against their rank.
The first thing that catches the eye here is the one major outlier, stock ranked number 139, that has seen a very favorable return during this 8-month period. That stock is none other than Nvidia ( NVDA ) that is up 213.59% between November 2022 and June of 2023. Nvidia ranked pretty well in terms of free cash flow to total debt and return on total capital. The reason it ranked poorly overall is because Nvidia is neither a high yield dividend stock nor does it have a history of strong dividend growth. Aside from Nvidia the vast majority of the other 172 stocks hovered in a wide range of returns, between -30% and +40%. Looking at the linear trendline, the light blue line in the chart, we can see a favorable correlation between the rank and the 8-month return. The x-axis in the chart shows the rank of each stock and the chart should be viewed from right to left, with the left most data points being higher ranked stocks. In this case we can see the trendline move slightly higher as we move from right to left. Also the negative slope in the linear equation (-0.0005) is a positive indication that the ranking process led to favorable results.
Before I move on let me briefly remind you of the original ranking process. All 173 stocks that were part of the initial universe of stocks were ranked on the following 4 criteria.
- Free Cash Flow to Total Debt Ratio.
- 5 Year Dividend Growth Rate.
- Return on Total Capital.
- Forward Dividend Yield.
All individual rankings were combined into a cumulative rank and all stocks were sorted in ascending order. The top 30 stocks were selected for inclusion in the portfolio for a duration of 1 year. The same process will be repeated each year, with some minor changes going into effect in year number 2.
Several seeking alpha users questioned which of these 4 factors, if any, has been more beneficial in this screening process. I decided to test this first through single factor regression and then I further expanded to single and multi-factor analysis. The results will be outlined next.
Single Factor Regression
There were two ways for me to measure the impact of each factor on the total return, one is to use the ranking order and two is to use the actual factor values. I tested both methods and they led to the same outcome.
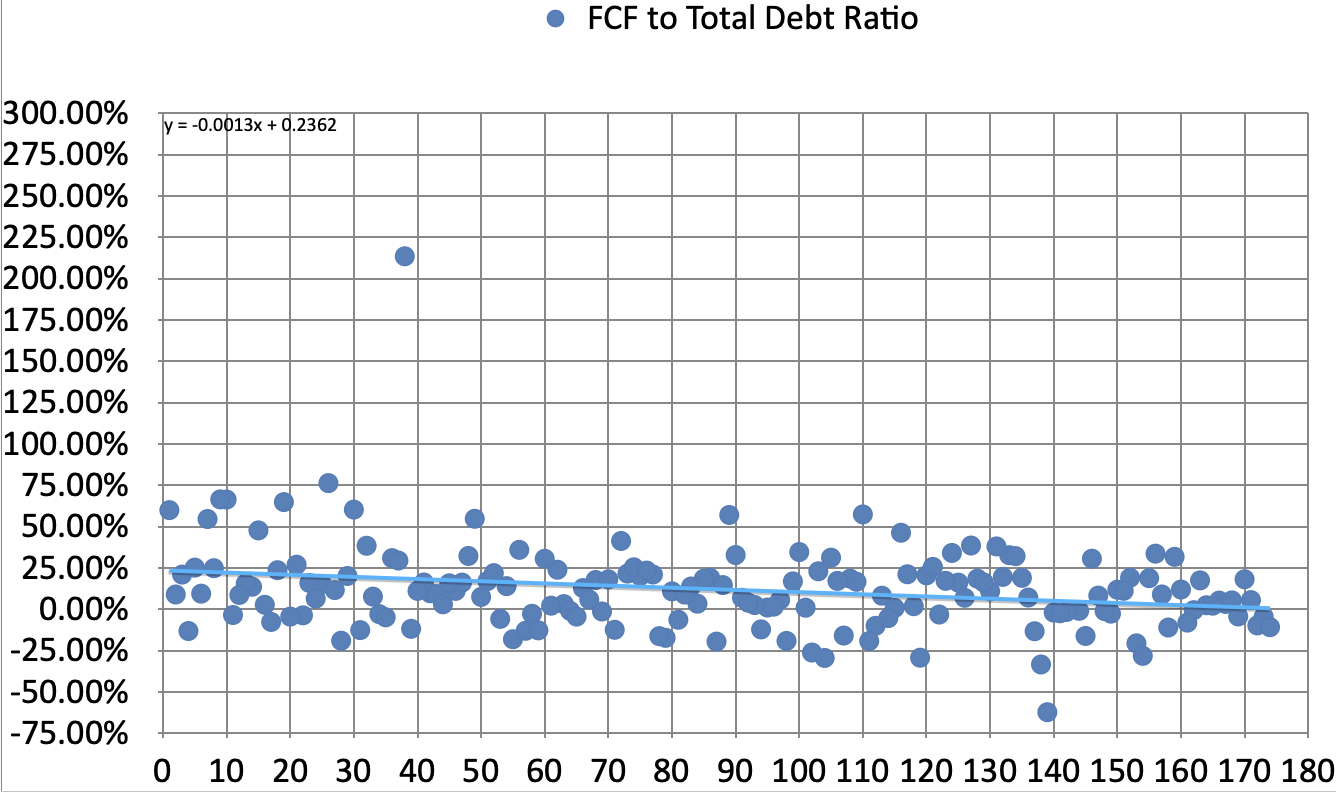
Let's start with the free cash flow to total debt ratio. Below is a scatter plot mapping the 8-month return against the original ranking of all 173 stocks.
We can see a negative sloping linear trendline that in this case represents a positive correlation between free cash flow to total debt and total return. The chart has to be interpreted from right to left and we can clearly see a pattern for stocks with higher free cash flow to total debt ratios seeing better total returns. Here is another view, this time comparing the actual free cash flow to total debt ratio values.
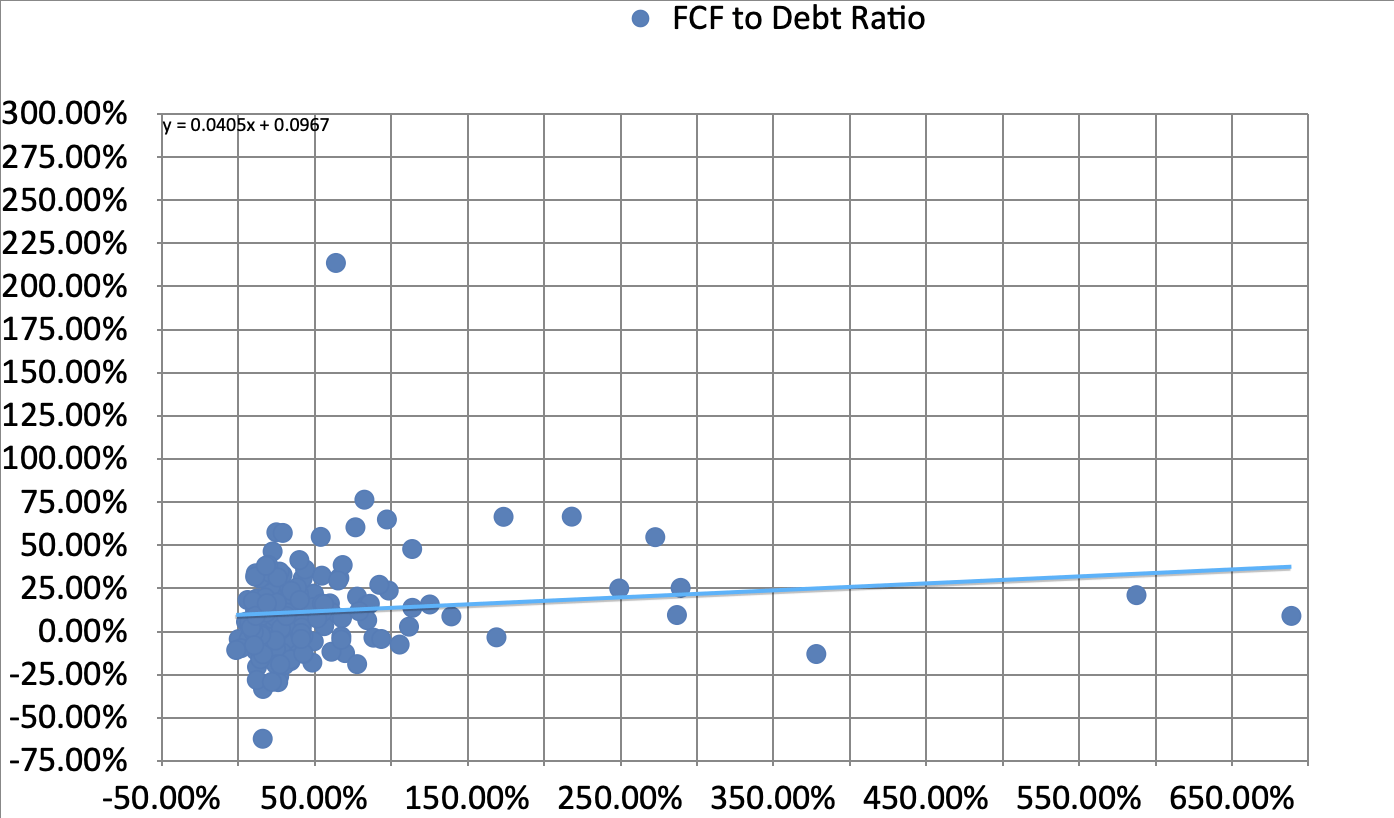
The majority of the data points are clustered in the lower left corner of the chart due to a few outliers with very high free cash flow to total debt ratios. Nevertheless this chart supports the same positive correlation between this ratio and the total return.
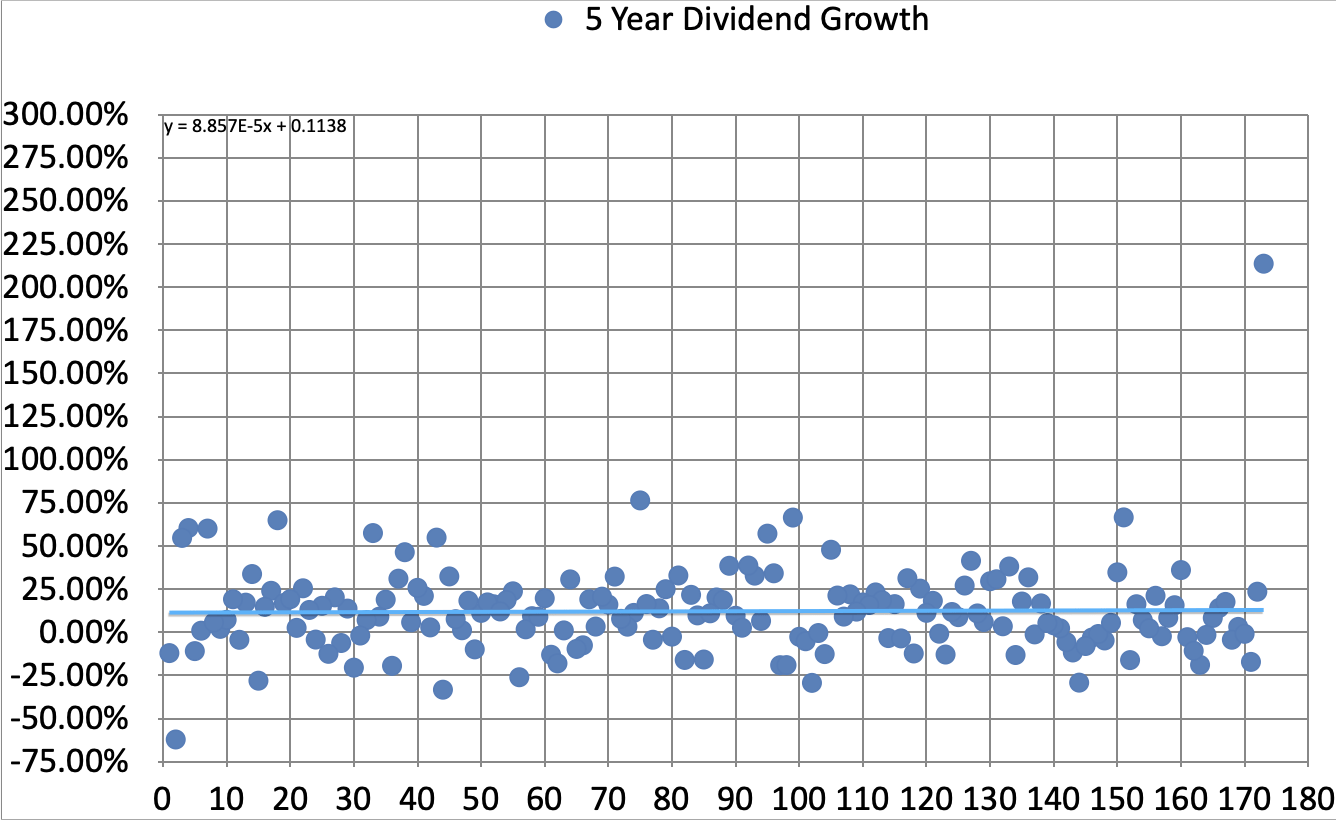
The next factor is the 5 year dividend growth rate. Below is a scatter plot mapping the 8-month return against the original ranking of all 173 stocks.
The linear trendline in this chart has a very minimal positive slope which in this case points to a negative correlation between the 5 year dividend growth rate and total returns. From this we can deduce that this factor has not positively contributed to the results, at least not on its own. Here is another view, this time comparing the actual 5 year dividend growth rate values.
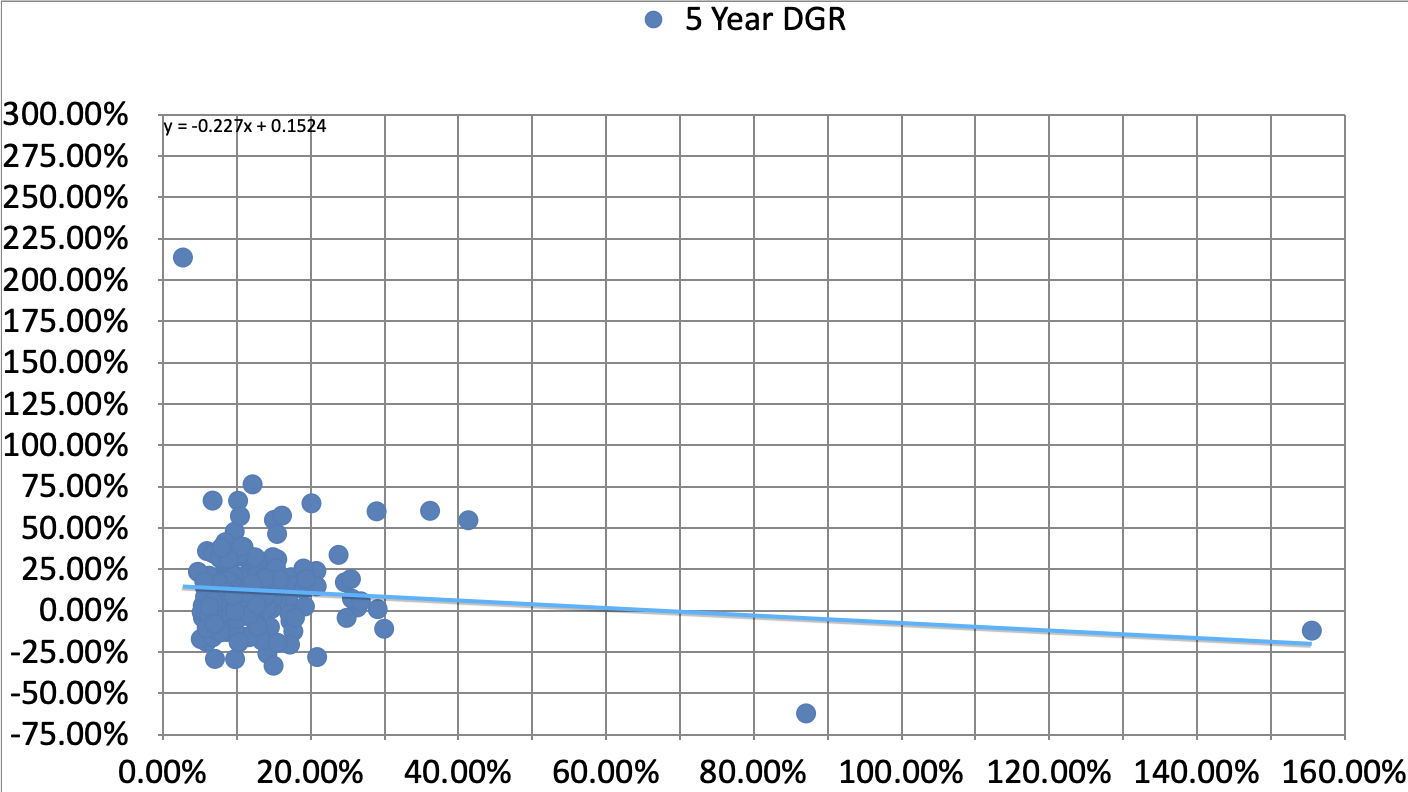
Again the few outliers have led to the vast majority of the data points being clustered in the lower left corner of the chart. But the linear trendline shows the negative correlation between this factor and total returns.
The next factor is the return on total capital. Below is a scatter plot mapping the 8-month return against the original ranking of all 173 stocks.
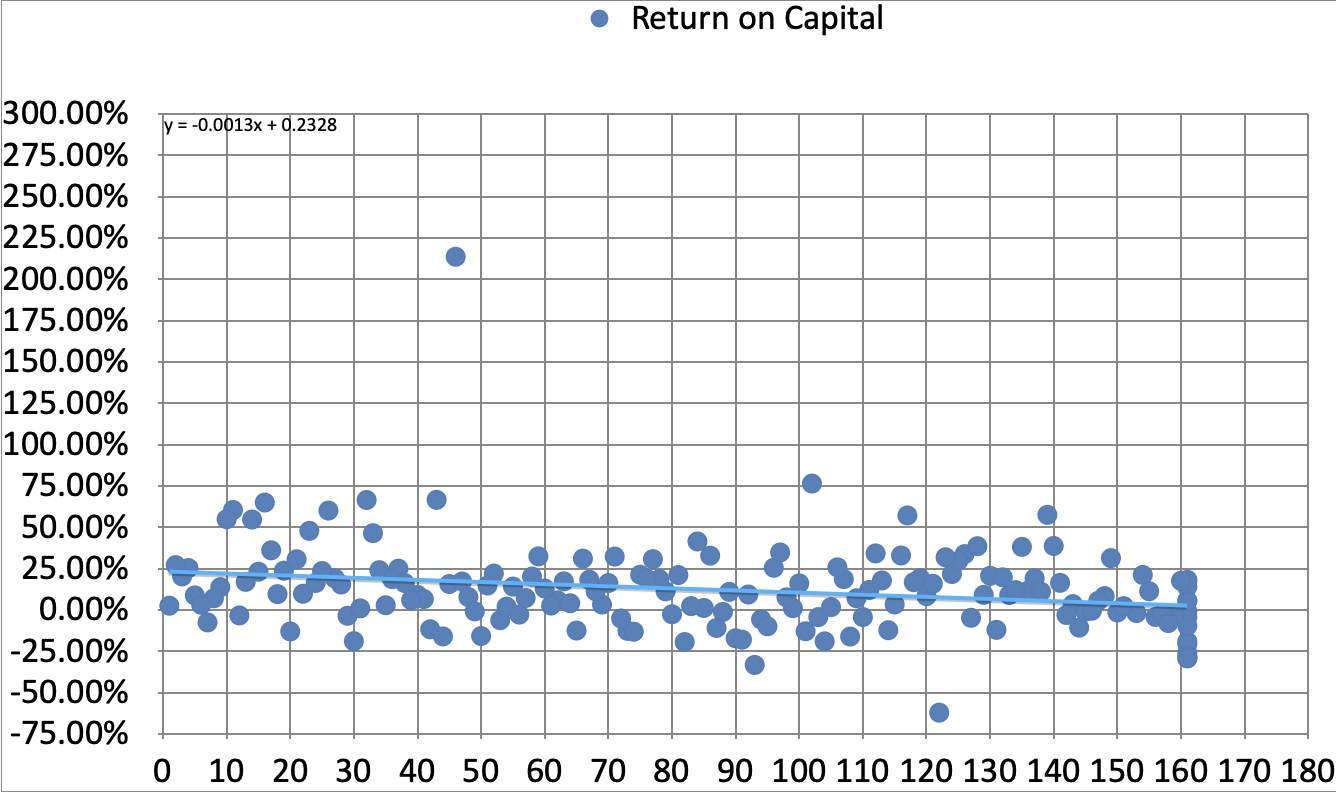
Similar to the free cash flow to total debt ratio chart, here we see a negative linear trendline that shows us a positive correlation between the return on total capital and total returns. The slope in this chart is equal to the slope in the free cash flow to total debt ratio chart, indicating that perhaps both factors provided an equally beneficial contribution to the high level 4 factor strategy. Here is another view, this time comparing the actual return on total capital values.
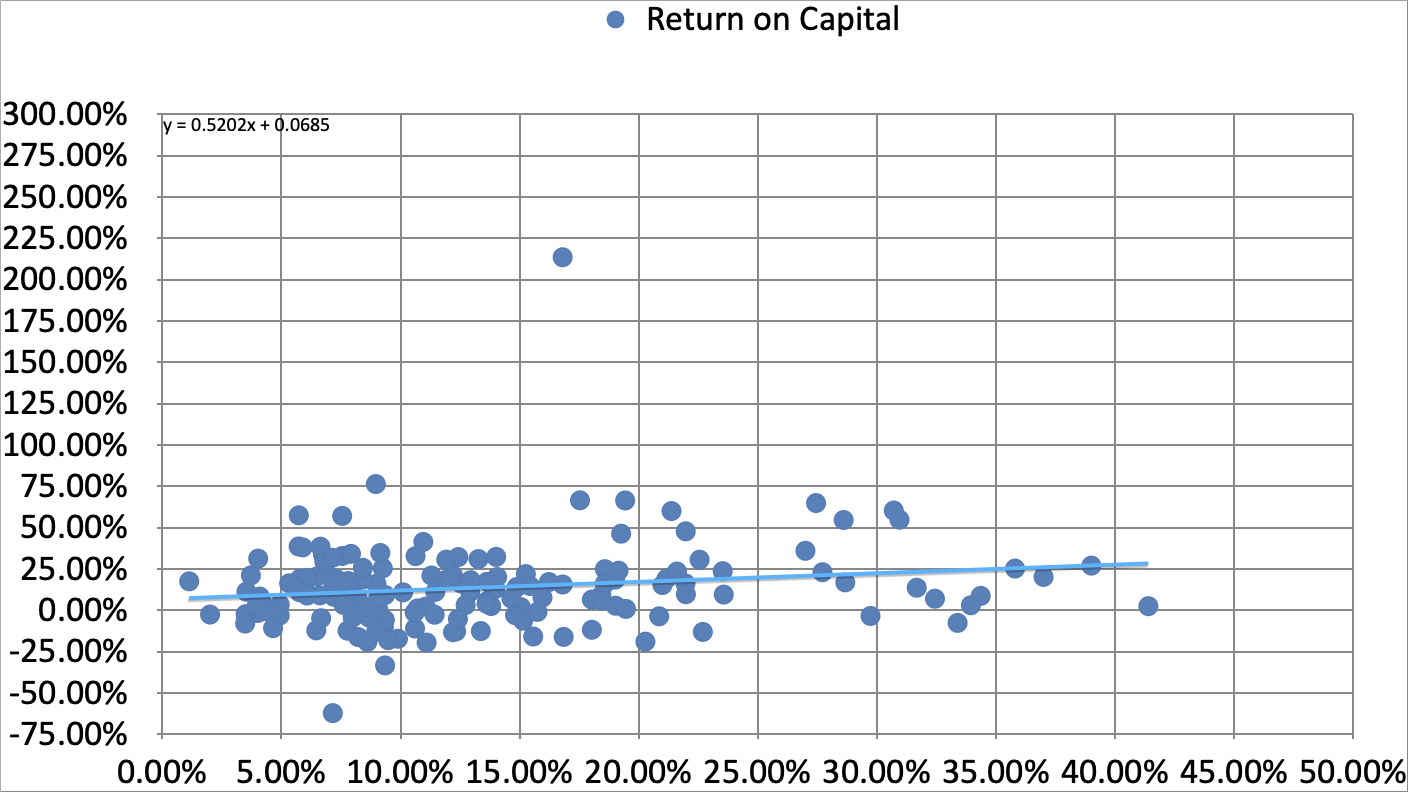
Finally a less clustered chart using actual values. We can observe that the few outliers with better than average returns on total capital have generally performed better than the entire universe in terms of total return. This is supported by the positive linear trendline and the positive slope in the linear equation.
The last factor is the forward dividend yield. Below is a scatter plot mapping the 8-month return against the original ranking of all 173 stocks.
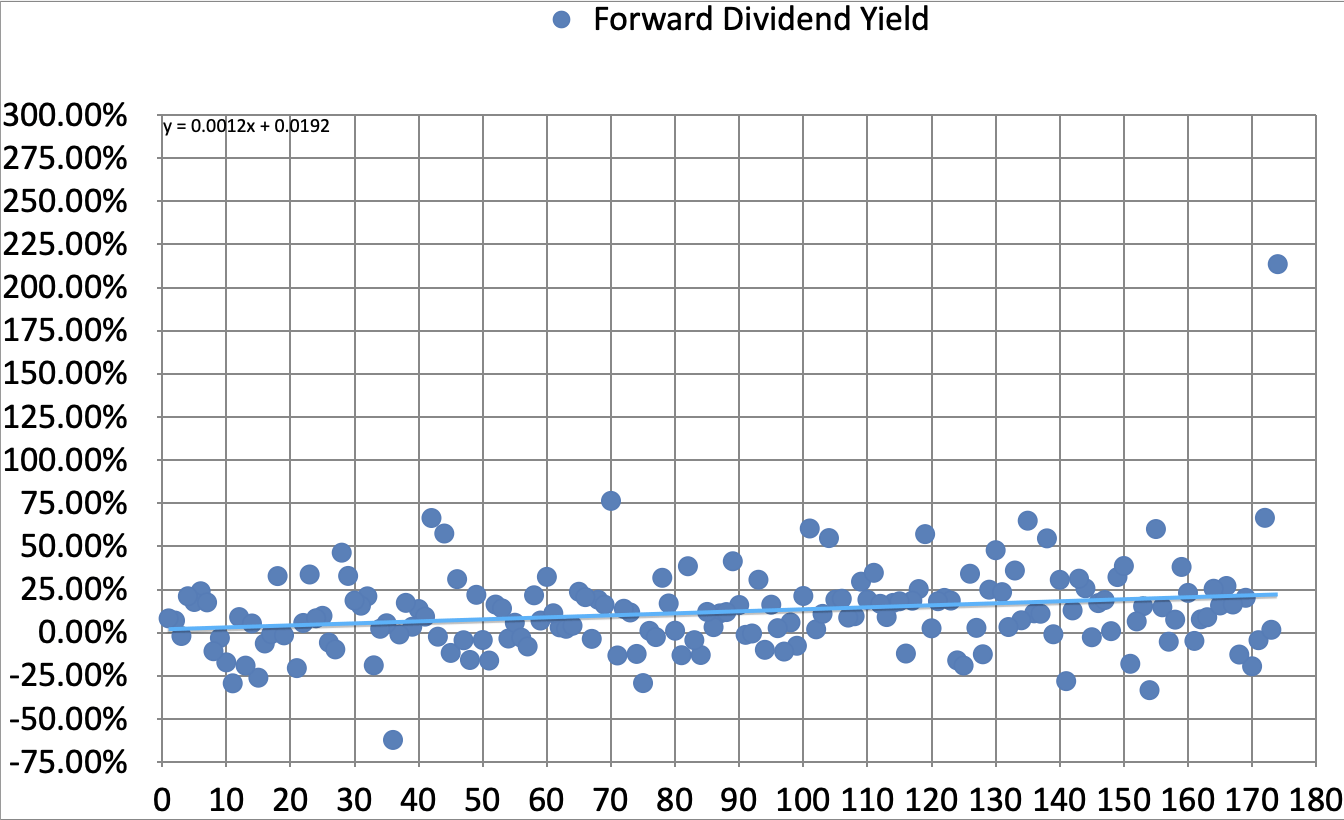
The linear trendline shows an evident positive slope indicating that the forward dividend yield is negatively correlated with total returns. Perhaps chasing yield truly isn't a smart strategy. The slope in the equation (+0.0012) is the highest of all 4 factors suggesting this may be the least useful of the 4 factors. Here is another view, this time comparing the actual forward dividend yield values.
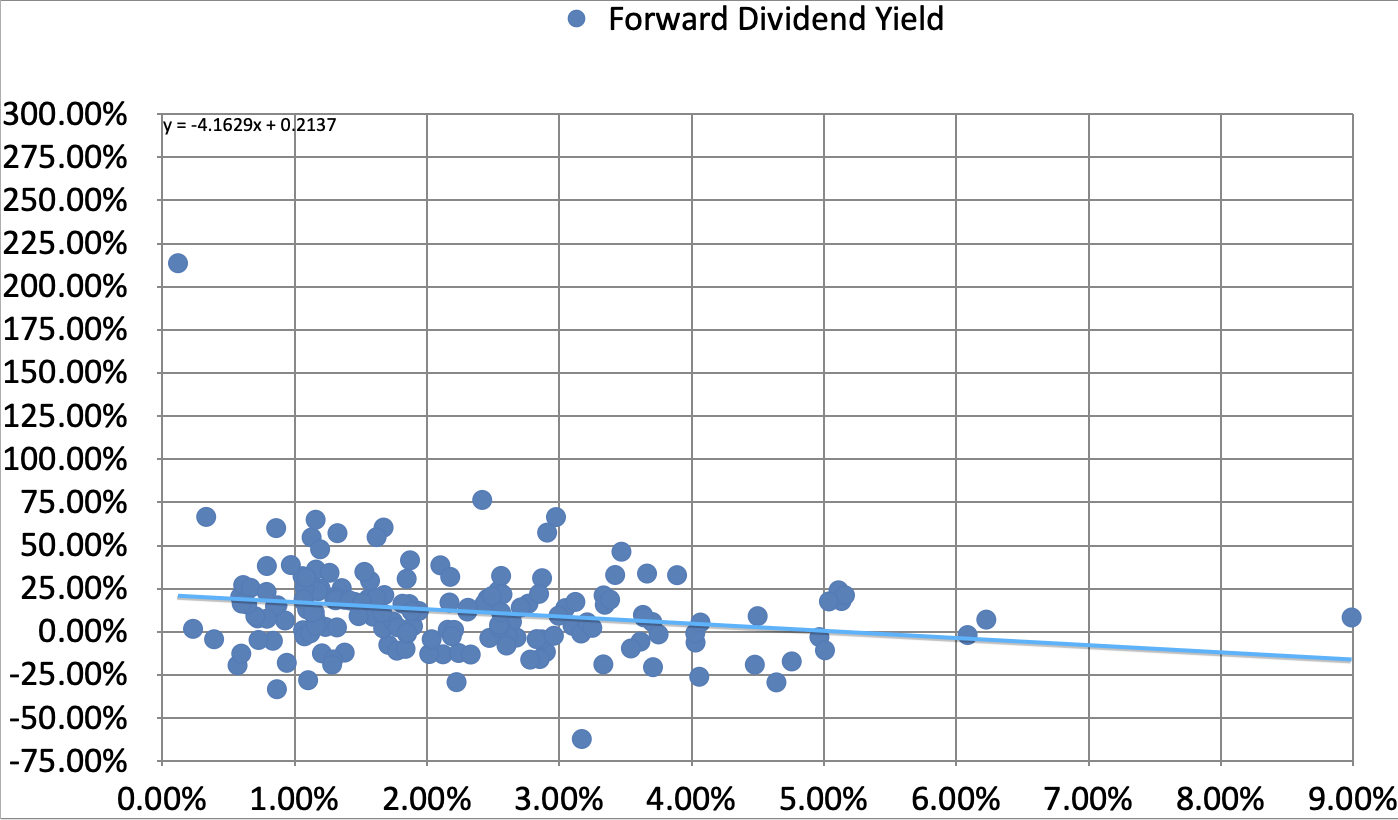
Again we have a less clustered chart that shows a clear pattern of higher yielding stocks seeing less favorable total returns. The slope in the equation is considerably higher than the other unfavorable factor (5 year dividend growth rate) supporting the conclusion made earlier that the forward dividend yield may be the weakest of the 4 factors.
Something to keep in mind here is that this analysis covers a very brief trading period of 8 months. These 8 months have also seen a shift in the market where growth stocks have seen more favorable returns than high yield stocks. The data points to the free cash flow to total debt ratio and the return on capital being clear winners. But this may not be the case in a year or two, or perhaps the gap may widen, time will tell.
Now that we have seen which factors have been more beneficial to the 4 factor strategy let's test if they would have actually led to more favorable returns. I tested each factor individually first, then all 2-factor and 3-factor combinations to see which ones would have led to better returns. All outcomes were compared to the actual returns for the live portfolio and the results were surprising.
Single Factor Return Analysis
Let's start with the free cash flow to total debt ratio. I sorted all 173 stocks based on how they ranked for this factor and I selected iterations of 5 stocks at a time moving from the top 5 through the top 30. I also tested the top half and bottom half of the stocks and compared all rolling returns to the actual live portfolio. The table below summarizes the results.
| Nov 22 |
| Dec 22 |
| Jan 23 |
| Feb 23 |
| Mar 23 |
| Apr 23 |
| May 23 |
| Jun 23 |
| Top 5 |
| 12.75% |
| 3.36% |
| 12.30% |
| 13.08% |
| 15.89% |
| 11.60% |
| 13.27% |
| 20.49% |
| Top 10 |
| 13.63% |
| 4.76% |
| 16.62% |
| 17.13% |
| 23.42% |
| 20.36% |
| 24.76% |
| 32.47% |
| Top 15 |
| 12.11% |
| 3.89% |
| 13.64% |
| 13.38% |
| 19.32% |
| 16.05% |
| 19.96% |
| 27.15% |
| Top 20 |
| 11.06% |
| 2.77% |
| 11.03% |
| 10.84% |
| 15.94% |
| 13.73% |
| 16.95% |
| 24.34% |
| Top 25 |
| 9.36% |
| 1.97% |
| 9.59% |
| 9.25% |
| 13.98% |
| 12.18% |
| 14.55% |
| 21.93% |
| Top 30 |
| 9.92% |
| 3.40% |
| 11.30% |
| 9.99% |
| 15.23% |
| 13.65% |
| 15.81% |
| 23.27% |
| Top Half |
| 8.59% |
| 3.49% |
| 9.14% |
| 7.16% |
| 10.33% |
| 9.57% |
| 8.88% |
| 17.41% |
| Bottom Half |
| 7.89% |
| 3.32% |
| 8.11% |
| 4.69% |
| 3.99% |
| 5.33% |
| 0.11% |
| 6.96% |
| 4 Factor Portfolio |
| 13.25% |
| 7.04% |
| 13.65% |
| 10.49% |
| 14.87% |
| 12.10% |
| 14.16% |
| 19.88% |
At the onset only the top 10 stocks based on this factor performed better than the 4 factor portfolio, this outperformance extended through January 2023. Starting in February 2023 the top 5 through the top 20 selected stocks all moved ahead of the 4 factor portfolio in terms of rolling returns. In March 2023 the top 30 selected stocks joined the list of out performers. In April 2023 the top 5 stocks fell behind the 4 factor portfolio, but the top 10 through the top 30 stocks were all outpacing it. The same trend extended through May. In June 2023 the top 5 through the top 30 stocks all generated returns that were better than the actual portfolio. These are very favorable results indicating that the free cash flow to total debt ratio was a very good indicator of strong returns. The top half of all 173 stocks did not perform better than the actual portfolio but they still generated a strong return of 17.41% in this 8 month test window. The top half also performed considerably better than the bottom half of stocks that only mustered a return of 6.96%.
The next factor on the list is the 5 year dividend growth rate. The same test was applied for this factor and the table below summarizes the results.
| Nov 22 |
| Dec 22 |
| Jan 23 |
| Feb 23 |
| Mar 23 |
| Apr 23 |
| May 23 |
| Jun 23 |
| Top 5 |
| 7.40% |
| 1.36% |
| 11.23% |
| 5.78% |
| 4.97% |
| 3.49% |
| 2.50% |
| 5.99% |
| Top 10 |
| 8.43% |
| 2.06% |
| 13.31% |
| 12.71% |
| 12.19% |
| 7.70% |
| 5.67% |
| 10.58% |
| Top 15 |
| 8.40% |
| 2.87% |
| 11.53% |
| 10.39% |
| 7.91% |
| 5.73% |
| 4.26% |
| 9.56% |
| Top 20 |
| 10.02% |
| 3.77% |
| 13.32% |
| 12.12% |
| 10.08% |
| 7.96% |
| 7.11% |
| 14.16% |
| Top 25 |
| 9.80% |
| 3.69% |
| 12.41% |
| 9.84% |
| 9.25% |
| 7.01% |
| 5.60% |
| 13.41% |
| Top 30 |
| 9.29% |
| 3.49% |
| 10.99% |
| 8.42% |
| 7.78% |
| 5.76% |
| 3.96% |
| 11.00% |
| Top Half |
| 8.68% |
| 3.76% |
| 9.08% |
| 5.58% |
| 6.59% |
| 6.50% |
| 3.97% |
| 11.43% |
| Bottom Half |
| 7.80% |
| 3.05% |
| 8.17% |
| 6.25% |
| 7.69% |
| 8.36% |
| 4.96% |
| 12.87% |
| 4 Factor Portfolio |
| 13.25% |
| 7.04% |
| 13.65% |
| 10.49% |
| 14.87% |
| 12.10% |
| 14.16% |
| 19.88% |
There were only two instances where this factor was able to generate a rolling return more favorable than the actual portfolio. Through February 2023, the top 10 and top 20 selected stocks generated a total return about 2% higher than the actual portfolio. However looking at the full 8 month returns none of the selected iterations of stocks were able to generate a return that was even close to the actual portfolio. This data supports the regression analysis that indicated this factor was not a useful indicator of future return.
The next factor on the list is the return on total capital. The same test was applied for this factor and the table below summarizes the results.
| Nov 22 |
| Dec 22 |
| Jan 23 |
| Feb 23 |
| Mar 23 |
| Apr 23 |
| May 23 |
| Jun 23 |
| Top 5 |
| 9.88% |
| 0.67% |
| 7.76% |
| 2.57% |
| 6.37% |
| 7.97% |
| 5.48% |
| 16.78% |
| Top 10 |
| 11.39% |
| 2.63% |
| 9.23% |
| 3.88% |
| 7.93% |
| 6.30% |
| 6.20% |
| 15.51% |
| Top 15 |
| 12.25% |
| 3.58% |
| 11.73% |
| 6.64% |
| 11.30% |
| 9.78% |
| 11.63% |
| 20.45% |
| Top 20 |
| 11.65% |
| 2.39% |
| 10.37% |
| 7.20% |
| 11.72% |
| 9.52% |
| 12.27% |
| 21.40% |
| Top 25 |
| 11.11% |
| 2.93% |
| 9.43% |
| 6.17% |
| 11.25% |
| 10.60% |
| 13.18% |
| 22.24% |
| Top 30 |
| 10.36% |
| 3.12% |
| 9.22% |
| 6.70% |
| 11.39% |
| 10.35% |
| 12.08% |
| 20.94% |
| Top Half |
| 9.34% |
| 3.64% |
| 9.24% |
| 7.38% |
| 10.32% |
| 10.04% |
| 9.09% |
| 17.66% |
| Bottom Half |
| 7.14% |
| 3.17% |
| 8.01% |
| 4.47% |
| 3.99% |
| 4.85% |
| -0.10% |
| 6.72% |
| 4 Factor Portfolio |
| 13.25% |
| 7.04% |
| 13.65% |
| 10.49% |
| 14.87% |
| 12.10% |
| 14.16% |
| 19.88% |
The results here are interesting because it wasn't until June of 2023 that any of the tested iterations was able to generate a better return compared to the actual portfolio. The top 15 through the top 30 stocks all saw very favorable returns during the month of June that pushed each combination of stocks ahead of the actual portfolio. While this supports the regression analysis that suggested the return on total capital was a good indicator of total return, the results from this test are not as favorable as for the free cash flow to total debt ratio. If you recall the regression analysis suggested that both these factors potentially played an equal role in the 4 factor screening process. Based on the single factor analysis we can deduce that the free cash flow to total debt ratio was the superior factor out of these two.
The last factor is the forward dividend yield. The same test was applied to this factor and the table below summarizes the results.
| Nov 22 |
| Dec 22 |
| Jan 23 |
| Feb 23 |
| Mar 23 |
| Apr 23 |
| May 23 |
| Jun 23 |
| Top 5 |
| 8.70% |
| 3.73% |
| 12.27% |
| 6.51% |
| 9.92% |
| 9.92% |
| 3.01% |
| 10.48% |
| Top 10 |
| 9.33% |
| 2.17% |
| 13.31% |
| 6.31% |
| 7.50% |
| 8.35% |
| -1.62% |
| 6.30% |
| Top 15 |
| 8.90% |
| 1.48% |
| 12.47% |
| 6.92% |
| 1.92% |
| 2.27% |
| -6.77% |
| 0.20% |
| Top 20 |
| 8.97% |
| 2.66% |
| 11.64% |
| 6.84% |
| 2.26% |
| 2.38% |
| -5.88% |
| 0.33% |
| Top 25 |
| 9.29% |
| 3.14% |
| 11.29% |
| 7.34% |
| 3.78% |
| 3.91% |
| -3.69% |
| 2.34% |
| Top 30 |
| 9.25% |
| 3.76% |
| 12.21% |
| 8.54% |
| 5.68% |
| 5.61% |
| -0.73% |
| 5.41% |
| Top Half |
| 8.46% |
| 3.69% |
| 9.33% |
| 5.68% |
| 5.49% |
| 5.77% |
| 0.53% |
| 6.81% |
| Bottom Half |
| 8.02% |
| 3.13% |
| 7.92% |
| 6.15% |
| 8.78% |
| 9.08% |
| 8.36% |
| 17.44% |
| 4 Factor Portfolio |
| 13.25% |
| 7.04% |
| 13.65% |
| 10.49% |
| 14.87% |
| 12.10% |
| 14.16% |
| 19.88% |
We can see that at no point in time was this factor able to outperform the actual portfolio. This supports the initial assumption that perhaps the forward dividend yield is the least beneficial factor. The final June returns for all tested iterations points to the lowest-yielding stocks generating the best total returns.
To sum up the single factor analysis here is how all factors rank.
- Free Cash Flow to Total Debt Ratio.
- Return on Total Capital.
- 5 Year Dividend Growth Rate.
- Forward Dividend Yield.
After completing the single factor analysis I wanted to see if any combination of 2 or 3 factors would be able to provide superior results compared to the actual portfolio. The results of this analysis are summarized in the next section.
Multi-Factor Return Analysis
In the multi factor analysis I first combined each combination of 2 factors together and sorted all 173 stocks in ascending order. The tables below summarize the results for all 6 2-factor combinations.
| FCF to Debt & 5 Year DGR |
| Nov 22 |
| Dec 22 |
| Jan 23 |
| Feb 23 |
| Mar 23 |
| Apr 23 |
| May 23 |
| Jun 23 |
| Top 5 |
| 6.38% |
| -1.33% |
| 8.51% |
| 3.78% |
| -2.31% |
| -3.82% |
| -6.65% |
| 0.37% |
| Top 10 |
| 8.60% |
| 2.89% |
| 10.70% |
| 6.80% |
| 3.46% |
| 2.49% |
| -3.71% |
| 3.31% |
| Top 15 |
| 10.63% |
| 4.06% |
| 13.51% |
| 9.35% |
| 6.96% |
| 7.11% |
| -0.39% |
| 7.10% |
| Top 20 |
| 8.62% |
| 2.31% |
| 10.80% |
| 6.74% |
| 4.45% |
| 4.55% |
| -3.23% |
| 3.22% |
| Top 25 |
| 8.49% |
| 2.22% |
| 9.85% |
| 6.20% |
| 3.20% |
| 3.62% |
| -4.06% |
| 2.76% |
| Top 30 |
| 7.99% |
| 2.52% |
| 10.10% |
| 6.49% |
| 3.74% |
| 4.36% |
| -2.27% |
| 5.21% |
| Top Half |
| 7.24% |
| 2.60% |
| 7.14% |
| 4.12% |
| 3.38% |
| 3.86% |
| -1.33% |
| 5.57% |
| Bottom Half |
| 9.22% |
| 4.20% |
| 10.09% |
| 7.70% |
| 10.86% |
| 10.96% |
| 10.20% |
| 18.66% |
| 4 Factor Portfolio |
| 13.25% |
| 7.04% |
| 13.65% |
| 10.49% |
| 14.87% |
| 12.10% |
| 14.16% |
| 19.88% |
| FCF to Debt & Return on Capital |
| Nov 22 |
| Dec 22 |
| Jan 23 |
| Feb 23 |
| Mar 23 |
| Apr 23 |
| May 23 |
| Jun 23 |
| Top 5 |
| 8.12% |
| 4.16% |
| 8.58% |
| 2.33% |
| 0.43% |
| 0.91% |
| -2.00% |
| 4.70% |
| Top 10 |
| 7.22% |
| 1.62% |
| 9.45% |
| 5.14% |
| 1.58% |
| 3.04% |
| -6.47% |
| 0.27% |
| Top 15 |
| 10.66% |
| 3.93% |
| 13.85% |
| 8.72% |
| 7.22% |
| 5.62% |
| -0.38% |
| 7.00% |
| Top 20 |
| 8.90% |
| 2.68% |
| 12.68% |
| 8.44% |
| 6.15% |
| 5.58% |
| -1.28% |
| 5.61% |
| Top 25 |
| 8.91% |
| 2.87% |
| 10.79% |
| 7.04% |
| 6.07% |
| 5.33% |
| -0.55% |
| 5.90% |
| Top 30 |
| 8.85% |
| 3.08% |
| 11.16% |
| 7.50% |
| 6.65% |
| 5.61% |
| 0.05% |
| 6.84% |
| Top Half |
| 8.04% |
| 3.36% |
| 8.38% |
| 4.38% |
| 3.88% |
| 4.00% |
| -1.17% |
| 4.96% |
| Bottom Half |
| 8.43% |
| 3.44% |
| 8.86% |
| 7.43% |
| 10.36% |
| 10.82% |
| 10.04% |
| 19.27% |
| 4 Factor Portfolio |
| 13.25% |
| 7.04% |
| 13.65% |
| 10.49% |
| 14.87% |
| 12.10% |
| 14.16% |
| 19.88% |
| FCF to Debt & Forward Yield |
| Nov 22 |
| Dec 22 |
| Jan 23 |
| Feb 23 |
| Mar 23 |
| Apr 23 |
| May 23 |
| Jun 23 |
| Top 5 |
| 9.21% |
| 5.36% |
| 15.54% |
| 12.34% |
| 5.50% |
| 3.98% |
| -1.73% |
| 3.90% |
| Top 10 |
| 7.72% |
| 3.38% |
| 10.48% |
| 6.41% |
| 3.79% |
| 5.19% |
| -1.44% |
| 3.33% |
| Top 15 |
| 10.57% |
| 5.00% |
| 12.04% |
| 8.40% |
| 7.17% |
| 7.33% |
| 2.49% |
| 8.06% |
| Top 20 |
| 11.06% |
| 5.97% |
| 14.59% |
| 11.15% |
| 10.80% |
| 11.42% |
| 5.11% |
| 11.00% |
| Top 25 |
| 9.71% |
| 5.12% |
| 12.45% |
| 8.91% |
| 8.53% |
| 9.33% |
| 3.04% |
| 8.72% |
| Top 30 |
| 9.85% |
| 5.09% |
| 12.69% |
| 9.29% |
| 8.35% |
| 9.42% |
| 2.44% |
| 8.74% |
| Top Half |
| 8.68% |
| 4.47% |
| 10.76% |
| 7.05% |
| 7.78% |
| 8.32% |
| 3.67% |
| 10.37% |
| Bottom Half |
| 7.80% |
| 2.35% |
| 6.51% |
| 4.79% |
| 6.51% |
| 6.55% |
| 5.26% |
| 13.92% |
| 4 Factor Portfolio |
| 13.25% |
| 7.04% |
| 13.65% |
| 10.49% |
| 14.87% |
| 12.10% |
| 14.16% |
| 19.88% |
| 5 Year DGR and Return on Capital |
| Nov 22 |
| Dec 22 |
| Jan 23 |
| Feb 23 |
| Mar 23 |
| Apr 23 |
| May 23 |
| Jun 23 |
| Top 5 |
| 9.50% |
| 2.22% |
| 6.03% |
| -0.59% |
| 6.33% |
| 4.96% |
| 1.80% |
| 8.83% |
| Top 10 |
| 8.96% |
| 3.57% |
| 7.30% |
| 3.73% |
| 1.63% |
| 0.24% |
| -5.53% |
| 0.56% |
| Top 15 |
| 9.20% |
| 4.14% |
| 9.09% |
| 6.70% |
| 5.59% |
| 3.67% |
| -0.93% |
| 5.28% |
| Top 20 |
| 8.66% |
| 3.46% |
| 9.25% |
| 7.37% |
| 5.12% |
| 4.58% |
| -0.50% |
| 5.93% |
| Top 25 |
| 8.97% |
| 3.20% |
| 9.79% |
| 7.03% |
| 5.41% |
| 5.12% |
| -1.19% |
| 5.29% |
| Top 30 |
| 9.01% |
| 3.28% |
| 9.05% |
| 5.88% |
| 4.53% |
| 4.32% |
| -1.26% |
| 4.55% |
| Top Half |
| 7.61% |
| 2.77% |
| 8.19% |
| 4.88% |
| 3.84% |
| 4.83% |
| -0.25% |
| 6.71% |
| Bottom Half |
| 8.86% |
| 4.03% |
| 9.05% |
| 6.94% |
| 10.41% |
| 10.01% |
| 9.14% |
| 17.54% |
| 4 Factor Portfolio |
| 13.25% |
| 7.04% |
| 13.65% |
| 10.49% |
| 14.87% |
| 12.10% |
| 14.16% |
| 19.88% |
| 5 Year DGR and Forward Yield |
| Nov 22 |
| Dec 22 |
| Jan 23 |
| Feb 23 |
| Mar 23 |
| Apr 23 |
| May 23 |
| Jun 23 |
| Top 5 |
| 7.37% |
| 2.66% |
| 4.32% |
| 4.50% |
| 8.06% |
| 11.44% |
| 7.19% |
| 19.29% |
| Top 10 |
| 6.30% |
| 2.08% |
| 6.48% |
| 5.83% |
| 6.40% |
| 8.56% |
| 3.88% |
| 12.84% |
| Top 15 |
| 7.29% |
| 3.38% |
| 8.27% |
| 6.34% |
| 6.88% |
| 8.03% |
| 1.99% |
| 10.93% |
| Top 20 |
| 7.95% |
| 3.66% |
| 8.10% |
| 6.84% |
| 7.51% |
| 7.46% |
| 2.07% |
| 10.33% |
| Top 25 |
| 8.22% |
| 4.55% |
| 8.86% |
| 6.64% |
| 8.02% |
| 7.99% |
| 3.35% |
| 11.17% |
| Top 30 |
| 7.64% |
| 3.82% |
| 8.55% |
| 6.51% |
| 7.53% |
| 7.55% |
| 2.36% |
| 9.75% |
| Top Half |
| 8.85% |
| 4.15% |
| 10.46% |
| 7.55% |
| 7.58% |
| 8.11% |
| 4.39% |
| 11.91% |
| Bottom Half |
| 7.63% |
| 2.67% |
| 6.81% |
| 4.31% |
| 6.70% |
| 6.77% |
| 4.54% |
| 12.40% |
| 4 Factor Portfolio |
| 13.25% |
| 7.04% |
| 13.65% |
| 10.49% |
| 14.87% |
| 12.10% |
| 14.16% |
| 19.88% |
| Return on Capital and Forward Yield |
| Nov 22 |
| Dec 22 |
| Jan 23 |
| Feb 23 |
| Mar 23 |
| Apr 23 |
| May 23 |
| Jun 23 |
| Top 5 |
| 7.46% |
| 1.55% |
| 10.00% |
| 6.05% |
| 3.89% |
| 7.15% |
| -1.85% |
| 3.21% |
| Top 10 |
| 7.61% |
| 2.81% |
| 7.93% |
| 5.57% |
| 5.95% |
| 7.54% |
| -0.98% |
| 4.83% |
| Top 15 |
| 9.25% |
| 3.82% |
| 10.47% |
| 7.64% |
| 6.22% |
| 4.40% |
| -1.51% |
| 4.18% |
| Top 20 |
| 10.16% |
| 5.20% |
| 12.60% |
| 9.91% |
| 9.45% |
| 7.89% |
| 2.74% |
| 8.78% |
| Top 25 |
| 10.07% |
| 4.82% |
| 14.22% |
| 10.65% |
| 10.76% |
| 10.67% |
| 3.42% |
| 9.83% |
| Top 30 |
| 10.37% |
| 4.55% |
| 13.30% |
| 9.14% |
| 10.60% |
| 10.59% |
| 3.99% |
| 9.79% |
| Top Half |
| 8.98% |
| 4.39% |
| 11.12% |
| 7.63% |
| 9.05% |
| 9.46% |
| 4.82% |
| 11.50% |
| Bottom Half |
| 7.50% |
| 2.43% |
| 6.15% |
| 4.22% |
| 5.25% |
| 5.43% |
| 4.12% |
| 12.81% |
| 4 Factor Portfolio |
| 13.25% |
| 7.04% |
| 13.65% |
| 10.49% |
| 14.87% |
| 12.10% |
| 14.16% |
| 19.88% |
Suffice it to say the results in each of the tables above are pretty poor. None of the combinations was able to consistently outperform the actual portfolio and in several instances the bottom half of the selected stocks turned out to be the best-performing stocks. The 2-factor analysis was a failure, it is time to move on and test the 4 3-factor combinations to see if they can fare better.
| 4 Factor ex Forward Yield |
| Nov 22 |
| Dec 22 |
| Jan 23 |
| Feb 23 |
| Mar 23 |
| Apr 23 |
| May 23 |
| Jun 23 |
| Top 5 |
| 8.21% |
| 0.78% |
| 10.62% |
| 4.55% |
| -2.08% |
| -2.96% |
| -8.27% |
| 0.12% |
| Top 10 |
| 8.13% |
| 0.43% |
| 10.78% |
| 7.10% |
| 4.31% |
| 4.03% |
| -5.83% |
| 0.76% |
| Top 15 |
| 9.95% |
| 3.45% |
| 12.70% |
| 9.00% |
| 6.98% |
| 6.87% |
| 0.23% |
| 7.57% |
| Top 20 |
| 8.12% |
| 2.64% |
| 11.14% |
| 7.34% |
| 5.46% |
| 5.80% |
| -1.66% |
| 4.93% |
| Top 25 |
| 8.46% |
| 2.98% |
| 10.58% |
| 6.96% |
| 4.23% |
| 4.31% |
| -3.01% |
| 2.79% |
| Top 30 |
| 8.90% |
| 3.28% |
| 10.45% |
| 6.31% |
| 4.50% |
| 4.10% |
| -2.24% |
| 3.35% |
| Top Half |
| 7.61% |
| 2.66% |
| 7.60% |
| 4.09% |
| 3.68% |
| 4.22% |
| -0.81% |
| 5.54% |
| Bottom Half |
| 8.86% |
| 4.14% |
| 9.63% |
| 7.73% |
| 10.56% |
| 10.61% |
| 9.69% |
| 18.70% |
| 4 Factor Portfolio |
| 13.25% |
| 7.04% |
| 13.65% |
| 10.49% |
| 14.87% |
| 12.10% |
| 14.16% |
| 19.88% |
| 4 Factor ex Return on Capital |
| Nov 22 |
| Dec 22 |
| Jan 23 |
| Feb 23 |
| Mar 23 |
| Apr 23 |
| May 23 |
| Jun 23 |
| Top 5 |
| 10.80% |
| 5.66% |
| 14.31% |
| 9.90% |
| 8.09% |
| 9.14% |
| 0.87% |
| 8.06% |
| Top 10 |
| 10.41% |
| 4.76% |
| 15.49% |
| 10.11% |
| 10.97% |
| 11.67% |
| 2.34% |
| 10.39% |
| Top 15 |
| 8.66% |
| 2.08% |
| 12.72% |
| 7.36% |
| 2.70% |
| 3.63% |
| -4.34% |
| 2.84% |
| Top 20 |
| 8.34% |
| 3.10% |
| 12.53% |
| 7.73% |
| 3.69% |
| 4.31% |
| -3.59% |
| 3.89% |
| Top 25 |
| 8.20% |
| 2.99% |
| 11.96% |
| 7.90% |
| 3.05% |
| 3.81% |
| -4.37% |
| 2.80% |
| Top 30 |
| 8.05% |
| 3.77% |
| 11.04% |
| 7.18% |
| 3.62% |
| 4.86% |
| -2.54% |
| 4.14% |
| Top Half |
| 8.76% |
| 3.98% |
| 9.75% |
| 6.53% |
| 6.86% |
| 7.20% |
| 2.68% |
| 9.60% |
| Bottom Half |
| 7.72% |
| 2.83% |
| 7.51% |
| 5.31% |
| 7.42% |
| 7.67% |
| 6.24% |
| 14.68% |
| 4 Factor Portfolio |
| 13.25% |
| 7.04% |
| 13.65% |
| 10.49% |
| 14.87% |
| 12.10% |
| 14.16% |
| 19.88% |
| 4 Factor ex 5 Year DGR |
| Nov 22 |
| Dec 22 |
| Jan 23 |
| Feb 23 |
| Mar 23 |
| Apr 23 |
| May 23 |
| Jun 23 |
| Top 5 |
| 5.72% |
| 0.59% |
| 9.80% |
| 5.73% |
| -2.77% |
| -0.37% |
| -8.15% |
| -3.58% |
| Top 10 |
| 8.72% |
| 2.28% |
| 12.23% |
| 7.15% |
| 4.76% |
| 5.04% |
| -4.62% |
| 0.82% |
| Top 15 |
| 9.93% |
| 4.20% |
| 15.42% |
| 11.27% |
| 9.36% |
| 9.85% |
| 0.51% |
| 7.47% |
| Top 20 |
| 9.43% |
| 3.72% |
| 12.59% |
| 8.18% |
| 9.16% |
| 8.51% |
| 1.72% |
| 7.75% |
| Top 25 |
| 8.72% |
| 3.34% |
| 10.41% |
| 6.33% |
| 7.26% |
| 6.96% |
| 0.05% |
| 5.45% |
| Top 30 |
| 10.13% |
| 4.40% |
| 12.69% |
| 8.15% |
| 8.75% |
| 8.38% |
| 2.75% |
| 8.29% |
| Top Half |
| 8.83% |
| 4.07% |
| 9.68% |
| 5.87% |
| 5.96% |
| 6.32% |
| 1.41% |
| 8.00% |
| Bottom Half |
| 7.65% |
| 2.75% |
| 7.58% |
| 5.97% |
| 8.31% |
| 8.54% |
| 7.49% |
| 16.26% |
| 4 Factor Portfolio |
| 13.25% |
| 7.04% |
| 13.65% |
| 10.49% |
| 14.87% |
| 12.10% |
| 14.16% |
| 19.88% |
| 4 Factor ex FCF to Debt |
| Nov 22 |
| Dec 22 |
| Jan 23 |
| Feb 23 |
| Mar 23 |
| Apr 23 |
| May 23 |
| Jun 23 |
| Top 5 |
| 6.69% |
| 3.51% |
| 4.12% |
| 1.90% |
| 1.96% |
| 2.41% |
| -6.07% |
| -1.99% |
| Top 10 |
| 9.17% |
| 3.63% |
| 8.41% |
| 3.89% |
| 5.54% |
| 5.81% |
| -1.63% |
| 3.62% |
| Top 15 |
| 9.78% |
| 4.61% |
| 10.09% |
| 4.83% |
| 5.44% |
| 6.07% |
| -0.58% |
| 5.55% |
| Top 20 |
| 10.09% |
| 4.68% |
| 11.46% |
| 6.50% |
| 7.86% |
| 8.77% |
| 1.28% |
| 6.81% |
| Top 25 |
| 9.57% |
| 4.06% |
| 11.83% |
| 7.67% |
| 7.17% |
| 7.50% |
| 0.20% |
| 6.27% |
| Top 30 |
| 9.26% |
| 3.86% |
| 12.01% |
| 8.07% |
| 6.14% |
| 6.19% |
| -0.69% |
| 5.78% |
| Top Half |
| 8.22% |
| 3.64% |
| 9.23% |
| 5.94% |
| 5.66% |
| 5.94% |
| 1.13% |
| 7.60% |
| Bottom Half |
| 8.25% |
| 3.17% |
| 8.02% |
| 5.90% |
| 8.60% |
| 8.91% |
| 7.77% |
| 16.66% |
| 4 Factor Portfolio |
| 13.25% |
| 7.04% |
| 13.65% |
| 10.49% |
| 14.87% |
| 12.10% |
| 14.16% |
| 19.88% |
The results here are bleak as well with only 4 of the rolling returns at one point outperforming the actual portfolio. Looking at the June 2023 total return, each 3-factor combination saw the bottom half of all stocks perform the best. Neither the 2-factor nor the 3-factor combinations proved to be beneficial.
Final Thoughts
It appears that the 4 factors chosen by the Dow Jones US Dividend 100 Index are a tough combination to beat. And perhaps they are combined for a reason. The only positive outcome from this analysis was that the free cash flow to total debt ratio and the return on capital, used alone, would have led to improved returns. The key observation that can be made here is that the 2 factors related to the business itself appear to be more useful than the 2 factors related to the dividend. While SCHD is a dividend focused ETF it's not surprising that its selection criteria includes dividend metrics but perhaps its historical success is more attributable to identifying companies with financial liquidity and attractive business growth.
If you've stayed with me to this point you may be wondering how you can use this information to benefit your investing strategy. Well, if you are intrigued by this strategy and would like to create a similar process for yourself, I would recommend focusing on metrics that are related to the growth of a business in favor of dividend metrics. While dividend metrics are necessary if your goal is to create a dividend portfolio, in the long run how the underlying business performs will matter significantly more than its dividend yield or dividend growth rate. If you are able to accurately identify, invest and hold onto great businesses that continue to grow at a healthy pace, it's likely that you will be satisfied with their dividend stream and growth as well.
Based on this data and my prior observations discussed in previous updates for this strategy, I will not be making major deviations from my original strategy. I will continue to use all 4 factors in the stock selection process. If you happened to reach my most recent update, I did mention that I will likely trim the number of chosen stocks from 30 to 20 and also adopt an equal weight allocation to all chosen stocks. What I am still considering is to rebalance the portfolio on a monthly or quarterly basis. I need to evaluate more data before I adopt a rebalancing schedule, but I only have a few more months to make up my mind.
Here are the top 10 best performing stocks from the original universe along with their original 4 factor rank.
- Nvidia ( NVDA ) +213.59% ranked 139.
- NetEase ( NTES ) +76.40% ranked 40.
- West Pharma ( WST ) +66.57% ranked 98.
- Taiwan Semiconductor (TSM) +66.47% ranked 11.
- Applied Materials ( AMAT ) +64.93% ranked 13.
- Lam Research (LRCX) +60.40% ranked 4.
- Monolithic Power Systems ( MPWR ) +60.08% ranked 15.
- FedEx (FDX) +57.48% ranked 66.
- CRH plc ( CRH ) +57.14% ranked 130.
- KLA Corporation ( KLAC ) +54.85% ranked 18.
For further details see:
4 Factor Dividend Growth Portfolio - Deep Dive Analysis