ADDDF - 4 Reasons It's Time To Get Greedy On adidas
Summary
- adidas could generate about 5.2X faster real income growth than the S&P 500 and 18X faster income growth than a 60/40.
- adidas's payout ratio policy is 40% to 50%, and it's expected to bring that down from 50% this year to 30% by 2026.
- adidas is a world-beater hyper-growth dividend blue-chip that could deliver about 3.5X returns, not over the next 10 years, but the next five years.
This article was coproduced with Dividend Sensei.
On Friday, August 27th, Jerome Powell gave the most hawkish speech of his career and became a fire-breathing dragon that torched Wall Street's delusional dreams of a fast-fed pivot.
After two months in which the speculative mania stocks of the Pandemic, like Carvana, doubled in price in hopes of fast-fed cuts, stocks crashed 4% in hours.
Why?
Because Powell told the cold, unvarnished, and hard truth, unlike what he did in his infamous 2021 "inflation is transitory" speech .
What were the three most important takeaways from Powell's "fire-breathing" Jackson Hole speech?
-
high inflation is the enemy of a healthy economy and strong job market in the long-term
-
the Fed is 100% committed to returning inflation to 2% and is willing to raise unemployment and slow growth for several years to do it
-
the Fed will not start cutting until the job is done.
The Fed might keep rates at 3.75% for up to 18 to 24 months, according to Atlanta Fed president Raphael Bostic, and that's a very different world than the one in which owning speculative growth darlings like Carvana, Zoom, or meme stocks makes sense.
But do you know what works well in a high-rate world?
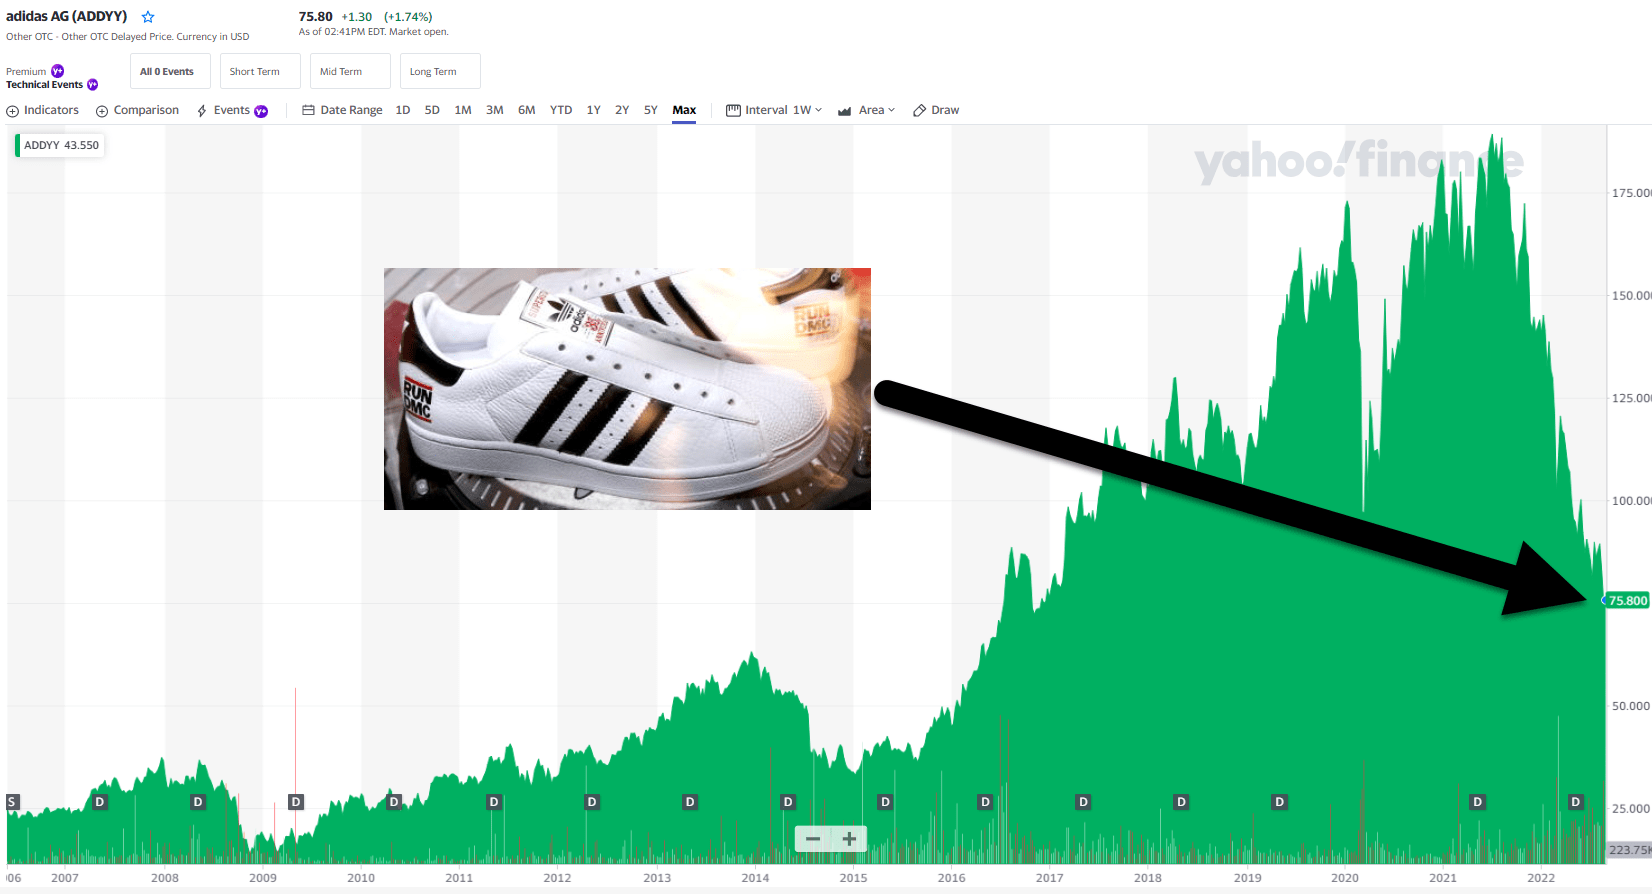
Buying the world's best dividend growth blue-chips, like adidas AG ( ADDYY , [[ADDDF]]) (" adidas"), which fell 7% the day of Powell's speech.
-
down 62% from its all-time high
-
one of the best buying opportunities in ADDYY history
Let me show you why adidas, trading at just 9.9X cash-adjusted earnings, and growing at 17%, is one of the best Buffett-style blue-chip bargains you should consider buying today.
Reason One: adidas Is The Complete Dividend Growth Package
Here's the bottom line on adidas.
-
What You Need To Know About Foreign Dividend Withholding Taxes
-
adidas is a German company, so U.S. investors face 26.375% dividend withholding taxes on their shares
-
a tax credit recoups this IF you fill out the paperwork and own them in taxable accounts.
Reasons To Potentially Buy ADDYY Today
| Metric |
| adidas |
| Quality |
| 80% 12/13 Super SWAN |
| Risk Rating |
| Very Low |
| DK Master List Quality Ranking (Out Of 500 Companies) |
| 254 |
| Quality Percentile |
| 50% |
| Dividend Growth Streak (Years) |
| 0 |
| Dividend Yield |
| 2.30% |
| Dividend Safety Score |
| 76% Safe |
| Average Recession Dividend Cut Risk |
| 1.0% |
| Severe Recession Dividend Cut Risk |
| 2.4% |
| S&P Credit Rating |
| A+ Stable |
| 30-Year Bankruptcy Risk |
| 0.60% |
| Consensus LT Risk-Management Industry Percentile |
| 86% Very Good Risk-Management |
| Fair Value |
| $116.27 |
| Current Price |
| $74.92 |
| Discount To Fair Value |
| 36% |
| DK Rating |
| Potentially Very Strong Buy |
| PE Ratio |
| 18.0 |
| Cash-Adjusted PE |
| 9.9 |
| Growth Priced In |
| 2.8% CAGR |
| Historical PE Range |
| 23 to 28 |
| LT Growth Consensus/Management Guidance |
| 22.8% |
| PEG Ratio |
| 0.43 (growth at a wonderful price) |
| 5-year consensus total return potential |
| 20% to 29% CAGR |
| Base Case 5-year consensus return potential |
| 26% CAGR (5X S&P 500) |
| Consensus 12-month total return forecast |
| 44% |
| Fundamentally Justified 12-Month Return Potential |
| 58% |
| LT Consensus Total Return Potential |
| 25.1% |
| Inflation-Adjusted Consensus LT Return Potential |
| 22.9% |
| Consensus 10-Year Inflation-Adjusted Total Return Potential (Ignoring Valuation) |
| 7.85 |
| LT Risk-Adjusted Expected Return |
| 17.46% |
| LT Risk-And Inflation-Adjusted Return Potential |
| 15.24% |
| Conservative Years To Double |
| 4.72 |
(Source: Dividend Kings Zen Research Terminal)
Analysts expect a 44% gain from ADDYY in the next year, and fundamentals would justify up to 58%.
ADDYY Growth Outlook Remains Intact Despite European Recession
| Metric |
| 2021 Growth Consensus |
| 2022 Growth Consensus |
| 2023 Growth Consensus |
| 2024 Growth Consensus |
| 2025 Growth Consensus |
| 2026 Growth Consensus |
| Sales |
| 20% |
| 2% |
| 8% |
| 8% |
| 12% |
| 5% |
| Dividend |
| 10% |
| 22% |
| 21% |
| 16% |
| 15% |
| 1% |
| EPS |
| 223% |
| -16% |
| 29% |
| 26% |
| 31% |
| 0% |
| Operating Cash Flow |
| 137% |
| -43% |
| 41% |
| 14% |
| 5% |
| 13% |
| Free Cash Flow |
| 143% |
| -57% |
| 62% |
| 8% |
| 9% |
| 25% |
| EBITDA |
| 60% |
| -12% |
| 18% |
| 18% |
| NA |
| NA |
| EBIT (operating income) |
| 164% |
| -23% |
| 31% |
| 24% |
| NA |
| NA |
(Source: FAST Graphs, FactSet)
Despite supply chain issues, a European recession, and a potential 2023 US recession, ADDYY's growth outlook remains very strong.
ADDYY 2024 Consensus Total Return Potential
FAST Graphs FAST Graphs
If ADDYY grows as analysts expect through 2024 and returns to historical fair value, it could deliver 100% total returns or 34% annually.
-
3X better than the S&P 500
-
Buffett-like return potential from a blue-chip bargain hiding in plain sight
Now compare that to the S&P 500 consensus.
S&P 2024 Consensus Total Return Potential
FAST Graphs FAST Graphs
Analysts expect about 31% or 12% annual returns from the S&P 500 over the next 2.5 years.
ADDYY 2027 Consensus Total Return Potential
FAST Graphs FAST Graphs
By 2027, if ADDYY grows as expected and returns to historical mid-range historical fair value, it could deliver 237% or 26% annual returns.
-
2.5X more than the S&P 500 consensus
-
Buffett-like return potential from a blue-chip bargain hiding in plain sight
S&P 500 2027 Consensus Return Potential
| Year |
| Upside Potential By End of That Year |
| Consensus CAGR Return Potential By End of That Year |
| Probability-Weighted Return (Annualized) |
| Inflation And Risk-Adjusted Expected Returns |
| 2027 |
| 48.76% |
| 8.27% |
| 6.20% |
| 3.77% |
(Source: DK S&P 500 Valuation And Total Return Tool)
Over the next five years, analysts expect about 49% total returns from the S&P 500 or 8% annually.
ADDYY Long-Term Consensus Total Return Potential
| Investment Strategy |
| Yield |
| LT Consensus Growth |
| LT Consensus Total Return Potential |
| Long-Term Risk-Adjusted Expected Return |
| Long-Term Inflation And Risk-Adjusted Expected Returns |
| Years To Double Your Inflation & Risk-Adjusted Wealth |
| 10-Year Inflation And Risk-Adjusted Expected Return |
| adidas |
| 2.3% |
| 22.8% |
| 25.1% |
| 17.6% |
| 15.4% |
| 4.7 |
| 4.17 |
| Dividend Aristocrats |
| 2.4% |
| 8.6% |
| 11.0% |
| 7.7% |
| 5.5% |
| 13.2 |
| 1.70 |
| S&P 500 |
| 1.6% |
| 8.5% |
| 10.1% |
| 7.1% |
| 4.9% |
| 14.8 |
| 1.61 |
| Nasdaq |
| 0.9% |
| 12.6% |
| 13.4% |
| 9.4% |
| 7.2% |
| 10.0 |
| 2.00 |
(Sources: Morningstar, FactSet, YCharts) - ignores valuation, which cancels out over 30+ years
Analysts think ADDYY could outperform almost every popular investment strategy, including the S&P 500, dividend aristocrats, and Nasdaq.
ADDYY Total Returns Since June 2006
-
ADDYY: 8.8% CAGR Vs. S&P 9.5% CAGR
Why am I recommending a company underperforming the S&P for 16 years? Because when you smooth out the current bear market, it's actually a world-beating outperformed.
Here are ADDYY's historical rolling returns:
-
average 12-month return: 18.6% Vs. S&P 11.4%
-
average 5-year return: 18.1% CAGR vs. S&P 11.6%
-
average 10-year return: 18.1% CAGR Vs. S&P 11.8%
What about that 26% CAGR five-year forecast? ADDYY has delivered as much as 40% CAGR five-year returns from bear market lows in the last 16 years.
-
5.4X return in 5 years
ADDYY's risk-adjusted expected returns are 17% to 18% CAGR, well within its historical 17% to 19% CAGR average rolling returns over 12-month to 10-year rolling periods.
A Dividend Growth Blue-Chip You Can Trust (Excluding The Pandemic)
Do you know what a great dividend growth stock looks like? It looks like this.
ADDYY Cumulative Dividend Since 2007: $1,000 Initial Investment
| Metric |
| S&P 500 |
| adidas |
| Total Dividends |
| $622 |
| $820 |
| Annualized Income Growth Rate |
| 7.4% |
| 15.3% |
| Total Income/Initial Investment |
| 0.62 |
| 0.82 |
| Inflation-Adjusted Income/Initial Investment |
| 0.43 |
| 0.56 |
| More Inflation-Adjusted Income Than S&P 500 |
| NA |
| 1.32 |
| Starting Yield |
| 2.2% |
| 1.1% |
| Yield On Cost |
| 6.4% |
| 9.3% |
(Source: Portfolio Visualizer Premium)
ADDYY has delivered 15% annual income growth and 0.8X an investor's initial investment over the last 15 years.
-
a 9.3% yield on cost means that number is rising very quickly now
ADDYY has recouped investors' initial investments 0.6X over a decade, adjusted for inflation, 32% more than the S&P 500.
-
and its growing about 3X as fast
ADDYY Consensus Future Income Growth Potential
| Analyst Consensus Income Growth Forecast |
| Risk-Adjusted Expected Income Growth |
| Risk And Tax-Adjusted Expected Income Growth |
| Risk, Inflation, And Tax-Adjusted Income Growth Consensus |
| 18.8% |
| 13.2% |
| 11.2% |
| 9.0% |
(Source: DK Research Terminal, FactSet)
Analysts think ADDYY could deliver 19% annual income growth in the future, which, adjusted for the risk of the company not growing as expected, inflation, and taxes, is 9.0% real expected income growth.
Now compare that to what they expect from the S&P 500.
| Time Frame |
| S&P Inflation-Adjusted Dividend Growth |
| S&P Inflation-Adjusted Earnings Growth |
| 1871-2021 |
| 1.6% |
| 2.1% |
| 1945-2021 |
| 2.4% |
| 3.5% |
| 1981-2021 (Modern Falling Rate Era) |
| 2.8% |
| 3.8% |
| 2008-2021 (Modern Low Rate Era) |
| 3.5% |
| 6.2% |
| FactSet Future Consensus |
| 2.0% |
| 5.2% |
(Sources: S&P, FactSet, Multpl.com)
-
1.7% post-tax inflation-adjusted income growth from the S&P 500
-
S&P 500's historical post-tax inflation-adjusted income growth rate (current tax code) is 5.8% CAGR
The S&P 500 is now dominated by buyback-friendly companies that prioritize repurchases over fast dividend growth.
What about a 60/40 retirement portfolio?
-
0.5% consensus inflation, risk, and tax-adjusted income growth.
In other words, ADDYY could generate about 5.2X faster real income growth than the S&P 500 and 18X faster income growth than a 60/40.
What inflation-adjusted returns do analysts expect in the future?
Inflation-Adjusted Consensus Return Potential: $1,000 Initial Investment
| Time Frame (Years) |
| 7.9% CAGR Inflation And Risk-Adjusted S&P Consensus |
| 8.9% Inflation-Adjusted Aristocrat Consensus |
| 15.4% CAGR Inflation And Risk-Adjusted ADDYY Consensus |
| Difference Between Inflation And Risk-Adjusted ADDYY Consensus And S&P Consensus |
| 5 |
| $1,461.18 |
| $1,530.17 |
| $2,044.81 |
| $583.63 |
| 10 |
| $2,135.06 |
| $2,341.43 |
| $4,181.24 |
| $2,046.19 |
| 15 |
| $3,119.71 |
| $3,582.79 |
| $8,549.84 |
| $5,430.13 |
| 20 |
| $4,558.47 |
| $5,482.29 |
| $17,482.79 |
| $12,924.32 |
| 25 |
| $6,660.75 |
| $8,388.86 |
| $35,748.96 |
| $29,088.20 |
| 30 (Retirement Time Frame) |
| $9,732.58 |
| $12,836.40 |
| $73,099.77 |
| $63,367.19 |
| 35 |
| $14,221.09 |
| $19,641.92 |
| $149,475.05 |
| $135,253.96 |
| 40 |
| $20,779.62 |
| $30,055.54 |
| $305,647.88 |
| $284,868.26 |
| 45 |
| $30,362.83 |
| $45,990.17 |
| $624,991.42 |
| $594,628.60 |
| 50 |
| $44,365.65 |
| $70,372.93 |
| $1,277,987.87 |
| $1,233,622.21 |
| 55 |
| $64,826.35 |
| $107,682.76 |
| $2,613,240.64 |
| $2,548,414.29 |
| 60 (Investing Lifetime) |
| $94,723.18 |
| $164,773.26 |
| $5,343,577.07 |
| $5,248,853.89 |
| 100 (Endowment Time Frame) |
| $1,968,311.27 |
| $4,952,348.74 |
| $1,633,252,991.08 |
| $1,631,284,679.81 |
(Source: DK Research Terminal, FactSet) - ignoring starting valuation, which cancels out over 30+ years
Using the risk and inflation-adjusted returns (consistent with ADDYY's historical rolling returns), we can see that ADDYY is capable of life-changing wealth over decades.
Over a long enough time period, blue-chip investing can change your life.
-
You don't need crypto or speculative assets to achieve 100+X returns; you just need a fast-growing Super SWANs like ADDYY and sufficient time
| Time Frame (Years) |
| Ratio Aristocrats/S&P Consensus |
| Ratio Inflation And Risk-Adjusted ADDYY Consensus vs. S&P consensus |
| 5 |
| 1.05 |
| 1.40 |
| 10 |
| 1.10 |
| 1.96 |
| 15 |
| 1.15 |
| 2.74 |
| 20 |
| 1.20 |
| 3.84 |
| 25 |
| 1.26 |
| 5.37 |
| 30 (Retirement Time Frame) |
| 1.32 |
| 7.51 |
| 35 |
| 1.38 |
| 10.51 |
| 40 |
| 1.45 |
| 14.71 |
| 45 |
| 1.51 |
| 20.58 |
| 50 |
| 1.59 |
| 28.81 |
| 55 |
| 1.66 |
| 40.31 |
| 60 (Investing Lifetime) |
| 1.74 |
| 56.41 |
| 100 |
| 2.52 |
| 829.77 |
(Source: DK Research Terminal, FactSet)
ADDYY Investment Decision Score
Dividend Kings
ADDYY is as close to a perfect fast-growing blue-chip option for anyone comfortable with its risk profile.
-
36% discount vs. 2% market premium = 38% better valuation
-
2.3% yield vs. 1.6% yield
-
150% better consensus long-term return potential
-
3X better risk-adjusted expected return over the next five years
Reason Two: A World-Beater Blue-Chip You'll Want To Own
There are many ways to measure safety and quality, and I factor in pretty much all of them.
The Dividend Kings' overall quality scores are based on a 274-point model that includes:
-
Dividend safety
-
Balance sheet strength
-
Credit ratings
-
Credit default swap medium-term bankruptcy risk data
-
Short and long-term bankruptcy risk
-
Accounting and corporate fraud risk
-
Profitability and business model
-
Growth consensus estimates
-
Management growth guidance
-
Historical earnings growth rates
-
Historical cash flow growth rates
-
Historical dividend growth rates
-
Historical sales growth rates
-
Cost of capital
-
GF Scores
-
Morningstar business model uncertainty score
-
Long-term risk-management scores from MSCI, Morningstar, FactSet, S&P, Reuters'/Refinitiv, Just Capital, and Moody’s
-
Management quality
-
Dividend-friendly corporate culture/income dependability
-
Long-term total returns (a Ben Graham sign of quality)
-
Analyst consensus long-term return potential
It includes over 1,000 fundamental metrics, including the 12 rating agencies we use to assess fundamental risk.
-
credit and risk management ratings make up 41% of the DK safety, and quality model
-
dividend/balance sheet/risk ratings make up 82% of the DK safety and quality model
How do we know that our safety and quality model works well?
During the two worst recessions in 75 years, our safety model 87% of blue-chip dividend cuts, the ultimate baptism by fire for any dividend safety model.
How does ADDYY score on our comprehensive safety and quality models.
ADDYY Dividend Safety
| Rating |
| Dividend Kings Safety Score (192 Point Safety Model) |
| Approximate Dividend Cut Risk (Average Recession) |
| Approximate Dividend Cut Risk In Pandemic Level Recession |
| 1 - unsafe |
| 0% to 20% |
| over 4% |
| 16+% |
| 2- below average |
| 21% to 40% |
| over 2% |
| 8% to 16% |
| 3 - average |
| 41% to 60% |
| 2% |
| 4% to 8% |
| 4 - safe |
| 61% to 80% |
| 1% |
| 2% to 4% |
| 5- very safe |
| 81% to 100% |
| 0.5% |
| 1% to 2% |
| ADDYY |
| 76% |
| 1.0% |
| 2.40% |
| Risk Rating |
| Very Low-Risk (86th industry percentile risk-management consensus) |
| A+ credit rating = 0.6% 30-year bankruptcy risk |
| 15% OR LESS Max Risk Cap Recommendation |
Long-Term Dependability
| Company |
| DK Long-Term Dependability Score |
| Interpretation |
| Points |
| Non-Dependable Companies |
| 20% or below |
| Poor Dependability |
| 1 |
| Low Dependability Companies |
| 21% to 59% |
| Below-Average Dependability |
| 2 |
| S&P 500/Industry Average |
| 60% (60% to 69% range) |
| Average Dependability |
| 3 |
| Above-Average |
| 70% to 79% |
| Very Dependable |
| 4 |
| Very Good |
| 80% or higher |
| Exceptional Dependability |
| 5 |
| ADDYY |
| 90% |
| Exceptional Dependability |
| 5 |
Overall Quality
| ADDYY |
| Final Score |
| Rating |
| Safety |
| 76% |
| 4 |
| Business Model |
| 80% |
| 3 |
| Dependability |
| 90% |
| 5 |
| Total |
| 80% |
| 12/13 Super SWAN |
| Risk Rating |
| 5/5 Very Low-Risk |
| 15% OR LESS Max Risk Cap Rec |
| 10% Margin of Safety For A Potentially Good Buy |
ADDYY is the 254th highest quality company on the DK 500 Masterlist.
-
50th percentile
How significant is this? The DK 500 Master List is one of the world's best watchlists, including
-
every dividend aristocrat (S&P companies with 25+ year dividend growth streaks)
-
every dividend champion (every company, including foreign, with 25+ year dividend growth streaks)
-
every dividend king (every company with 50+ year dividend growth streaks)
-
every foreign aristocrat (every company with 20+ year dividend growth streaks)
-
every Ultra SWAN (wide moat aristocrats, as close to perfect quality companies as exist)
-
40 of the world's best growth stocks
In other words, even among the world's best companies, ADDYY is higher quality than 50% of them, similar in quality to such aristocrats and Ultra SWANs as:
-
Caterpillar ( CAT ): Ultra SWAN dividend aristocrat
-
Federal Realty Investment Trust ( FRT ): Ultra SWAN dividend king
-
Amgen ( AMGN ): Ultra SWAN
-
Magellan Midstream Partners ( MMP ): Ultra SWAN
-
AvalonBay Communities ( AVB ): Ultra SWAN
-
Honeywell ( HON ): Ultra SWAN
Why I Trust adidas And So Can You
This article showcases the full investment thesis for ADDYY, including how the company plans to:
-
grow sales by 9% CAGR over time
-
grow earnings 17% CAGR over time
Our European blue-chip expert, Sebastian Wolf, also had a recent update.
“ adidas is currently in a very difficult situation. There's no doubt about this - nor will you hear me arguing with it. The downside to the company could very well be higher - we could drop lower.
However, I stand firm in my conviction that adidas will revert to growth and growing profit once these issues are over. The company has the pricing power, the market share, the expertise, the supply chain, and the manufacturing to do what needs doing here." - Sebastian Wolf
CEO Transition Update
“In a change that the company described as “mutually agreed upon,” narrow-moat adidas announced Kasper Rorsted will be replaced as CEO sometime in 2023. Rorsted, who has been in the position since 2016, joined the company after a successful tenure as CEO of narrow-moat Henkel.
At adidas, he has overseen growth in its North America operations, greatly expanded its e-commerce, and sold perennially underperforming Reebok for about EUR 2.1 billion. However, he has faced pressure from investors recently as adidas’ share price has dropped by about 50% over the past year , due primarily to very poor results in greater China.
Specifically, its sales in the region have declined by double-digit percentages for the last five quarters in a row due to virus-related restrictions and political controversy.
Although market leader wide-moat Nike has had similar struggles recently, adidas’ performance has been worse, and it cannot afford to cede share in this critical market. Thus, it may be time for a change." - Morningstar (emphasis added).
Morningstar's takeaway from the CEO transition announcement is that it shouldn't affect the long-term growth outlook, which analysts and rating agencies agree with.
Earnings Update
ADDYY is facing a perfect storm of headwinds in the short-term.
-
war
-
inflation
-
slowing global growth and EU recession
-
China lockdowns
-
supply chain challenges
But remember, this is an A+ rated company that's been thriving and adapting since 1920, and six rating agencies rate its long-term risk-management as 86th industry percentile.
-
If there is any company that can adapt and overcome these challenges its ADDYY
On the plus side, ADDYY reported excellent 21% sales growth in North America, 7% in Europe, and 37% in Latin America.
Even in Asia, where China's lockdowns devastated its sales, sales growth was +3%.
E-commerce is growing at double-digits compared to overall US e-commerce sales, which have now gone flat.
That's not to say that their challenges are costing them. Supply chains cost $300 million in higher costs in Q2, and they continue to have to write down some assets over the Russian invasion.
In China, where lockdowns caused a 35% drop in Q1 sales, delivery costs crimped margins on direct-to-consumer sales.
In fact, heavy spending on DTC has impacted margins and is expected to for the rest of the year.
But in 85% of their markets, ADDYY is delivering growth, despite some very challenging headwinds.
-
+13% growth in digital sales
-
38% of sales are now from online
-
sales growth outside of China was +14% in Q2
In fact, in Q2, operating margins expanded in all markets except for China and Europe.
-
Management expects 14% to 16% sales growth in the second half of 2022
Management's updated guidance for the full 2022 results by market is far from catastrophic, as the share price collapse might have you believe.
-
14% to 16% sales growth
-
12% to 14% sales growth in Europe
-
7% to 9% sales growth in Asia
-
17% to 19% sales growth in North America
-
30% to 40% sales growth in Latin America
Margins are expected to come down this year, and net income guidance was cut by 30% to $1.3 billion.
-
Adjusting for lower earnings guidance, ADDYY is still trading at 9.9X cash-adjusted earnings
-
a 36% historical discount
Quantitative Analysis: The Math Backing Up ADDYY's Investment Thesis
Ben Graham recommended combining qualitative (the story) analysis with quantitative analysis looking at the past, present, and likely future.
ADDYY Credit Ratings
| Rating Agency |
| Credit Rating |
| 30-Year Default/Bankruptcy Risk |
| Chance of Losing 100% Of Your Investment 1 In |
| S&P |
| A+ Stable Outlook |
| 0.60% |
| 166.7 |
| Moody's |
| A2 Stable (A equivalent) |
| 0.66% |
| 151.5 |
| Consensus |
| A+ Stable Outlook |
| 0.63% |
| 158.7 |
(Source: S&P, Moody's, Fitch, DBRS)
Rating agencies estimate ADDYY's fundamental risk at 0.63%, indicating a 1 in 159 chance of losing all your money buying the company today.
ADDYY Leverage Consensus Forecast
| Year |
| Debt/EBITDA |
| Net Debt/EBITDA (3 Or Less Safe According To Credit Rating Agencies) |
| Interest Coverage (8+ Safe) |
| 2021 |
| 0.80 |
| -0.42 |
| 12.98 |
| 2022 |
| 0.88 |
| 0.01 |
| 9.50 |
| 2023 |
| 0.74 |
| 0.07 |
| 14.86 |
| 2024 |
| 0.62 |
| 0.02 |
| 20.16 |
| 2025 |
| 0.55 |
| 0.00 |
| 25.66 |
| 2026 |
| 0.62 |
| -0.06 |
| 27.72 |
| Annualized Change |
| -4.79% |
| -31.41% |
| 16.39% |
(Source: FactSet Research Terminal)
ADDYY's strong balance sheet is expected to remain a fortress in the coming years, with net debt/EBITDA of close to zero and interest coverage rising at 16% per year.
ADDYY Balance Sheet Consensus Forecast
| Year |
| Total Debt (Millions) |
| Cash |
| Net Debt (Millions) |
| Interest Cost (Millions) |
| EBITDA (Millions) |
| Operating Income (Millions) |
| 2021 |
| $2,756 |
| $4,228 |
| -$1,470 |
| $169 |
| $3,462 |
| $2,194 |
| 2022 |
| $2,676 |
| $3,127 |
| $45 |
| $187 |
| $3,024 |
| $1,776 |
| 2023 |
| $2,676 |
| $2,956 |
| $252 |
| $153 |
| $3,612 |
| $2,273 |
| 2024 |
| $2,641 |
| $3,116 |
| $94 |
| $140 |
| $4,251 |
| $2,823 |
| 2025 |
| $2,727 |
| $4,492 |
| -$5 |
| $145 |
| $4,925 |
| $3,721 |
| 2026 |
| $2,831 |
| $2,519 |
| -$293 |
| $123 |
| $4,545 |
| $3,410 |
| Annualized Growth |
| 0.54% |
| -9.84% |
| -27.57% |
| -6.16% |
| 5.59% |
| 9.22% |
(Source: FactSet Research Terminal)
ADDYY's net debt is expected to fall 28% annually while operating income grows at 9%.
ADDYY Bond Profile
-
$7.7 billion in liquidity
-
well staggered debt maturities (little problem refinancing maturing bonds)
-
82% unsecured bonds (good financial flexibility)
ADDYY Credit Default Swaps: Bond Market's Real-Time Fundamental Risk Assessment
FactSet
Credit default swaps are insurance policies bond investors take out against potential defaults.
-
a real-time fundamental risk-assessment
-
ADDYY's CDS are very stable over the last six months, while the stock price collapsed
-
the bond market is pricing in 1.8% long-term bankruptcy risk, consistent with A- credit rating
-
bond investors, rating agencies, management, and analysts agree that ADDYY's thesis remains intact
ADDYY GF Score: One Of The Newest Addition To The DK Safety And Quality Model
“The GF Score is a ranking system that has been found to be closely correlated to the long-term performances of stocks by backtesting from 2006 to 2021." - Gurufocus
GF Score considers five key aspects. They are:
-
Financial Strength
-
Profitability
-
Growth
-
Valuation
-
Momentum
ADDYY's good 76/100 GF score confirms its quality and investment thesis.
Profitability: Wall Street's Favorite Quality Proxy
ADDYY's profitability is historically in the top 20% of peers, a wide-moat company.
ADDYY 12-Month Profitability Vs. Peers
| Metric |
| TTM |
| Industry Percentile |
| Major Apparel Companies providers More Profitable Than ADDYY (Out Of 1077) |
| Gross Margins |
| 49.88% |
| 80.6 |
| 209 |
| Operating Margin |
| 7.21% |
| 58.76 |
| 444 |
| Net Margin |
| 8.89% |
| 73.49 |
| 286 |
| Return On Equity |
| 27.68% |
| 88.87 |
| 120 |
| Return On Assets |
| 8.91% |
| 79.20 |
| 224 |
| Returns On Invested Capital |
| 9.91% |
| 71.00 |
| 312 |
| Return On Capital (Greenblatt) |
| 26.91% |
| 77.66 |
| 241 |
| Return On Capital Employed |
| 12.83% |
| 63.50 |
| 393 |
| Average |
| 19.03% |
| 74.14 |
| 279 |
(Source: Gurufocus Premium)
Even in a very challenging year, with so many headwinds, ADDYY's profitability was still in the top 26% of its peers.
ADDYY Profit Margin Consensus Forecast
| Year |
| FCF Margin |
| EBITDA Margin |
| EBIT (Operating) Margin |
| Net Margin |
| Return On Capital Expansion |
| Return On Capital Forecast |
| 2021 |
| 11.7% |
| 14.8% |
| 9.4% |
| 7.0% |
| 1.39 |
| 2022 |
| 5.6% |
| 12.6% |
| 7.4% |
| 5.6% |
| TTM ROC |
| 27.68% |
| 2023 |
| 6.8% |
| 13.8% |
| 8.7% |
| 6.2% |
| Latest ROC |
| 27.32% |
| 2024 |
| 7.8% |
| 15.0% |
| 9.9% |
| 7.2% |
| 2026 ROC |
| 38.45% |
| 2025 |
| 8.6% |
| 15.5% |
| 11.7% |
| 8.4% |
| 2026 ROC |
| 37.95% |
| 2026 |
| 7.4% |
| 13.6% |
| 10.2% |
| 7.5% |
| Average |
| 38.20% |
| 2027 |
| NA |
| NA |
| NA |
| NA |
| Industry Median |
| 10.73% |
| 2028 |
| NA |
| NA |
| NA |
| NA |
| ADDYY/Industry Median |
| 3.56 |
| Annualized Growth (Ignoring Pandemic Reopening Boom) |
| 5.83% |
| 1.69% |
| 6.79% |
| 6.03% |
| Vs. S&P |
| 2.62 |
(Source: FactSet Research Terminal)
-
5% FCF margins is a rule of thumb for quality companies
Return on capital is expected to rise 40% in the coming three years.
-
pre-tax profit/the money it takes to run the business (operating capital)
-
Joel Greenblatt's gold standard proxy for quality and moatiness
-
According to one of the greatest investors in history, ADDYY is about 2.6X higher quality than the average S&P 500 company
-
and 3.6X higher quality than its median peer
ADDYY's ROC has been slowly trending up at 0.8% CAGR for 20 years, confirming a wide and stable moat, as do the rest of its margins.
ADDYY's profitability has been relatively stable for the last two decades, confirming its wide and stable moat.
Reason Three: Despite Strong Short-Term Headwinds, The Long-Term Investment Thesis Remains Intact
At 9.9X cash-adjusted earnings, ADDYY is priced for about 2.8% CAGR long-term growth. That's compared to the 17% growth management expects and analysts' even more bullish outlook.
ADDYY Medium-Term Growth Consensus
| Year |
| Sales |
| Free Cash Flow |
| EBITDA |
| EBIT (Operating Income) |
| Net Income |
| 2021 |
| $23,454 |
| $2,737 |
| $3,462 |
| $2,194 |
| $1,648 |
| 2022 |
| $24,091 |
| $1,348 |
| $3,024 |
| $1,776 |
| $1,351 |
| 2023 |
| $26,189 |
| $1,769 |
| $3,612 |
| $2,273 |
| $1,625 |
| 2024 |
| $28,414 |
| $2,216 |
| $4,251 |
| $2,823 |
| $2,044 |
| 2025 |
| $31,756 |
| $2,745 |
| $4,925 |
| $3,721 |
| $2,652 |
| 2026 |
| $33,299 |
| $2,473 |
| $4,545 |
| $3,410 |
| $2,503 |
| Annualized Growth (Ignoring Post-Pandemic Reopening Boom) |
| 8.43% |
| 16.38% |
| 10.72% |
| 17.71% |
| 16.67% |
| Cumulative Next 2022-2026 |
| $143,749 |
| $10,551 |
| $20,357 |
| $14,003 |
| $10,175 |
(Source: FactSet Research Terminal)
Ignoring the 2021 post-pandemic reopening boom, ADDYY is expected to grow sales at 8.4% (management guidance is 8% to 10%), and its bottom line at about 17% (16% to 18% management guidance).
$11 billion in cumulative free cash flow is a 103% cash conversion ratio, which is very good for this industry.
-
confirming the skill of management
-
and minimal accounting fraud risk
ADDYY Dividend Growth Consensus Forecast
| Year |
| Dividend Consensus |
| FCF/Share Consensus |
| FCF Payout Ratio |
| Retained (Post-Dividend) Free Cash Flow |
| Buyback Potential |
| Debt Repayment Potential |
| 2022 |
| $1.74 |
| $3.46 |
| 50.2% |
| $629 |
| 2.18% |
| 23.5% |
| 2023 |
| $1.93 |
| $5.14 |
| 37.5% |
| $1,172 |
| 4.06% |
| 44.4% |
| 2024 |
| $2.24 |
| $6.55 |
| 34.2% |
| $1,573 |
| 5.46% |
| 59.6% |
| 2025 |
| $2.61 |
| $7.15 |
| 36.5% |
| $1,657 |
| 5.75% |
| 60.8% |
| 2026 |
| $2.63 |
| $8.97 |
| 29.3% |
| $2,314 |
| 8.03% |
| 81.7% |
| Total 2022 Through 2026 |
| $11.15 |
| $31.27 |
| 35.7% |
| $7,344.53 |
| 25.47% |
| 278.10% |
| Annualized Rate |
| 10.9% |
| 26.9% |
| -12.6% |
| 38.5% |
| 38.5% |
| 36.6% |
(Source: FactSet Research Terminal)
60% is the payout ratio credit rating agencies consider safe for this industry.
ADDY's payout ratio policy is 40% to 50% and it's expected to bring that down from 50% this year to 30% by 2026.
Even with 11% annual dividend growth, the company is expected to retain over $7 billion in post-dividend free cash flow, enough to pay off all its debt 3X or buy back about 25% of shares at current valuations.
ADDYY Buyback Consensus Forecast
| Year |
| Consensus Buybacks ($ Millions) |
| % Of Shares (At Current Valuations) |
| Market Cap |
| 2022 |
| $1,974 |
| 6.9% |
| $28,796 |
| 2023 |
| $553 |
| 1.9% |
| $28,796 |
| 2024 |
| $564 |
| 2.0% |
| $28,796 |
| 2025 |
| $1,052 |
| 3.7% |
| $28,796 |
| Total 2022 through 2025 |
| $4,143 |
| 14.4% |
| $28,796 |
| Annualized Rate |
| 3.8% |
| Average Annual Buybacks |
| $1,036 |
| 1% Buyback Tax |
| $41 |
| Average Annual Buyback Tax |
| $10 |
(Source: FactSet Research Terminal)
Analysts expect ADDYY to buy back $1 billion per year in stock through 2025, around 14% of shares at current valuations.
Since beginnings its buybacks in 2015, ADDYY has averaged a 2% net annual buyback program.
| Time Frame (Years) |
| Net Buyback Rate |
| Shares Remaining |
| Net Shares Repurchased |
| Each Share You Own Is Worth X Times More (Not Including Future Growth And Dividends) |
| 5 |
| 1.9% |
| 90.85% |
| 9.15% |
| 1.10 |
| 10 |
| 1.9% |
| 82.54% |
| 17.46% |
| 1.21 |
| 15 |
| 1.9% |
| 75.00% |
| 25.00% |
| 1.33 |
| 20 |
| 1.9% |
| 68.14% |
| 31.86% |
| 1.47 |
| 25 |
| 1.9% |
| 61.90% |
| 38.10% |
| 1.62 |
| 30 |
| 1.9% |
| 56.24% |
| 43.76% |
| 1.78 |
| 35 |
| 1.9% |
| 51.10% |
| 48.90% |
| 1.96 |
| 40 |
| 1.9% |
| 46.43% |
| 53.57% |
| 2.15 |
| 45 |
| 1.9% |
| 42.18% |
| 57.82% |
| 2.37 |
| 50 |
| 1.9% |
| 38.32% |
| 61.68% |
| 2.61 |
| 55 |
| 1.9% |
| 34.82% |
| 65.18% |
| 2.87 |
| 60 |
| 1.9% |
| 31.63% |
| 68.37% |
| 3.16 |
| 65 |
| 1.9% |
| 28.74% |
| 71.26% |
| 3.48 |
| 70 |
| 1.9% |
| 26.11% |
| 73.89% |
| 3.83 |
| 75 |
| 1.9% |
| 23.72% |
| 76.28% |
| 4.22 |
| 80 |
| 1.9% |
| 21.55% |
| 78.45% |
| 4.64 |
| 85 |
| 1.9% |
| 19.58% |
| 80.42% |
| 5.11 |
| 90 |
| 1.9% |
| 17.79% |
| 82.21% |
| 5.62 |
| 95 |
| 1.9% |
| 16.16% |
| 83.84% |
| 6.19 |
| 100 |
| 1.9% |
| 14.69% |
| 85.31% |
| 6.81 |
(Source: FactSet Research Terminal)
At its historical net buyback rate, ADDYY could potentially repurchase 44% of its share in the next 30 years, almost doubling the value of your shares, not counting future growth.
ADDYY Long-Term Growth Outlook
-
16.8% to 22.9% is the actual growth consensus range
-
22.8% median consensus from all 32 analysts
-
management guidance 16% to 18% CAGR
How accurate are analyst estimates and management guidance?
-
smoothing for outliers, historical analyst margins of error are 5% to the upside and 45% to the downside
-
9% to 30% CAGR margin-of-error adjusted growth consensus range
ADDYY has been accelerating growth in recent years, before the Pandemic. Management is confident that its increased focus on DTC will be able to drive higher margins and 17% long-term growth, the strongest in its history.
Analysts are even more bullish on its growth prospects.
Reason Four: A Wonderful Company At A Wonderful Price
For 20 years, outside of bear markets and bubbles, tens of millions of income growth investors have paid 23X to 28X earnings for ADDYY
-
91% statistical probability that this represents the intrinsic value range for ADDYY
| Metric |
| Historical Fair Value Multiples (12-years) |
| 2021 |
| 2022 |
| 2023 |
| 2024 |
| 12-Month Forward Fair Value |
| 13-Year Median Yield |
| 1.38% |
| $131.88 |
| $125.94 |
| $125.94 |
| $164.49 |
| Earnings |
| 26.06 |
| $107.63 |
| $93.03 |
| $116.75 |
| $149.32 |
| Average |
| $118.53 |
| $107.02 |
| $121.17 |
| $156.54 |
| $116.27 |
| Current Price |
| $74.92 |
| Discount To Fair Value |
| 36.79% |
| 29.99% |
| 38.17% |
| 52.14% |
| 35.56% |
| Upside To Fair Value (NOT Including Dividends) |
| 58.21% |
| 42.84% |
| 61.73% |
| 108.95% |
| 55.19% (58% including dividend) |
| 2022 EPS |
| 2023 EPS |
| 2022 Weighted EPS |
| 2023 Weighted EPS |
| 12-Month Forward EPS |
| 12-Month Average Fair Value Forward PE |
| Current Forward PE |
| $3.57 |
| $4.48 |
| $1.24 |
| $2.93 |
| $4.17 |
| 27.9 |
| 18.0 |
I estimate ADDYY is historically worth 28X earnings and today trades at 18X and a 9.9X cash-adjusted PE.
| Analyst Median 12-Month Price Target |
| Morningstar Fair Value Estimate |
| $106.39 (23.8 PE) |
| $105.00 (25.2 PE) |
| Discount To Price Target (Not A Fair Value Estimate) |
| Discount To Fair Value |
| 29.58% |
| 28.65% |
| Upside To Price Target (Not Including Dividend) |
| Upside To Fair Value (Not Including Dividend) |
| 42.00% |
| 40.15% |
| 12-Month Median Total Return Price (Including Dividend) |
| Fair Value + 12-Month Dividend |
| $108.13 |
| $106.74 |
| Discount To Total Price Target (Not A Fair Value Estimate) |
| Discount To Fair Value + 12-Month Dividend |
| 30.71% |
| 29.81% |
| Upside To Price Target ( Including Dividend) |
| Upside To Fair Value + Dividend |
| 44.32% |
| 42.47% |
Morningstar's discounted cash flow fair value model estimates ADDYY is worth 25X earnings, and analysts expect a PE of 24 within a year.
-
massive upside potential for ADDYY
-
a potential 44% gain within a year if analysts are right
-
58% total return would be justified by fundamentals
I don't recommend companies based on 12-month forecasts but on the margin of safety and whether or not it sufficiently compensates you for a company's risk profile.
Margin Of Safety Not 12-Month Price Targets Are How I Make Investment Decisions
| Rating |
| Margin Of Safety For Very Low-Risk 12/13 Quality Super SWANs |
| 2022 Fair Value Price |
| 2023 Fair Value Price |
| 12-Month Forward Fair Value |
| Potentially Reasonable Buy |
| 0% |
| $107.02 |
| $121.17 |
| $116.27 |
| Potentially Good Buy |
| 10% |
| $96.31 |
| $109.05 |
| $104.64 |
| Potentially Strong Buy |
| 20% |
| $85.61 |
| $96.94 |
| $93.02 |
| Potentially Very Strong Buy |
| 30% |
| $67.42 |
| $84.82 |
| $81.39 |
| Potentially Ultra-Value Buy |
| 40% |
| $64.21 |
| $72.70 |
| $69.76 |
| Currently |
| $74.92 |
| 29.99% |
| 38.17% |
| 35.56% |
| Upside To Fair Value (Not Including Dividends) |
| 42.84% |
| 61.73% |
| 55.19% |
ADDYY is a potentially very strong buy for anyone comfortable with its risk profile.
Risk Profile: Why adidas Isn't Right For Everyone
There are no risk-free companies, and no company is right for everyone. You have to be comfortable with the fundamental risk profile.
What Could Cause ADDYY's Investment Thesis To Break
-
safety falls to 40% or less
-
balance sheet collapses (approximately 0.63% or less probability according to rating agencies)
-
significant market share loss globally (such as to Nike or smaller upstarts)
-
growth outlook falls to less than 7.7% for six years
-
ADDYY's role in my portfolio is to deliver long-term 10+% returns with minimal fundamental risk
-
8+% total return requirement for defensive sectors (including healthcare)
-
10+% for non-defensive (cyclical) sectors
How long it takes for a company's investment thesis to break depends on the quality of the company.
| Quality |
| Years For The Thesis To Break Entirely |
| Below-Average |
| 1 |
| Average |
| 2 |
| Above-Average |
| 3 |
| Blue-Chip |
| 4 |
| SWAN |
| 5 |
| Super SWAN |
| 6 |
| Ultra SWAN |
| 7 |
| 100% Quality Companies (MSFT, LOW, and MA) |
| 8 |
These are my rule of thumb for when to sell a stock if the investment thesis has broken. ADDYY is highly unlikely to suffer such catastrophic declines in fundamentals.
Risk Profile Summary
“We assign a Medium Uncertainty Rating to adidas. The company, like all multinational apparel manufacturers, has had to navigate store closures, supply chain disruptions, and economic weakness from the COVID-19 crisis. Moreover, high inflation is impacting adidas’ margins and could reduce consumer spending on its products .
adidas has experienced sales growth rates far above industry growth in North America (13% growth in 2021, for example), but it is likely that these rates will moderate.
It is difficult to know how quickly fashion trends might change. adidas’ sales and margins would suffer if, for example, its red-hot Yeezy shoes fell out of style. adidas had to suspend operations in Russia due to the invasion of Ukraine.
However, Russia accounted for only 2% of 2021 sale s, so even a permanent withdrawal would have limited impact. adidas is exposed to weakness in physical retail in the U.S. and other markets.
We do not think adidas faces any environmental, social, or governance risks that will have a material effect on our valuation of the company.
Moreover, adidas is caught up in an FBI investigation of bribery of high school and college basketball players and coaches. Also, its close relationship with FIFA carries risks. In 2013, adidas signed a long-term deal to sponsor the World Cup that runs through 2030. FIFA, though, has been embroiled in corruption scandals since 2015 that have already led to convictions of more than two dozen officials." - Morningstar (emphasis added).
adidas's Risk Profile Summary
-
economic cyclicality risk: sales could suffer in a recession
-
M&A risk: Reebok was a failed acquisition
-
technology disruption risk: falling retail sales (though offset by DTC)
-
consumer taste risk: different brands go in and out of fashion (affected by occasional scandals)
-
margin compression risk: over 1,000 major global rivals
-
supply chain disruption risk: big impact in 2021
-
labor retention risk (tightest job market in over 50 years)- rising wage pressures
-
currency risk
“In a deal that we regard as a poor use of capital, adidas acquired Reebok in 2005 for $3.8 billion. Once a legitimate rival to Nike in the U.S., Reebok has fallen far behind it and other major athletic brands. Reebok generated only EUR 1.4 billion in sales in 2020 versus EUR 18.4 billion for the adidas brand.
Thus, we have a positive view of adidas' recent announcement that will sell Reebok to Authentic Brands Group for EUR 2.1 billion . This deal is expected to close in 2022’s first quarter. While adidas is expected to return most of this cash to shareholders, it has not provided specifics.
As Under Armour was making acquisitions in the fitness app space at around the same time, we think adidas may have felt pressure to follow suit. We do not expect adidas to pursue large acquisitions and expect it will use much of its free cash flow for stock buybacks and dividends." - Morningstar (emphasis added)
adidas is taking a $1.6 billion loss on its acquisition of Reebok after 17 years of trying to compete with Nike and failing. It appears to have learned its lesson and isn't expected to try such big acquisitions in the future.
How do we quantify, monitor, and track such a complex risk profile? By doing what big institutions do.
Long-Term Risk Analysis: How Large Institutions Measure Total Risk
-
see the risk section of this video to get an in-depth view (and link to two reports) of how DK and big institutions measure long-term risk management by companies
ADDYY Long-Term Risk-Management Consensus
| Rating Agency |
| Industry Percentile |
| Rating Agency Classification |
| MSCI 37 Metric Model |
| 100.0% |
| AAA, Industry Leader, Stable Trend |
| Morningstar/Sustainalytics 20 Metric Model |
| 84.2% |
| 13.6/100 Low-Risk |
| Reuters'/Refinitiv 500+ Metric Model |
| 100.0% |
| #1 in the Industry, excellent |
| S&P 1,000+ Metric Model |
| 85.0% |
| Very Good, Stable Trend |
| FactSet |
| 50.0% |
| Average, Positive Trend |
| Morningstar Global Percentile (All 15,000 Rated Companies) |
| 93.6% |
| Excellent |
| Consensus |
| 86% |
| Very Low Risk, Very Good Risk-Management, Stable Trend |
(Sources: Morningstar, FactSet, S&P, Reuters, MSCI)
ADDYY's Long-Term Risk Management Is The 17th Best In The Master List (93rd Percentile)
| Classification |
| Average Consensus LT Risk-Management Industry Percentile |
| Risk-Management Rating |
| S&P Global ( SPGI ) #1 Risk Management In The Master List |
| 94 |
| Exceptional |
| adidas |
| 86 |
| Very Good |
| Strong ESG Stocks |
| 78 |
| Good - Bordering On Very Good |
| Foreign Dividend Stocks |
| 75 |
| Good |
| Ultra SWANs |
| 71 |
| Good |
| Low Volatility Stocks |
| 68 |
| Above-Average |
| Dividend Aristocrats |
| 67 |
| Above-Average |
| Dividend Kings |
| 63 |
| Above-Average |
| Master List average |
| 62 |
| Above-Average |
| Hyper-Growth stocks |
| 61 |
| Above-Average |
| Monthly Dividend Stocks |
| 60 |
| Above-Average |
| Dividend Champions |
| 57 |
| Average bordering on above-average |
(Source: DK Research Terminal)
ADDYY's risk-management consensus is in the top 3% of the world's highest quality companies and similar to that of such other blue-chips as
-
Allianz SE ( OTCPK:ALIZY )
-
Moody's ( MCO )
-
Amgen ( AMGN )
-
Canadian Pacific Railway ( CP )
-
Colgate-Palmolive ( CL ): Ultra SWAN dividend king
-
Lockheed Martin ( LMT )
-
Microsoft ( MSFT )
For further details see:
4 Reasons It's Time To Get Greedy On adidas