AGNC - 5 Dividend Yields From 7% To 16%
2023-04-20 18:00:15 ET
Summary
- The big yields in these shares will draw in many investors.
- Huge dividend increases may be required when floating rates kick in.
- We're including my largest position.
Get ready for charts, images, and tables because they are better than words. The ratings and outlooks we highlight here come after Scott Kennedy's weekly updates in the REIT Forum. Your continued feedback is greatly appreciated, so please leave a comment with suggestions.
We're going rapid fire. I've got a few shares to cover.
Preferred Shares
AGNC Investment Corp. ( AGNCP ) is my largest preferred share position . Shares are cheap. They're still just under $20.00. The 7.72% stripped yield may not seem like a big spread compared to short-term Treasuries offering about 5%. However, if the dividend were floating today, the stripped yield would be 12.43%. That's a big improvement. I'm not convinced the Federal Reserve will keep rates at 5% or above for the next few years, but that doesn't mean they're heading all the way back to 0% either. Even as we enter a recession, I expect the Federal Reserve will resist cutting rates (despite inflation just being propped up by lagged data on shelter). That could make the recession a bit worse and recessions increase the debt. It's not a great system.
Regardless, if rates remain elevated, then AGNCP gets a huge dividend increase. If rates fall, that isn't the end of the world. If Treasury yields drop back down to 2%, I wouldn't be expecting anywhere near 12% anyway. There isn't a perfect option where investors just get double-digit rates no matter what happens. There are some high fixed-rate dividend yields, but they come with higher risk. AGNCP is one of the lower-risk shares.
For a fixed-rate dividend, I think RC-E ( RC.PE ) is offering a good yield. The stripped yield is at 8.98% based on a recent price of $18.20. RC-E has excellent coverage from common equity since the vast majority of RC's "equity" is in the form of common shares. That's good for the preferred shareholder because it creates a bigger cushion.
RITM-D ( RITM.PD ) is another position for me. Shares have a stripped yield of 8.94% (nearly 9%) and will reset based on the five-year treasury rate in late 2026. They will pay 6.223% over the five-year Treasury rate. Today, the fixed-rate dividend is only 7% (lower share price creates the 9% yield). The difference between 7% and 6.223% reflects that the five-year Treasury rate only needs to be above .77% for RITM-D to see the dividend rate increase. That makes it hard for the yield on cost to be much lower than 9%.
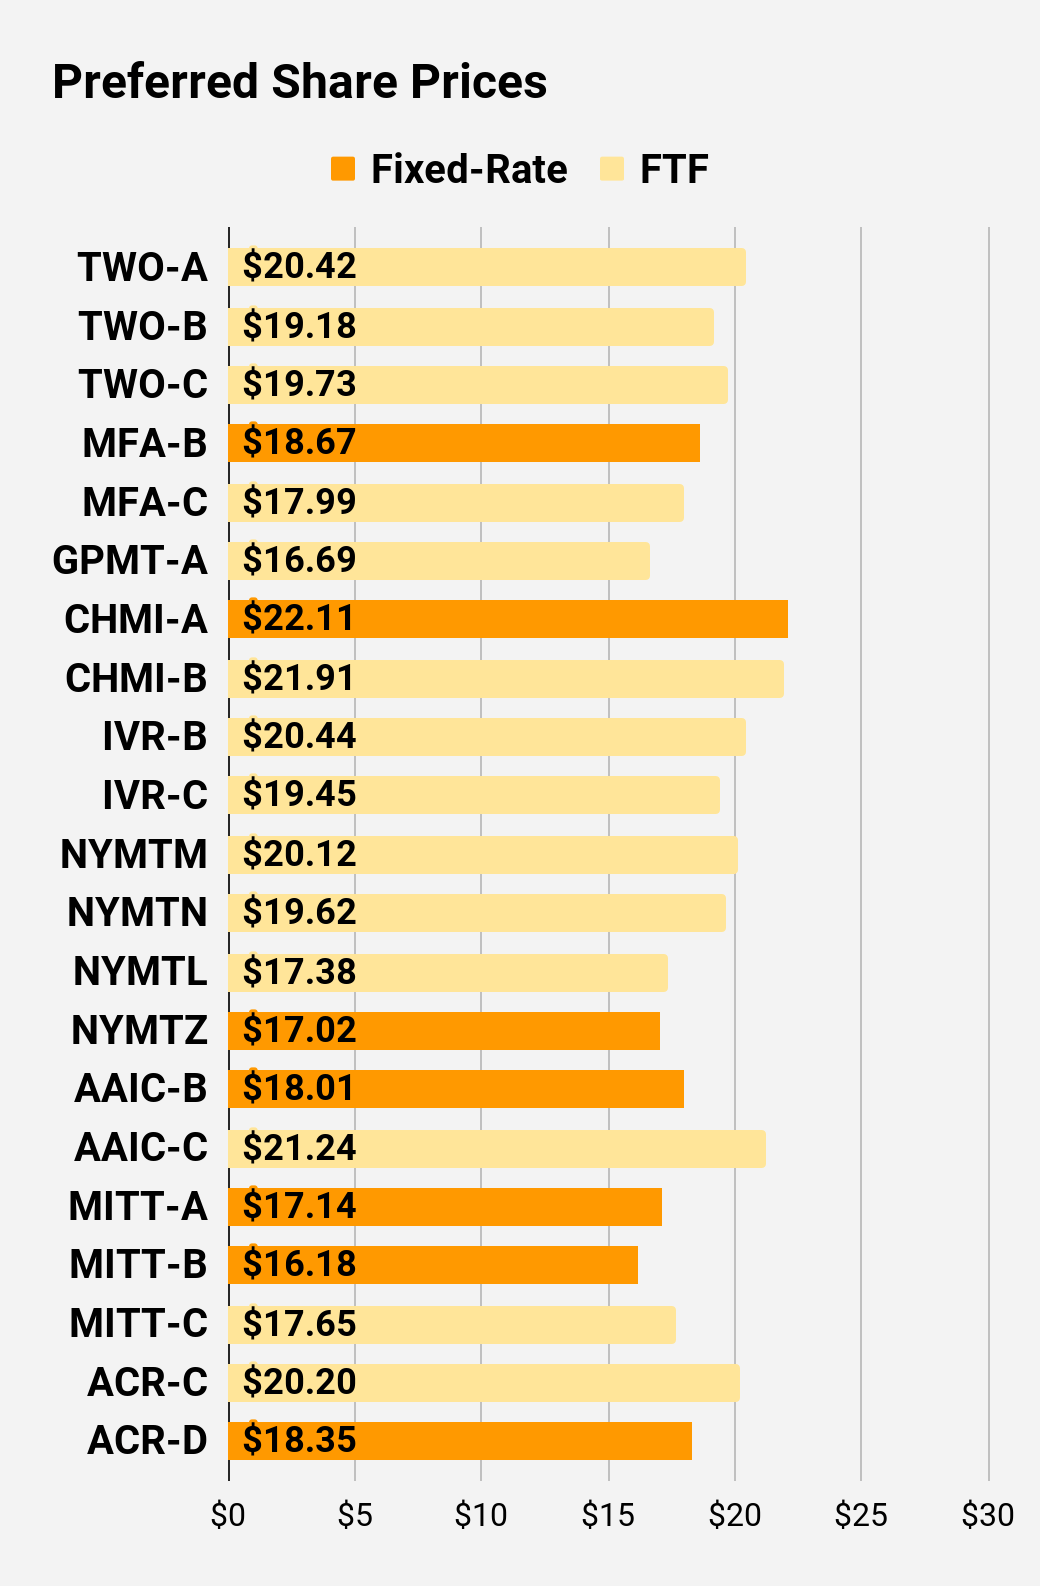
NYMTL ( NYMTL ) vs. NYMTN ( NYMTN ) is creating a significant mismatch. NYMTL at $17.38 is much better than NYMTN at $19.62. The investor in NYMTN gets some extra dividends today, but not enough to offset the dramatically higher price they paid for the shares. When shares begin floating (late 2026 for NYMTL and late 2027 for NYMTN), the spread for NYMTL is materially larger. Investors get the short-term rate plus the spread. Since NYMTL has a spread of 6.13% and NYMTN has a spread of 5.695%, NYMTL will have the bigger dividend. Combine that with today's much lower share price and you have a very clear disconnect.
Someone is probably going to say: "But what if NYMT calls NYMTL? You're a big dummy!"
If NYMTL was called on the first call date, it would represent an annualized return somewhere around 22%. That's a dream scenario for shareholders. I'm not forecasting an immediate call, but anyone scared of a call should remember that NYMTL's share price of $17.38 is much lower than the call value of $25.00. At these entry prices, call risk should not be a significant concern. If NYMTL was floating today, the stripped yield would be over 16%.
I think CIM-B ( CIM.PB ) at $20.29 is a better deal than CIM-C ( CIM.PC ) at $18.87. Some people will disagree. When both shares float, CIM-B's dividend will be about $.25 per share higher. Therefore, investors would recover the difference of $1.42 per share in under six years. Except, CIM-B floats on 3/30/2024 and CIM-C does not float until 9/30/2025. In those 18 months, CIM-B may pay out a dramatically larger dividend. That can dramatically reduce the repayment period on CIM-B's higher share price.
Swapping Shares
We hunt for opportunities to swap between shares when relative prices change. If a better choice comes along, we have no issue with swapping our shares for the cheaper opportunity.
Note: You can see far more data about prices and yields in my charts.
Other Commentary
Scott Kennedy provided some commentary for subscribers (as he always does) in the weekly update. He wrote:
BDC weekly NAVs had a minor "uptick" this week as spreads narrowed a bit. Not sure that's entirely justified with the potential of a looming recession but just something I'll continue to monitor. A consistent theme, I do expect spreads to widen out some from here (probably towards summer). Still relatively tight when looking back to historical trends. On underlying portfolio companies, MAIN and CSWC had an investment receive a credit downgrade. This was already anticipated/valuations already reflected this event.
Moving on, most mREITs saw a minor tightening of spreads which basically negates what occurred during the prior week. Simply put, derivative valuation gains "trumped" asset valuation fluctuations (exact opposite of the prior week). Still some pressure in commercial whole loan pricing/valuations looking outside weekly fluctuations (continued credit/recession risk).
Stock Table
We will close out the rest of the article with the tables and charts we provide for readers to help them track the sector for both common shares and preferred shares.
We're including a quick table for the common shares that will be shown in our tables:
| Type of REIT or BDC |
| Residential Agency |
| Residential Hybrid |
| Residential Originator and Servicer |
| Commercial |
| BDC |
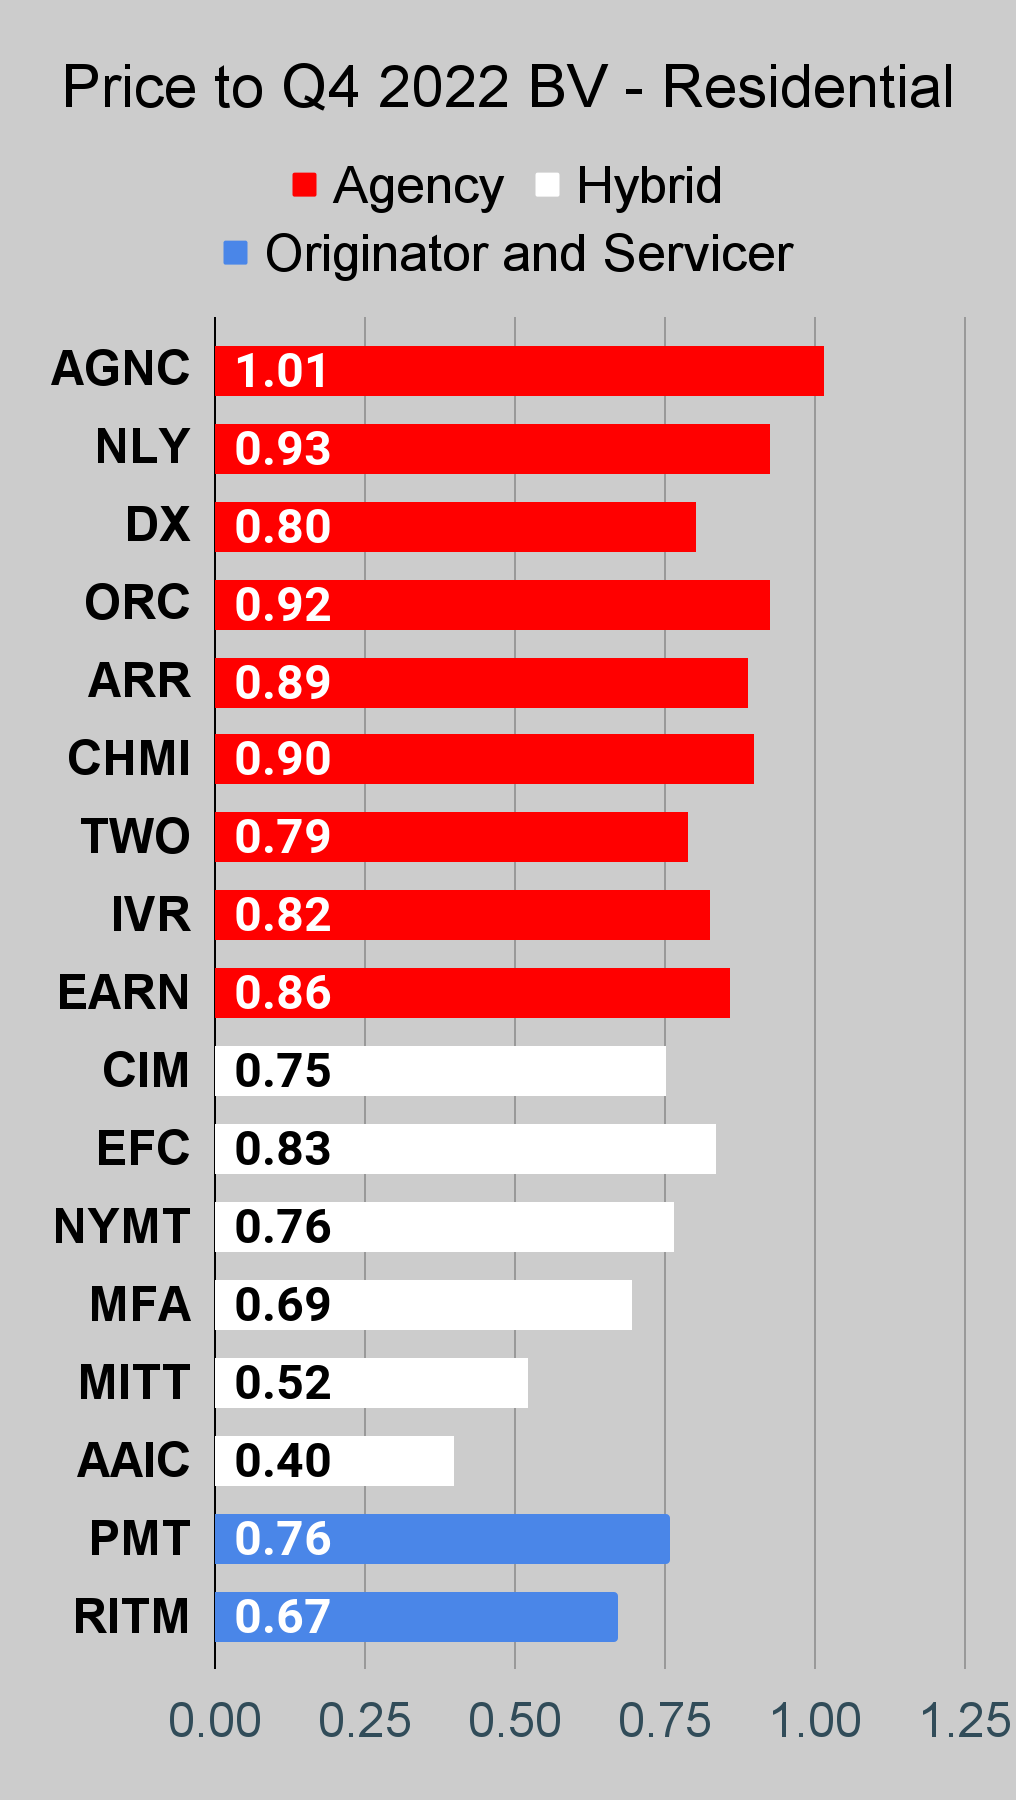
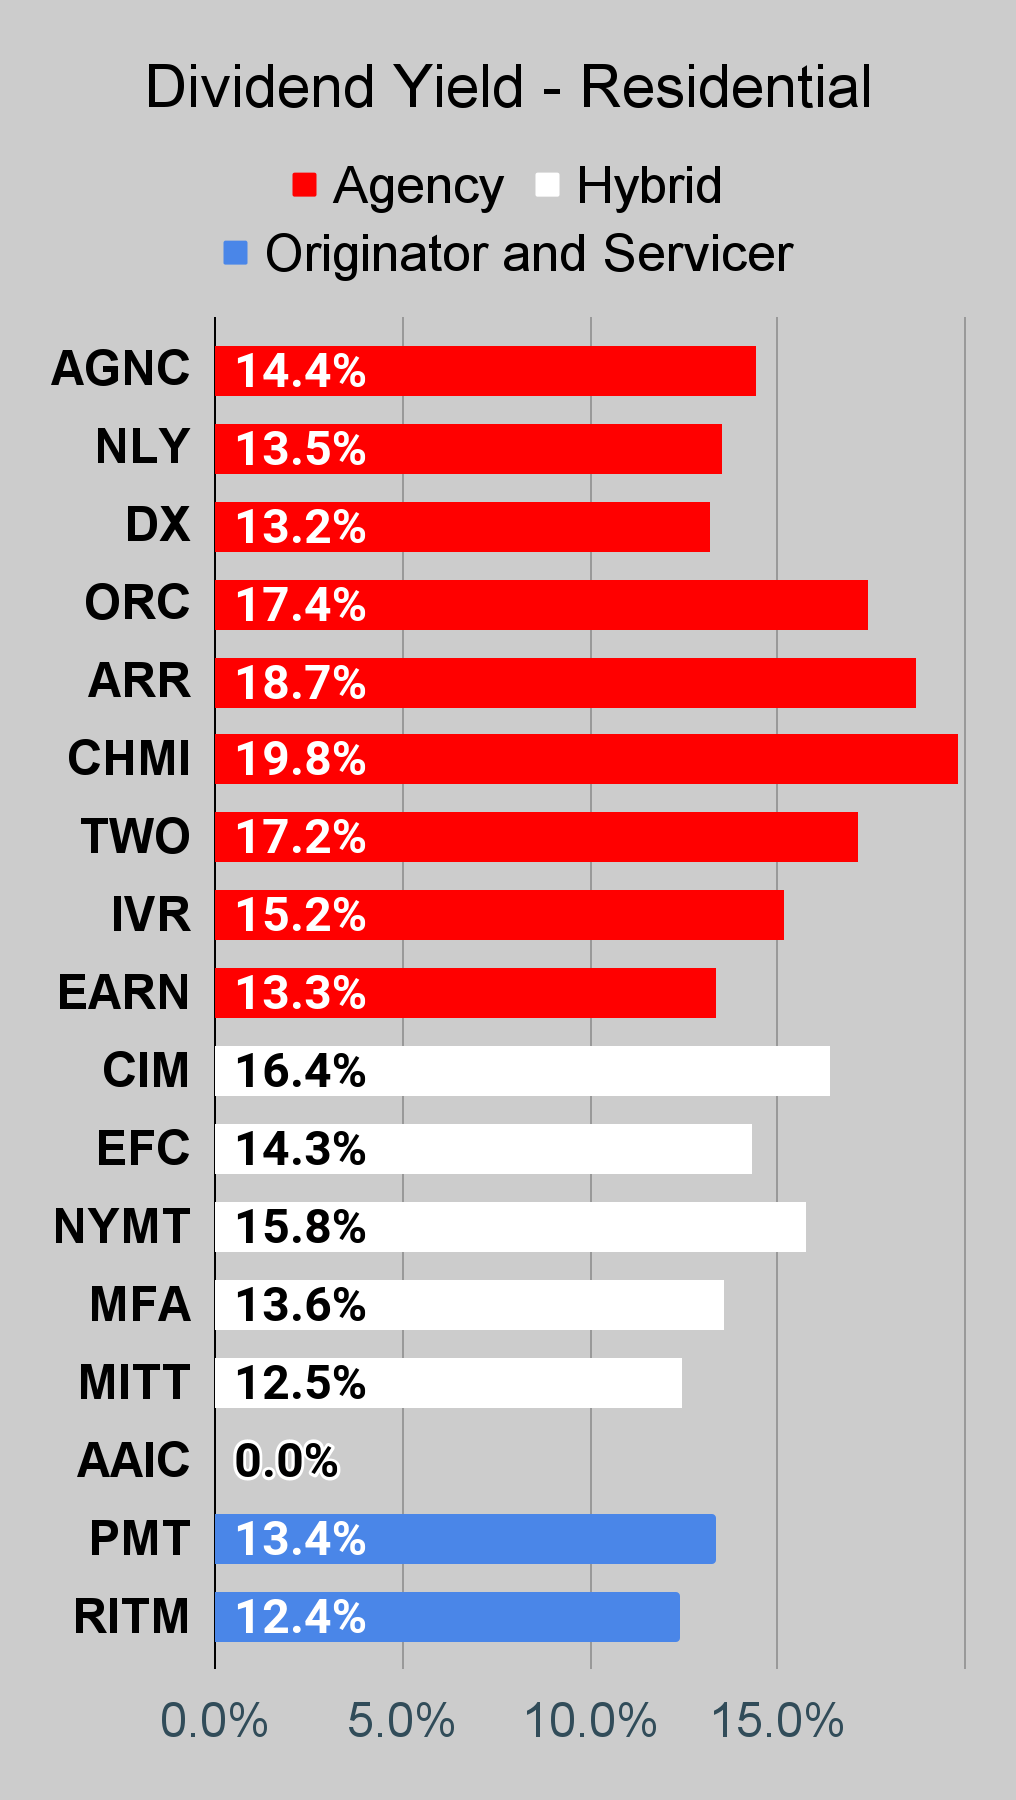
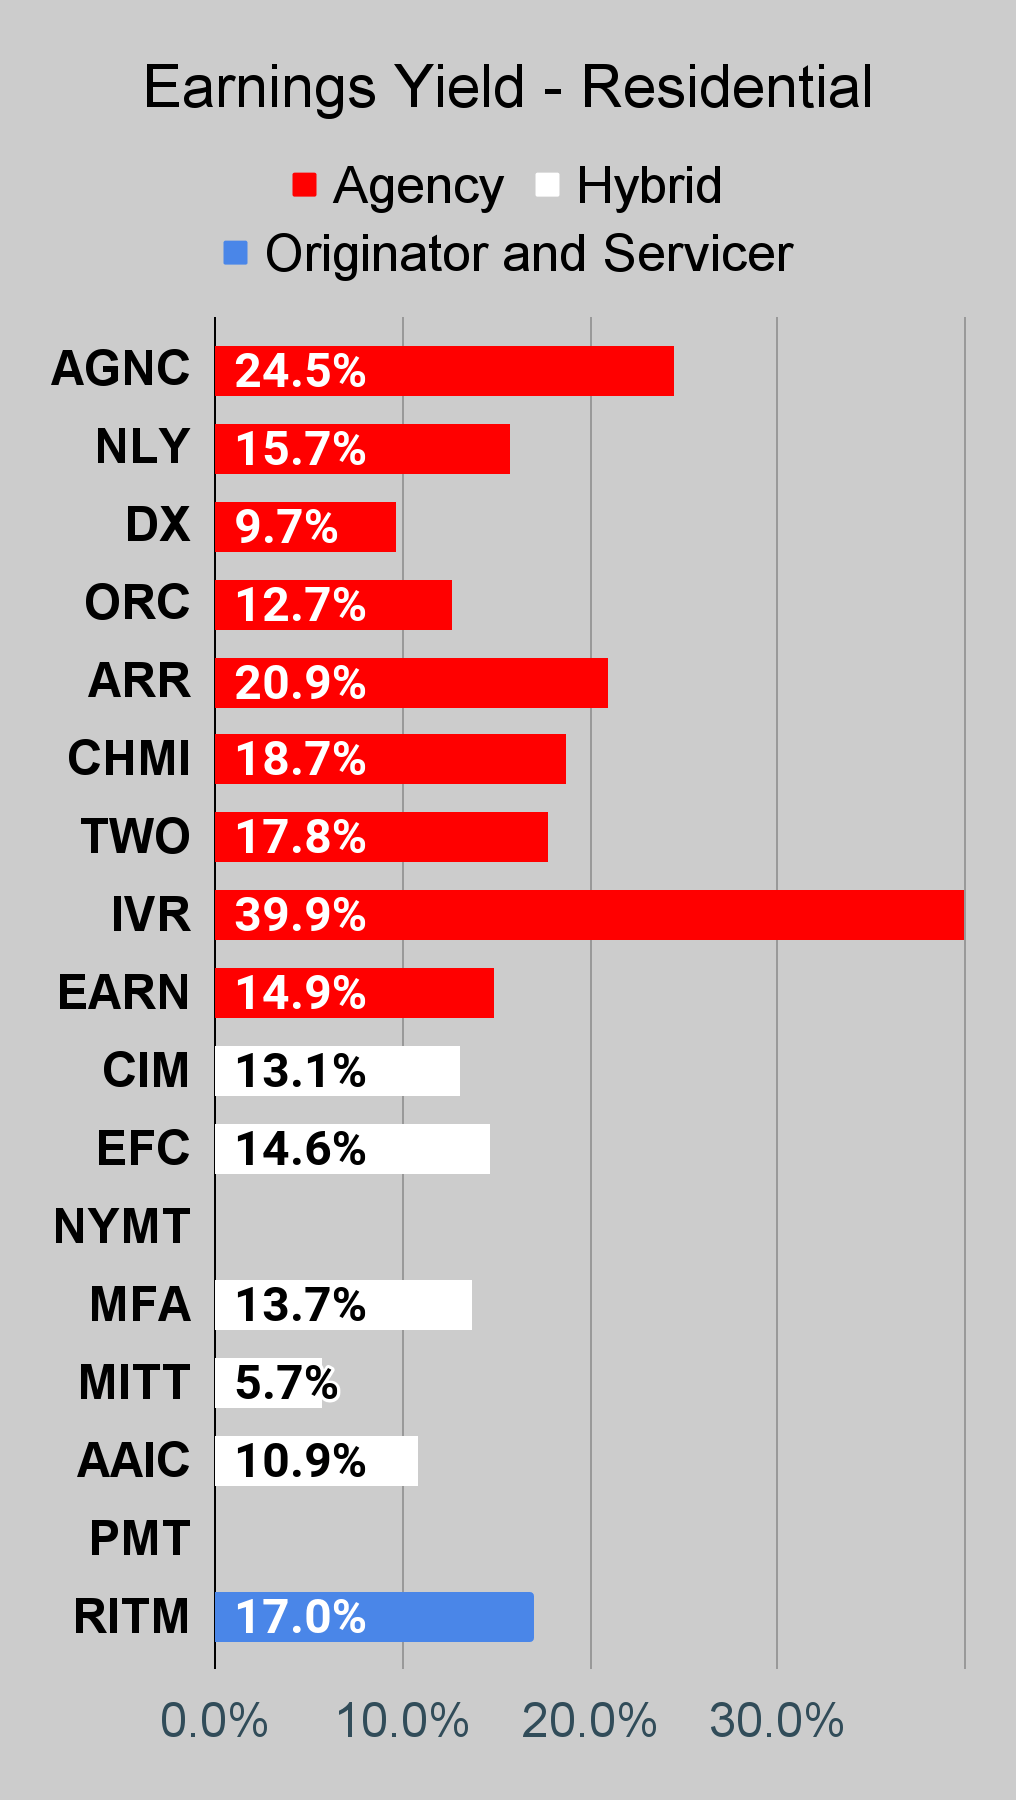
If you're looking for a stock and I haven't mentioned it yet, you'll still find it in the charts below. The charts contain comparisons based on price-to-book value, dividend yields, and earnings yield. You won't find these tables anywhere else.
For mortgage REITs, please look at the charts for AGNC, NLY, DX, ORC, ARR, CHMI, TWO, IVR, EARN, CIM, EFC, NYMT, MFA, MITT, AAIC, PMT, RITM, BXMT, GPMT, WMC, and RC.
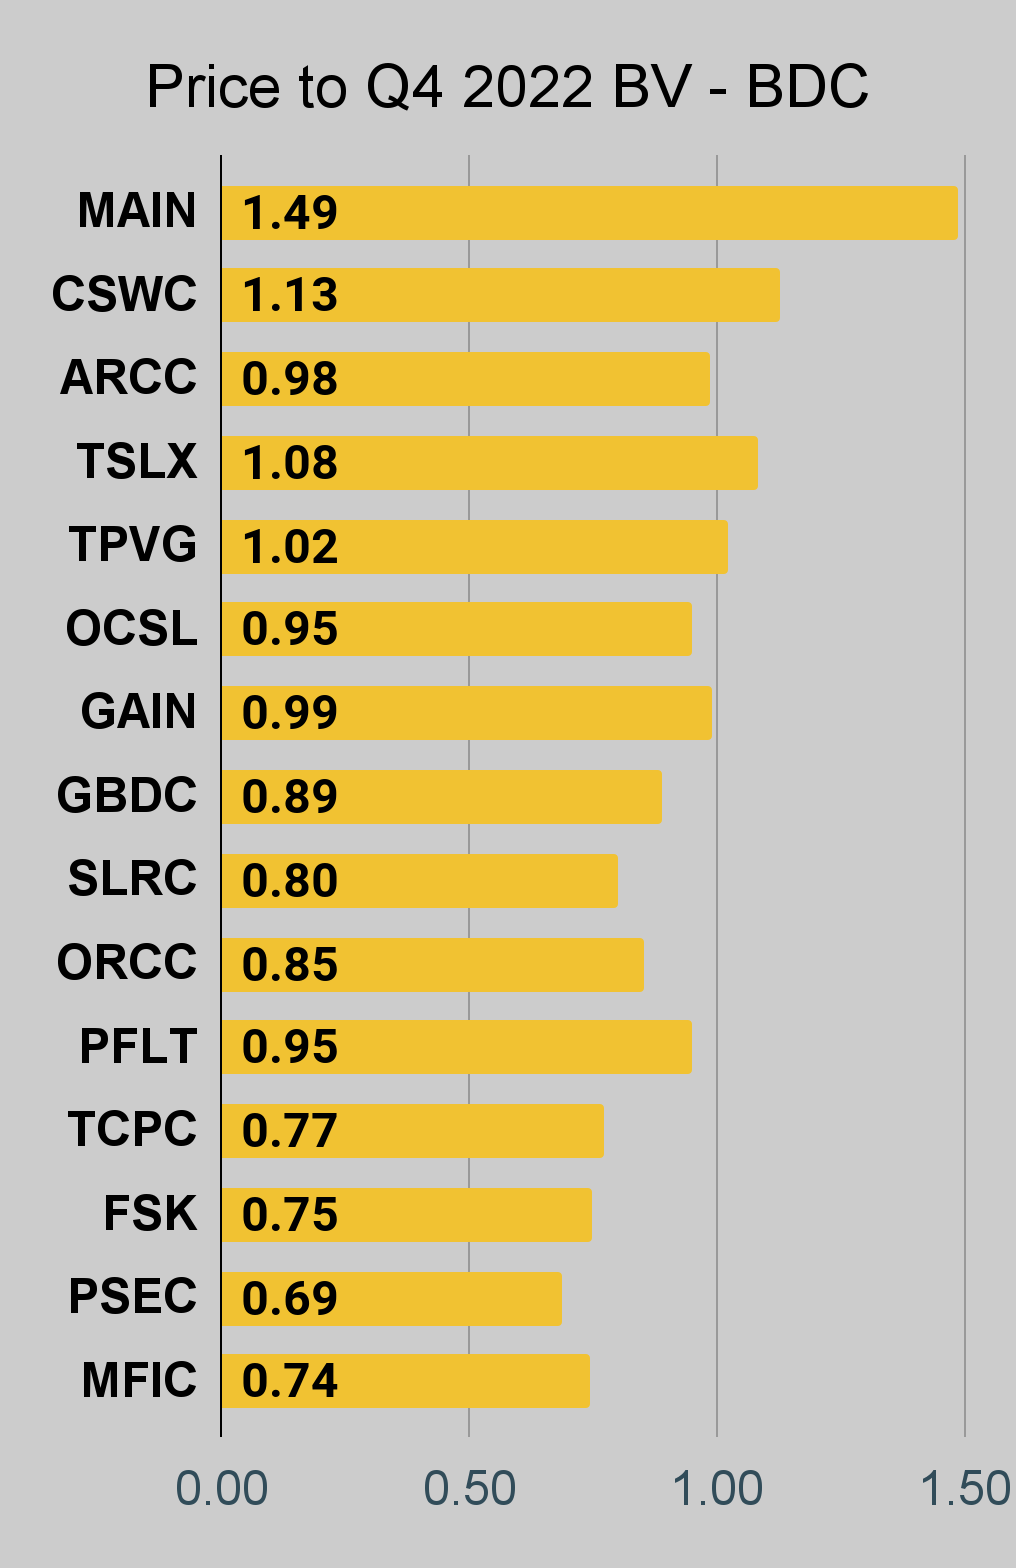
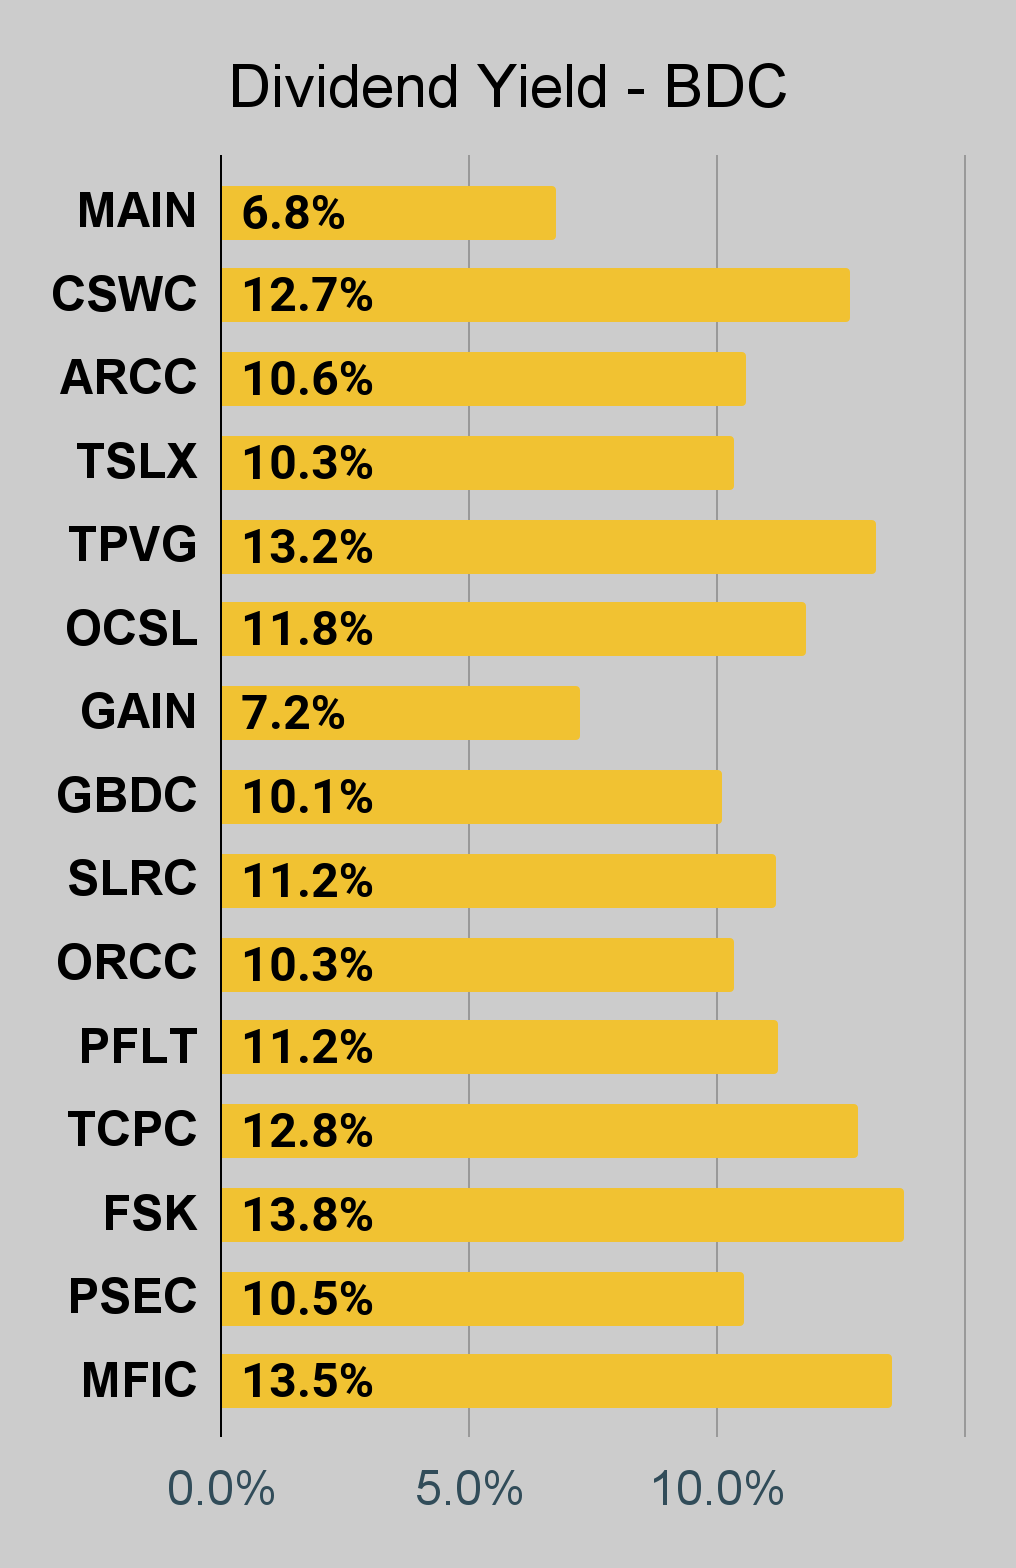
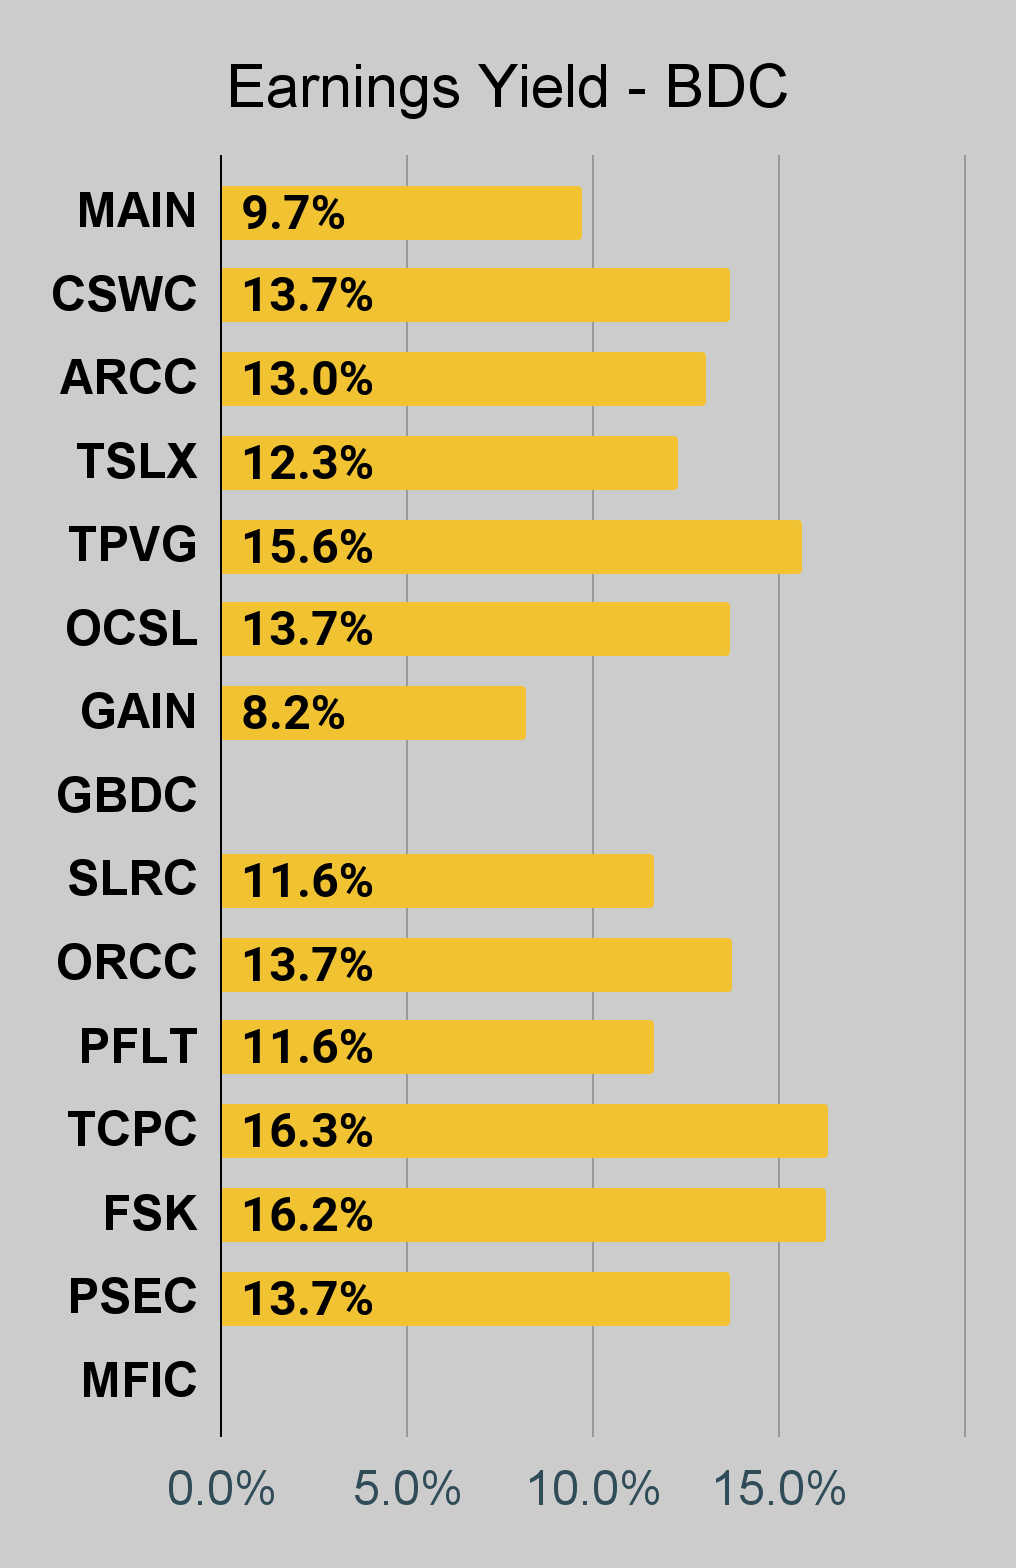
For BDCs, please look at the charts for MAIN, CSWC, ARCC, TSLX, TPVG, OCSL, GAIN, GBDC, SLRC, ORCC, PFLT, TCPC, FSK, PSEC, and MFIC.
This series is the easiest place to find charts providing up-to-date comparisons across the sector.
Residential Mortgage REIT Charts
Note: The chart for our public articles uses the book value per share from the latest earnings release. Current estimated book value per share is used in reaching our targets and trading decisions. It's available in our service, but those estimates are not included in the charts below. PMT and NYMT are not showing an earnings yield metric as neither REIT provides a quarterly "Core EPS" metric.
Second Note: Due to the way historical amortized cost and hedging is factored into the earnings metrics, it's possible for two mortgage REITs with similar portfolios to post materially different metrics for earnings. I would be very cautious about putting much emphasis on the consensus analyst estimate (which is used to determine the earnings yield). In particular, throughout late 2022 the earnings metric became less comparable for many REITs.
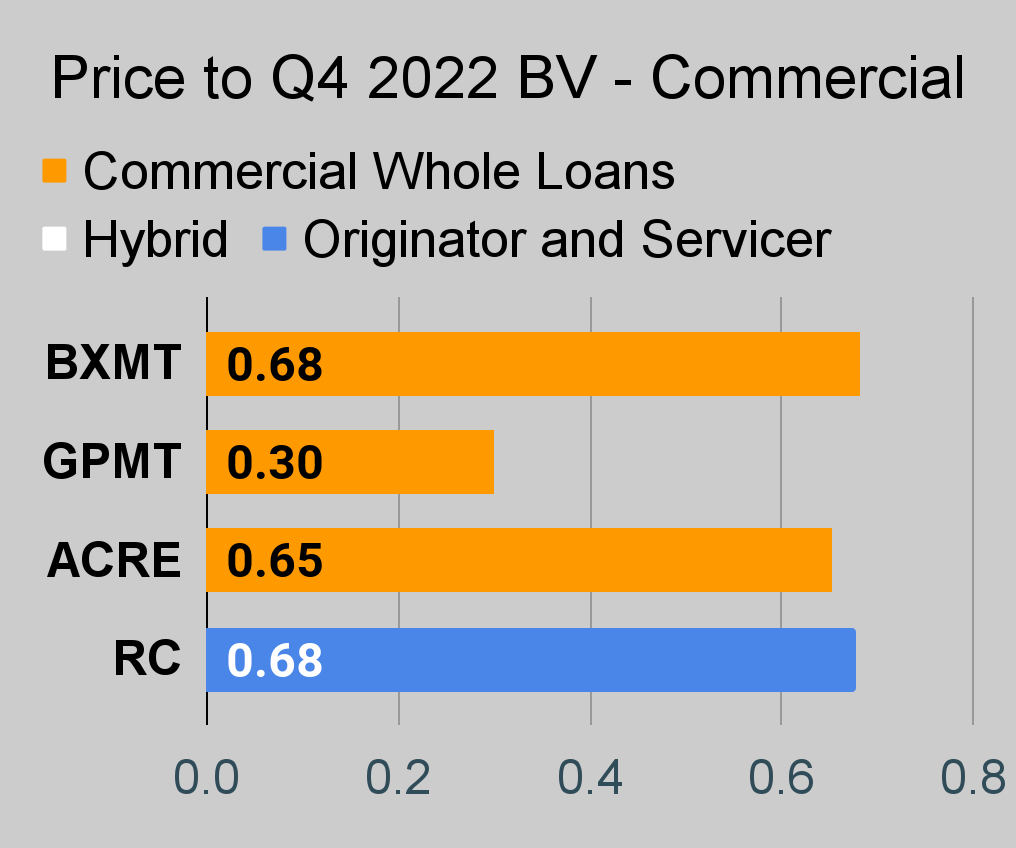
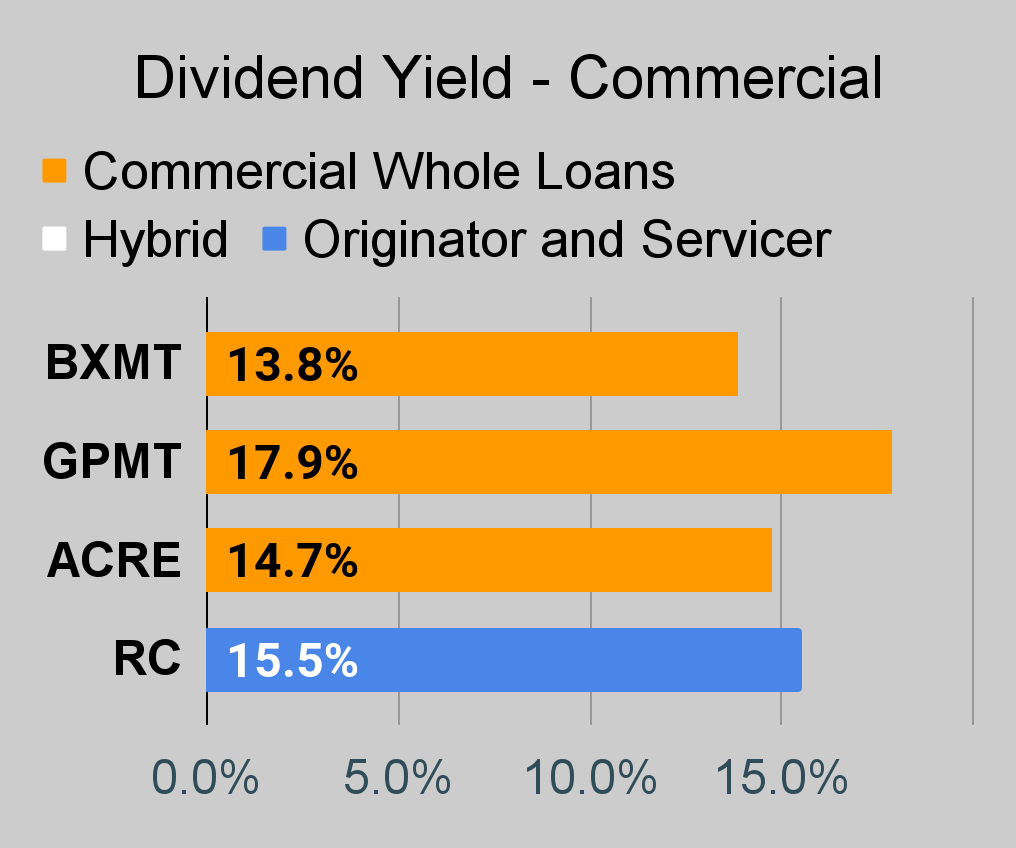
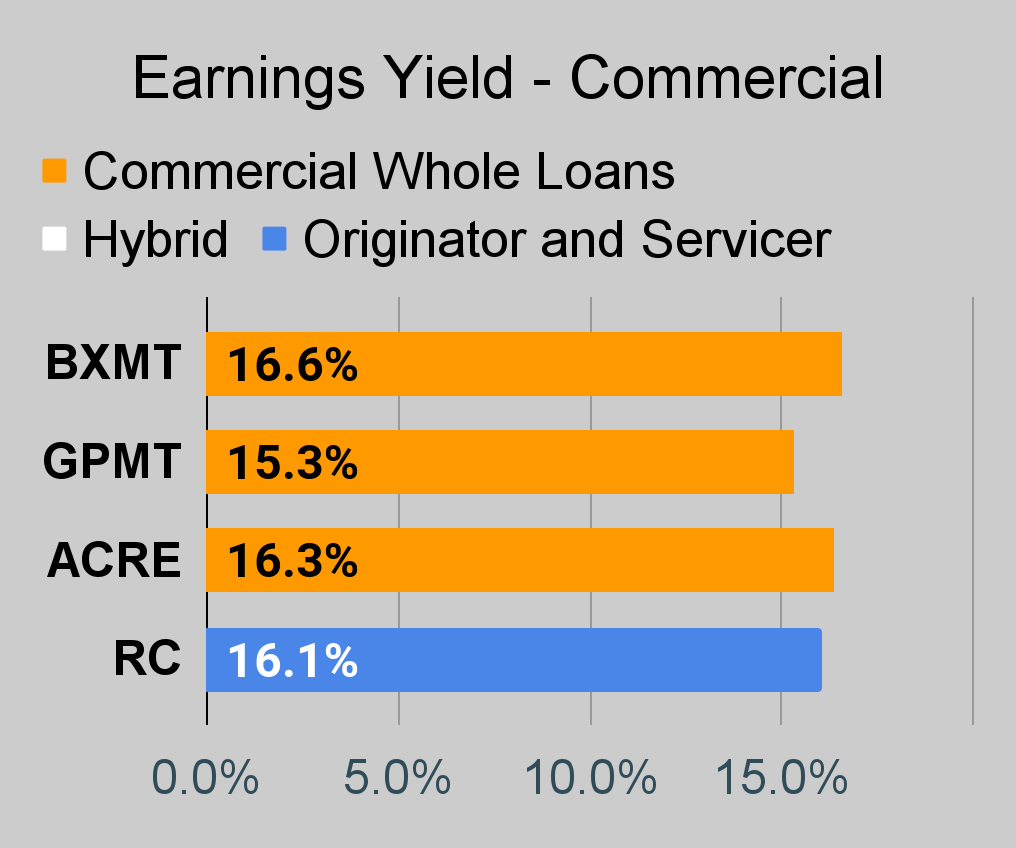
Commercial Mortgage REIT Charts
BDC Charts
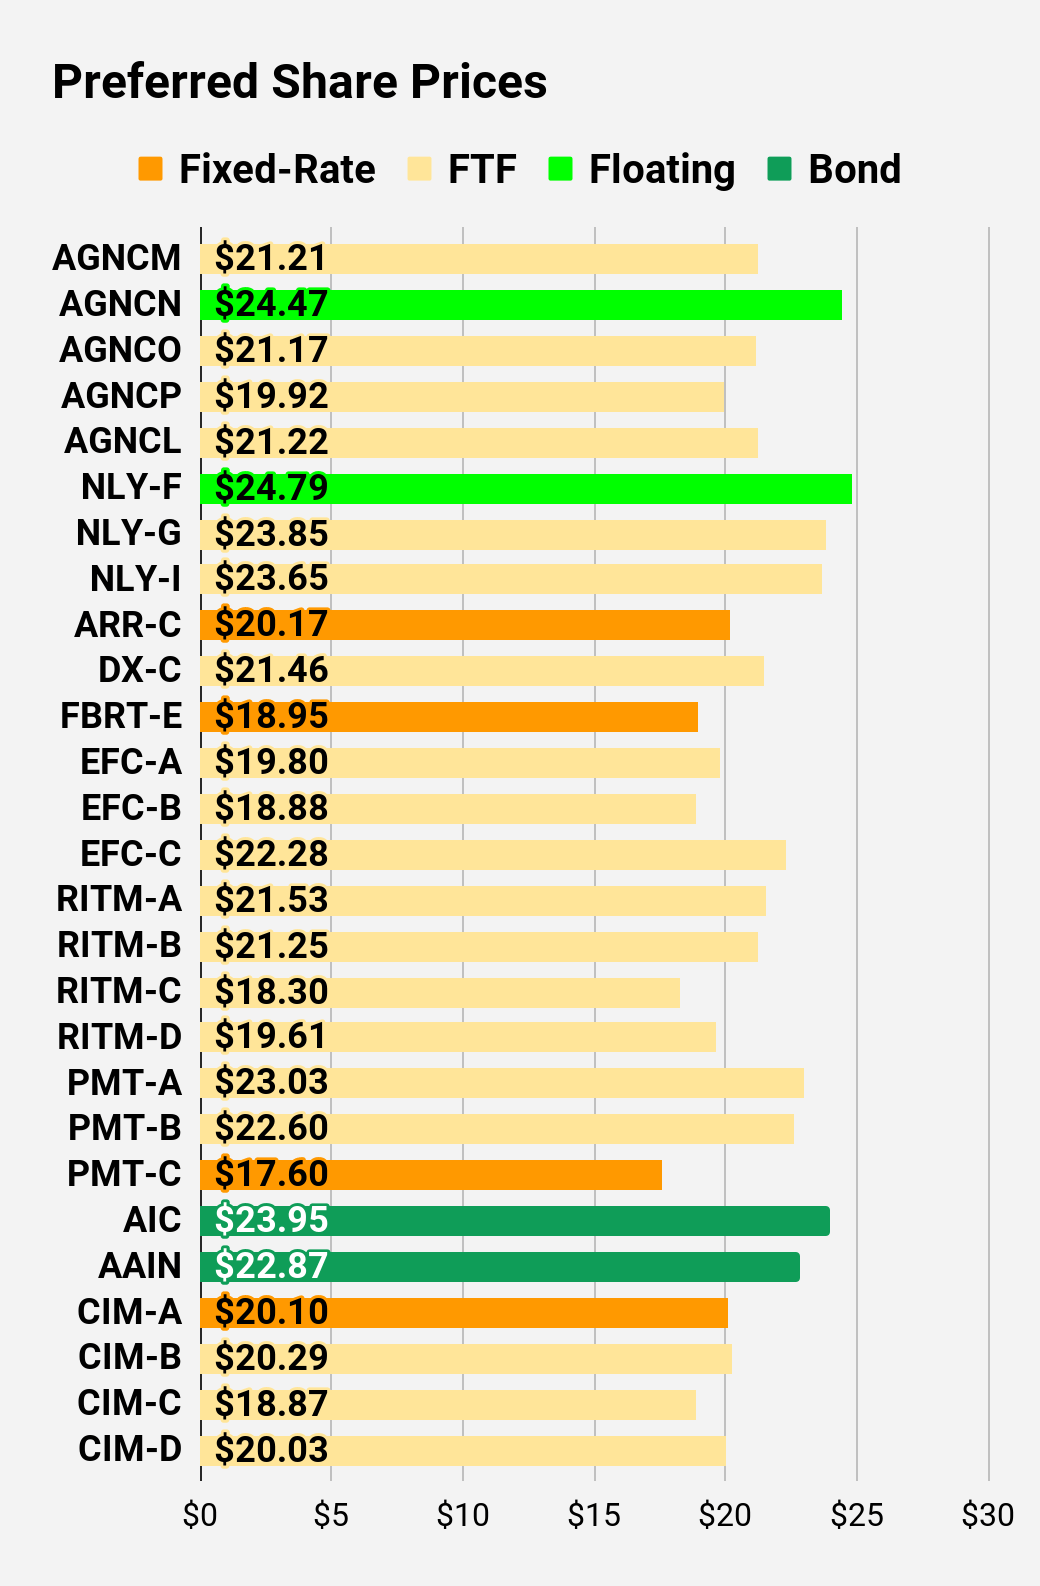
Preferred Share Charts
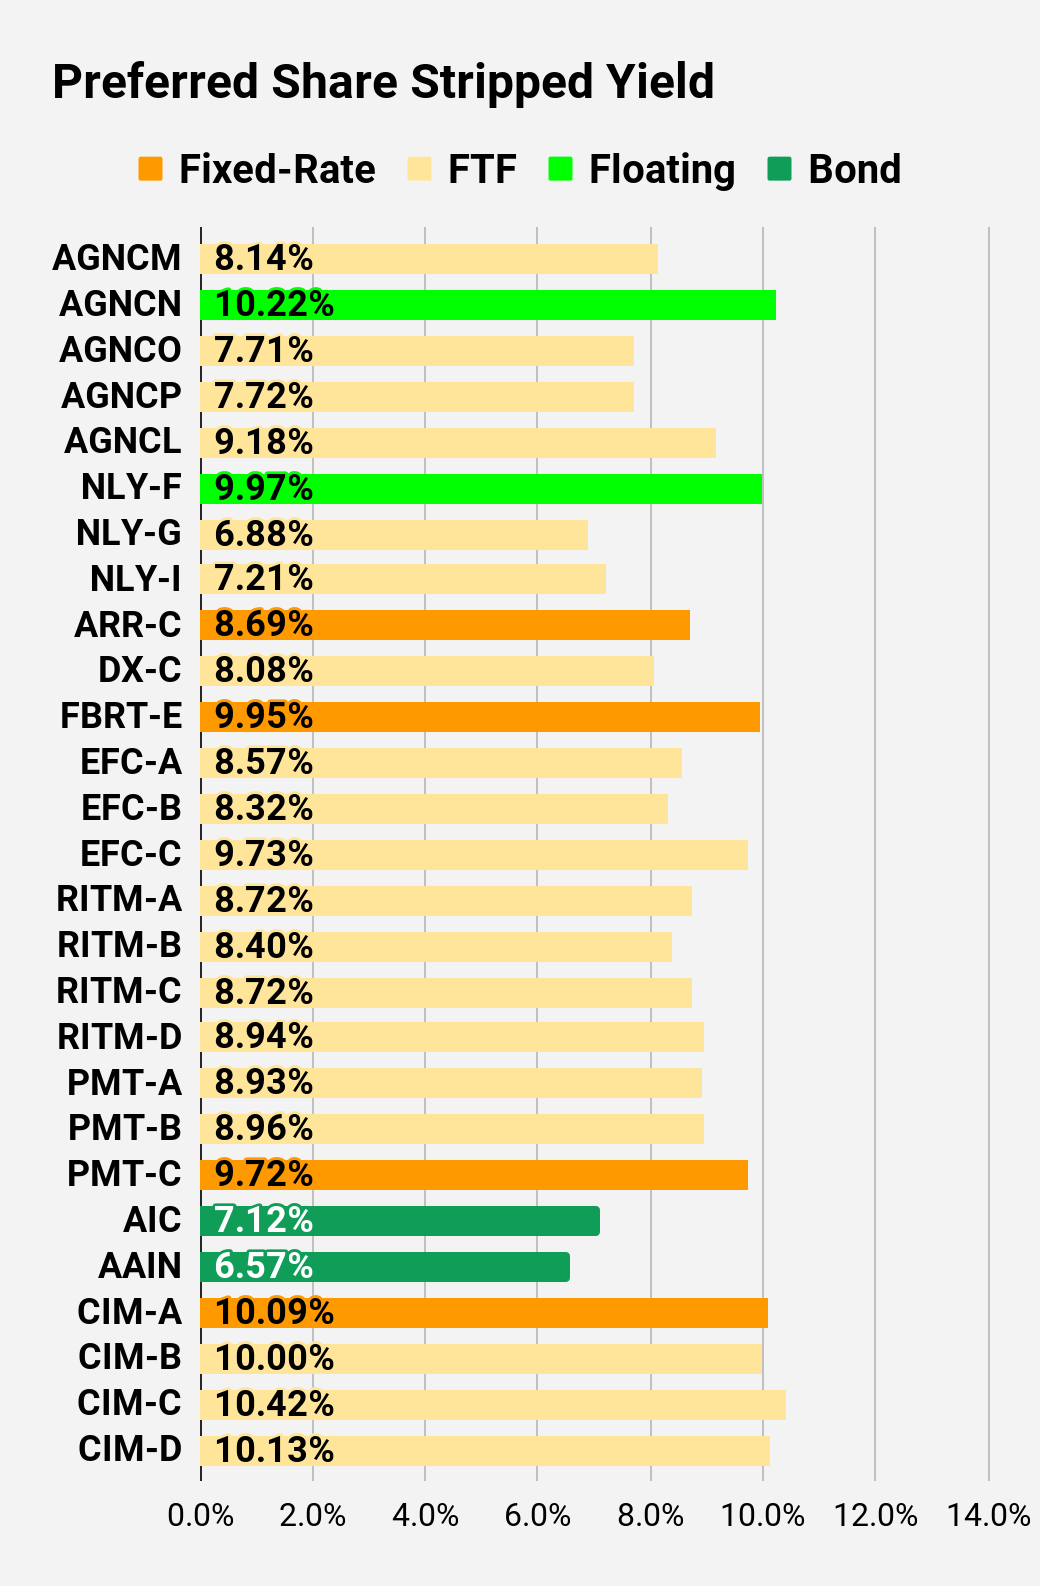
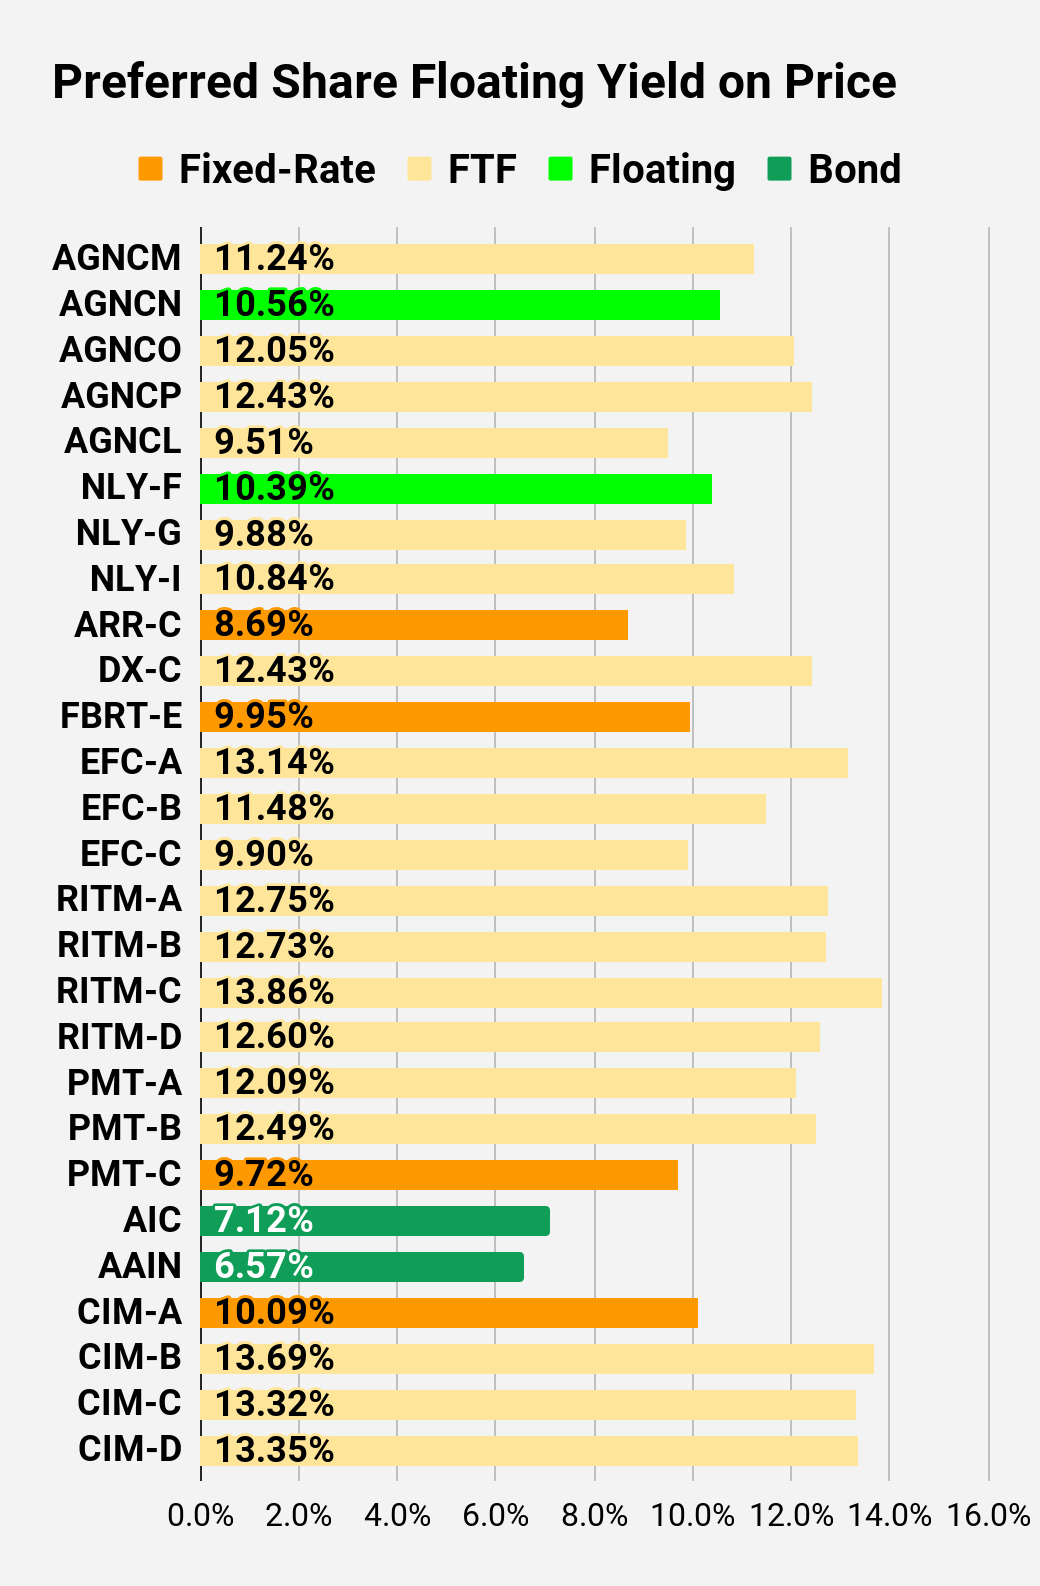
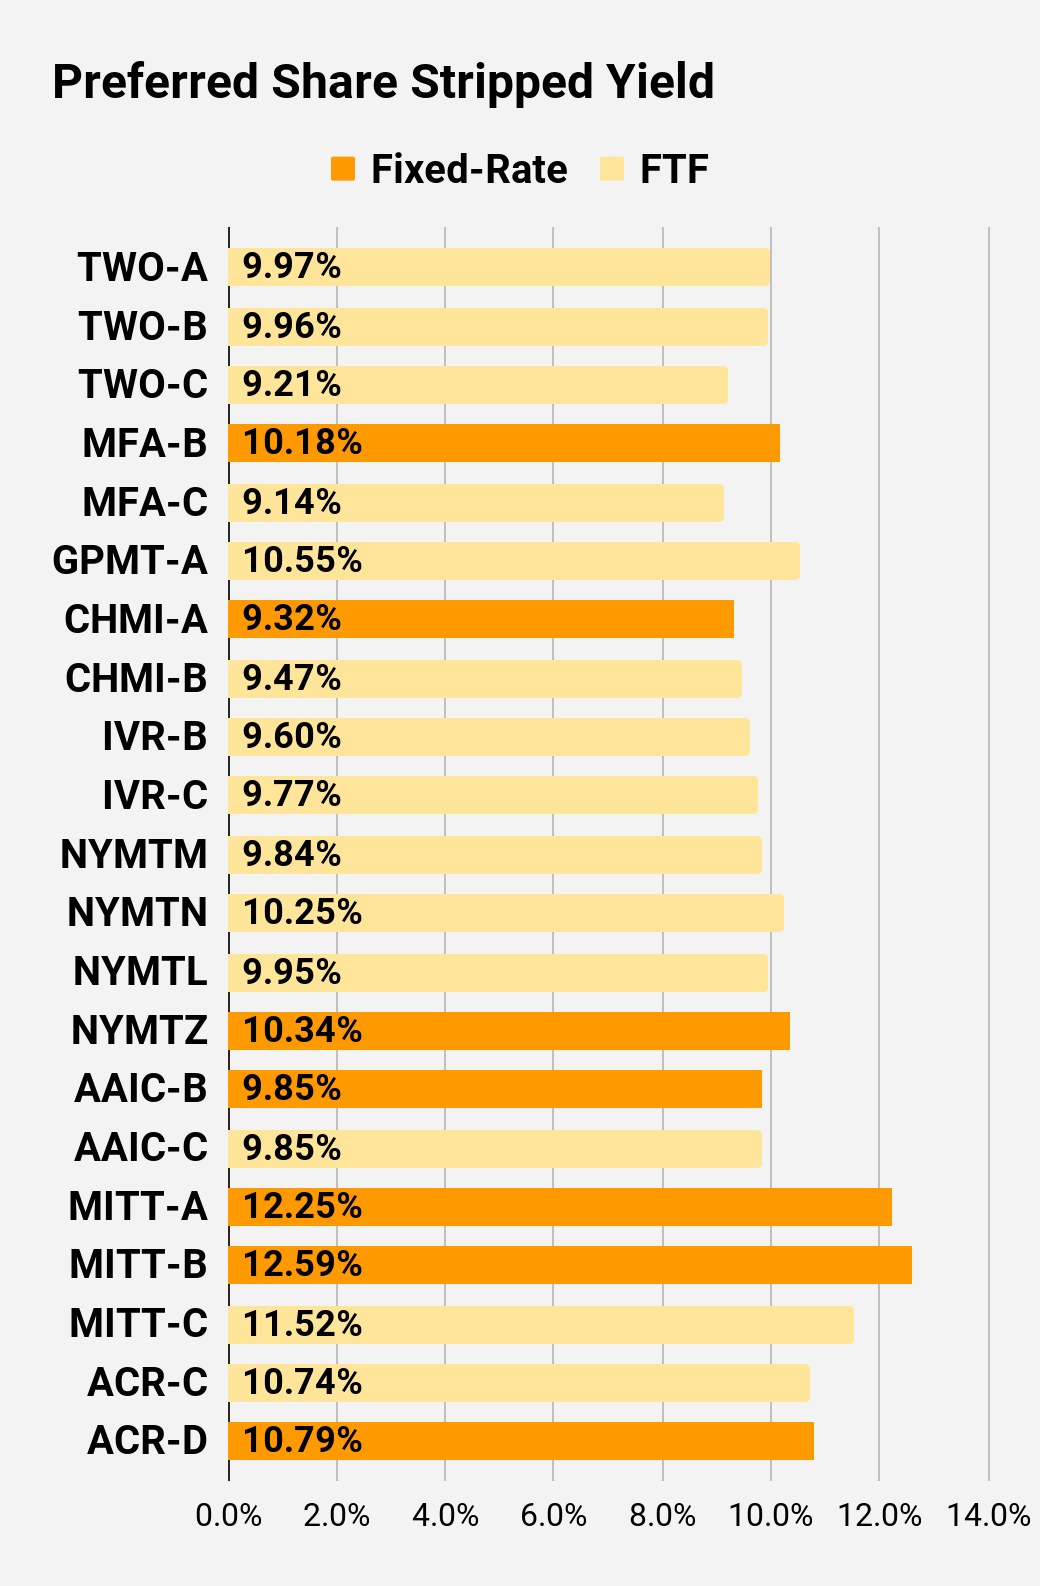
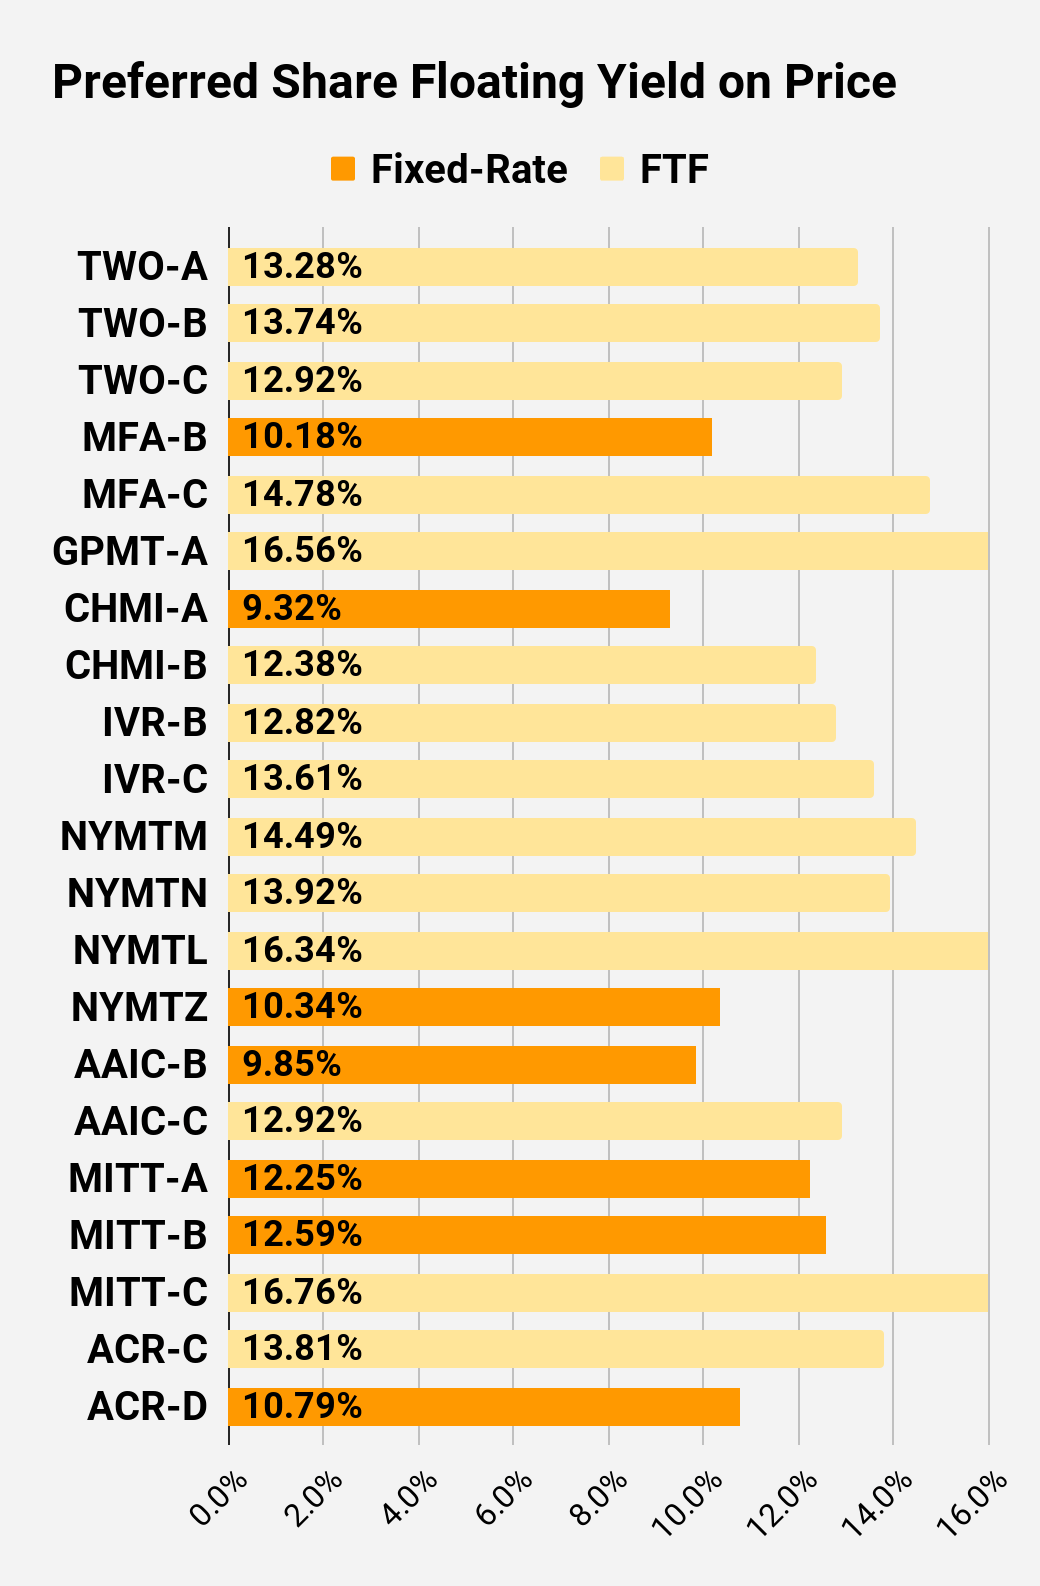
I changed the coloring a bit. We needed to adjust to include that the first fixed-to-floating shares have transitioned over to floating rates. When a share is already floating, the stripped yield may be different from the "Floating Yield on Price" due to changes in interest rates. For instance, NLY-F already has a floating rate. However, the rate is only reset once per three months. The stripped yield is calculated using the upcoming projected dividend payment and the "Floating Yield on Price" is based on where the dividend would be if the rate reset today. In my opinion, for these shares the "Floating Yield on Price" is clearly the more important metric.
Preferred Share Data
Beyond the charts, we're also providing our readers with access to several other metrics for the preferred shares.
After testing out a series on preferred shares, we decided to try merging it into the series on common shares. After all, we're still talking about positions in mortgage REITs. We don't have any desire to cover preferred shares without cumulative dividends, so any preferred shares you see in our column will have cumulative dividends. You can verify that by using Quantum Online. We've included the links in the table below.
To better organize the table, we needed to abbreviate column names as follows:
- Price = Recent Share Price - Shown in Charts
- BoF = Bond or FTF (Fixed-to-Floating)
- S-Yield = Stripped Yield - Shown in Charts
- Coupon = Initial Fixed-Rate Coupon
- FYoP = Floating Yield on Price - Shown in Charts
- NCD = Next Call Date (the soonest shares could be called)
- Note: For all FTF issues, the floating rate would start on NCD.
- WCC = Worst Cash to Call (lowest net cash return possible from a call)
- QO Link = Link to Quantum Online Page
| Ticker |
| Price |
| BoF |
| S-Yield |
| Coupon |
| FYoP |
| NCD |
| WCC |
| QO Link |
| P-Link |
| $21.21 |
| FTF |
| 8.14% |
| 6.88% |
| 11.24% |
| 4/15/2024 |
| $5.52 |
| $24.47 |
| Floating |
| 10.22% |
| 9.94% |
| 10.56% |
| 5/20/2023 |
| $0.78 |
| $21.17 |
| FTF |
| 7.71% |
| 6.50% |
| 12.05% |
| 10/15/2024 |
| $6.28 |
| $19.92 |
| FTF |
| 7.72% |
| 6.13% |
| 12.43% |
| 4/15/2025 |
| $8.15 |
| $21.22 |
| FTF |
| 9.18% |
| 7.75% |
| 9.51% |
| 10/15/2027 |
| $12.51 |
| $24.79 |
| Floating |
| 9.97% |
| 9.75% |
| 10.39% |
| 5/20/2023 |
| $0.55 |
| $23.85 |
| FTF |
| 6.88% |
| 6.50% |
| 9.88% |
| 5/20/2023 |
| $1.38 |
| $23.65 |
| FTF |
| 7.21% |
| 6.75% |
| 10.84% |
| 6/30/2024 |
| $3.47 |
| $20.17 |
| 8.69% |
| 7.00% |
| 8.69% |
| 1/28/2025 |
| $7.90 |
| $21.46 |
| FTF |
| 8.08% |
| 6.90% |
| 12.43% |
| 4/15/2025 |
| $6.99 |
| $18.95 |
| 9.95% |
| 7.50% |
| 9.95% |
| 5/20/2023 |
| $6.22 |
| $19.80 |
| FTF |
| 8.57% |
| 6.75% |
| 13.14% |
| 10/30/2024 |
| $7.74 |
| $18.88 |
| FTF |
| 8.32% |
| 6.25% |
| 11.48% |
| 1/30/2027 |
| $11.99 |
| $22.28 |
| FTF |
| 9.73% |
| 8.63% |
| 9.90% |
| 4/30/2028 |
| $13.52 |
| $21.53 |
| FTF |
| 8.72% |
| 7.50% |
| 12.75% |
| 8/15/2024 |
| $5.83 |
| $21.25 |
| FTF |
| 8.40% |
| 7.13% |
| 12.73% |
| 8/15/2024 |
| $5.99 |
| $18.30 |
| FTF |
| 8.72% |
| 6.38% |
| 13.86% |
| 2/15/2025 |
| $9.51 |
| $19.61 |
| FTF |
| 8.94% |
| 7.00% |
| 12.60% |
| 11/15/2026 |
| $11.54 |
| $23.03 |
| FTF |
| 8.93% |
| 8.13% |
| 12.09% |
| 3/15/2024 |
| $4.01 |
| $22.60 |
| FTF |
| 8.96% |
| 8.00% |
| 12.49% |
| 6/15/2024 |
| $4.91 |
| $17.60 |
| 9.72% |
| 6.75% |
| 9.72% |
| 8/24/2026 |
| $13.22 |
| $23.95 |
| Bond |
| 7.12% |
| 6.75% |
| 7.12% |
| 5/20/2023 |
| $1.34 |
| $22.87 |
| Bond |
| 6.57% |
| 6.00% |
| 6.57% |
| 8/1/2023 |
| $2.50 |
| $20.10 |
| 10.09% |
| 8.00% |
| 10.09% |
| 5/20/2023 |
| $5.26 |
| $20.29 |
| FTF |
| 10.00% |
| 8.00% |
| 13.69% |
| 3/30/2024 |
| $6.80 |
| $18.87 |
| FTF |
| 10.42% |
| 7.75% |
| 13.32% |
| 9/30/2025 |
| $11.07 |
| $20.03 |
| FTF |
| 10.13% |
| 8.00% |
| 13.35% |
| 03/30/2024 |
| $7.06 |
Second Batch:
| Ticker |
| Price |
| BoF |
| S-Yield |
| Coupon |
| FYoP |
| NCD |
| WCC |
| QO Link |
| P-Link |
| $20.42 |
| FTF |
| 9.97% |
| 8.13% |
| 13.28% |
| 04/27/2027 |
| $12.70 |
| $19.18 |
| FTF |
| 9.96% |
| 7.63% |
| 13.74% |
| 07/27/2027 |
| $13.92 |
| $19.73 |
| FTF |
| 9.21% |
| 7.25% |
| 12.92% |
| 1/27/2025 |
| $8.45 |
| $18.67 |
| 10.18% |
| 7.50% |
| 10.18% |
| 5/20/2023 |
| $6.59 |
| $17.99 |
| FTF |
| 9.14% |
| 6.50% |
| 14.78% |
| 3/31/2025 |
| $10.27 |
| $16.69 |
| FTF |
| 10.55% |
| 7.00% |
| 16.56% |
| 11/30/2026 |
| $14.64 |
| $22.11 |
| 9.32% |
| 8.20% |
| 9.32% |
| 5/20/2023 |
| $3.01 |
| $21.91 |
| FTF |
| 9.47% |
| 8.25% |
| 12.38% |
| 4/15/2024 |
| $5.08 |
| $20.44 |
| FTF |
| 9.60% |
| 7.75% |
| 12.82% |
| 12/27/2024 |
| $7.98 |
| $19.45 |
| FTF |
| 9.77% |
| 7.50% |
| 13.61% |
| 9/27/2027 |
| $14.02 |
| $20.12 |
| FTF |
| 9.84% |
| 7.88% |
| 14.49% |
| 1/15/2025 |
| $8.33 |
| $19.62 |
| FTF |
| 10.25% |
| 8.00% |
| 13.92% |
| 10/15/2027 |
| $14.38 |
| $17.38 |
| FTF |
| 9.95% |
| 6.88% |
| 16.34% |
| 10/15/2026 |
| $13.64 |
| $17.02 |
| 10.34% |
| 7.00% |
| 10.34% |
| 1/15/2027 |
| $14.55 |
| $18.01 |
| 9.85% |
| 7.00% |
| 9.85% |
| 5/20/2023 |
| $7.24 |
| $21.24 |
| FTF |
| 9.85% |
| 8.25% |
| 12.92% |
| 3/30/2024 |
| $5.83 |
| $17.14 |
| 12.25% |
| 8.25% |
| 12.25% |
| 5/20/2023 |
| $8.18 |
| $16.18 |
| 12.59% |
| 8.00% |
| 12.59% |
| 5/20/2023 |
| $9.13 |
| $17.65 |
| FTF |
| 11.52% |
| 8.00% |
| 16.76% |
| 9/17/2024 |
| $10.33 |
| $20.20 |
| FTF |
| 10.74% |
| 8.63% |
| 13.81% |
| 7/30/2024 |
| $7.50 |
| $18.35 |
| 10.79% |
| 7.88% |
| 10.79% |
| 5/21/2026 |
| $12.67 |
Strategy
Our goal is to maximize total returns . We achieve those most effectively by including "trading" strategies. We regularly trade positions in the mortgage REIT common shares and BDCs because:
- Prices are inefficient.
- Long term, share prices generally revolve around book value.
- Short term, price-to-book ratios can deviate materially.
- Book value isn't the only step in analysis, but it's the cornerstone.
We also allocate to preferred shares and equity REITs. We encourage buy-and-hold investors to consider using more preferred shares and equity REITs.
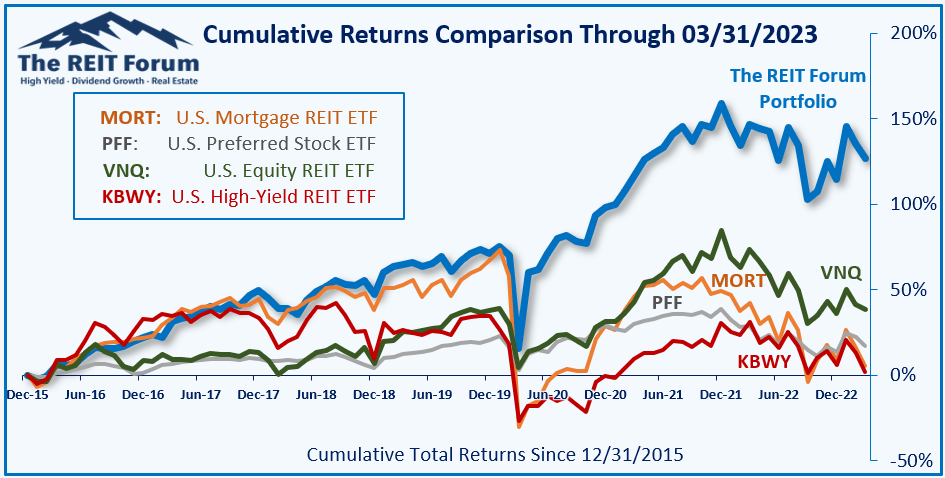
Performance
We compare our performance against four ETFs that investors might use for exposure to our sectors:
The four ETFs we use for comparison are:
| Ticker |
| Exposure |
| One of the largest mortgage REIT ETFs |
| One of the largest preferred share ETFs |
| Largest equity REIT ETF |
| The high-yield equity REIT ETF. Yes, it has been dreadful. |
When investors think it isn't possible to earn solid returns in preferred shares or mortgage REITs, we politely disagree. The sector has plenty of opportunities, but investors still need to be wary of the risks. We can't simply reach for yield and hope for the best. When it comes to common shares, we need to be even more vigilant to protect our principal by regularly watching prices and updating estimates for book value and price targets.
Ratings: NYMTL $17.38 is much better than NYMTN at $19.62. CIM-B at $20.29 is better than CIM-C at $18.87. Picks in this article are AGNCP, RC-E, RITM-D, CIM-B, and NYMTL (for those who couldn't be bothered to read it).
For further details see:
5 Dividend Yields From 7% To 16%