BNL - 5 Prime-Time Net Lease REIT Takeover Targets
2023-11-18 07:00:00 ET
Summary
- Realty Income Corporation recently acquired Spirit Realty Capital, Inc. in a $9.3 billion all-stock deal.
- W.P. Carey announced the spinoff of its office assets into a publicly traded REIT called Net Lease Office Properties.
- The net lease sector is expected to see a surge in M&A activity as smaller firms struggle and costs of capital remain elevated.
There’s been a lot going on in the Net Lease REIT (real estate investment trust) sector lately.
You may recall that recently Realty Income Corporation ( O ) announced it was acquiring Spirit Realty Capital, Inc. (SRC) in a $9.3 billion all stock deal.
Then, just a few days later, Realty Income was at it again, this time announcing its first data center investment with Digital Realty ( DLR ) – an 80% equity stake in build-to-suit projects.
The there was the VICI Properties' ( VICI ) $439 investment in 38 bowling entertainment centers leased to Bowlero ( BOWL ).
Finally, a few weeks ago W. P. Carey ( WPC ) announced that it was spinning off the majority of its office assets into a publicly traded REIT called Net Lease Office Properties ( NLOP ).
Of course, many investors (including me) were not happy to hear that WPC decided to reset (or cut) the dividend.
Now that’s a lot of net lease news to digest, which of course has been taking up most of the oxygen in the sector.
Earlier this week I spoke with Agree Realty (ADC) CEO, Joey Agree and he commented,
“We have way too many REITs. Too many banks and too many sell-side analysts… We’re going to see inefficient companies go away. I don’t see a place for REITs sub $3 billion dollars.”
As I pondered Joey’s comment, I began thinking about other possible takeover targets in the net lease sector, and the possibilities for M&A.
The primary advantage for M&A is to enhance value for both the buyer and seller.
Obviously.
It generally involves eliminating a competitor and/or achieving efficiencies.
In addition, cost savings is a critical element because M&A generally reduces redundant jobs.
Knowing all of that, my team is working on several M&A models right now, attempting to forecast outcomes for various deals.
In this current environment, where costs of capital remain elevated and smaller firms are struggling, we expect to see a surge in deals.
Let’s now take a look at 5 net lease REITs that could become takeover targets.
Postal Realty Trust, Inc. ( PSTL )
PSTL is a net-lease real estate investment trust that owns and manages over 1,800 postal facilities which include flex properties, large industrial buildings, and last-mile facilities.
The company owns 527 flex properties that cover 2.9 million interior square feet and makes up approximately 64.29% of their wholly-owned portfolio’s annualized base rent (“ABR”).
PSTL owns 906 last-mile properties which cover 1.2 million interior SF and makes up 25% of their owned portfolio’s ABR, and the REIT owns 5 industrial properties that cover 1.6 million interior SF and makes up 10.53% of their owned portfolio’s ABR.
Postal Realty’s core focus is on postal properties, and it is the only publicly listed REIT with this singular focus. PSTL’s owned portfolio includes 1,439 properties located across 49 states which are primarily leased to the United States Postal Service (“USPS”).
The postal properties they own total roughly 5.7 million interior square feet and have a weighted average remaining lease term of approximately 3 years and a portfolio occupancy of 99.7%.
Postal Realty released its third quarter operating results in October and reported total revenues of $16.1 million during the third quarter, compared to $13.8 million for the same period in 2022.
Funds from operations (“FFO”) came in at $6.3 million, or $0.25 per share, compared to $5.8 million, or $0.25 per share during the third quarter of 2022. Adjusted FFO (“AFFO”) was reported at $6.9 million, or $0.27 per share, compared to $6.1 million, or $0.26 per share in 3Q-22.
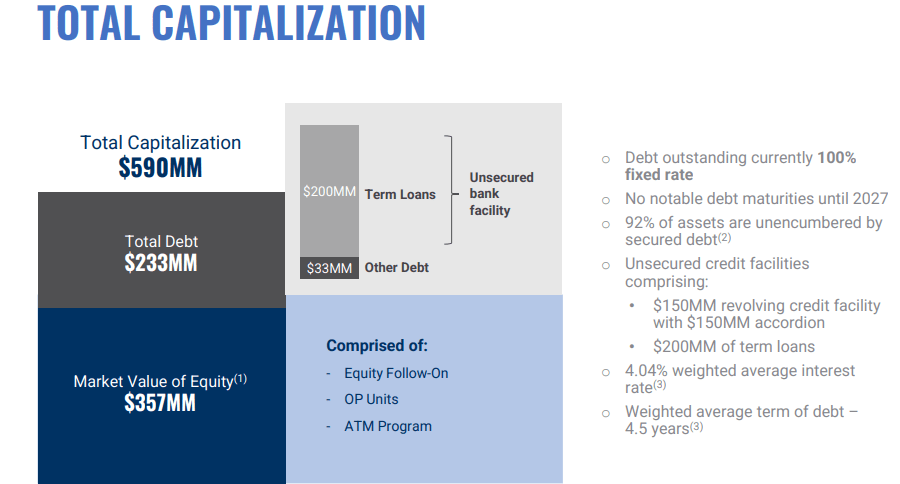
PSTL also provided an update on their financial health and disclosed that the company had roughly $2.8 million of cash on hand and property related reserves and full availability on their $150 million revolving credit facility.
Their debt has a weighted average interest rate of 4.04% and a weighted average term to maturity of 4.5 years. When factoring in interest rate hedges, 100% of PSTL’s debt is set to a fixed rate and they have no material debt maturities until 2027.
Additionally, PSTL ended the quarter with a conservative amount of leverage with a net debt to adjusted EBITDA ratio of 5.5x.
Postal Realty has been operating since the early 1980’s but only filed its initial public offering in 2019. Since 2020, PSTL has had a blended average AFFO growth rate of 1.92% and an average dividend growth rate of 8.21% over the past 2 years.
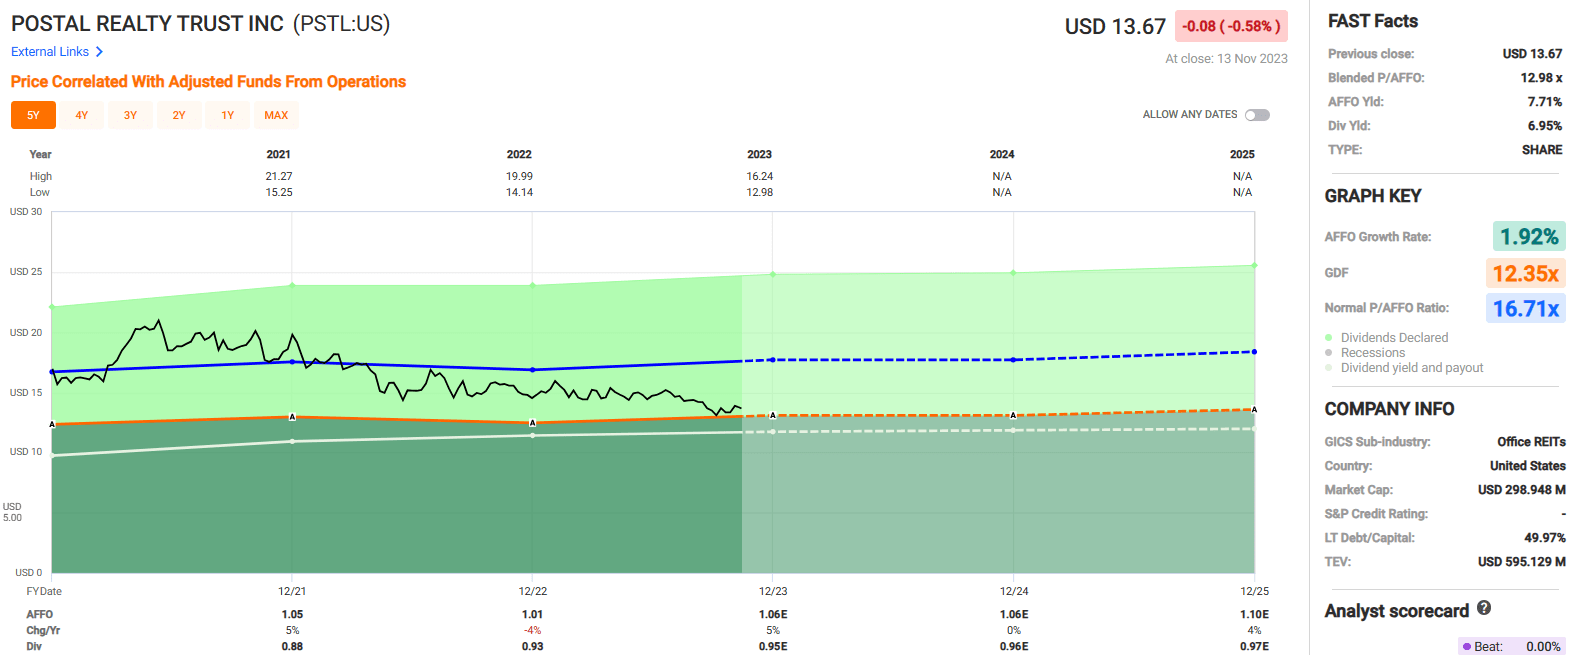
The company pays a 6.95% dividend yield, but their 2022 year-end AFFO payout ratio is somewhat on the high side at 91.58%.
For the full year in 2023, analysts expect AFFO to come in at $1.06 per share and for the company to pay a dividend of $0.95 per share which would put the 2023 expected AFFO payout ratio at 89.62%.
Currently PSTL is trading at a blended P/AFFO of 12.98x, which is a discount when compared to their normal AFFO multiple of 16.71x.
We rate Postal Realty Trust a Spec Buy.
Getty Realty Corp. ( GTY )
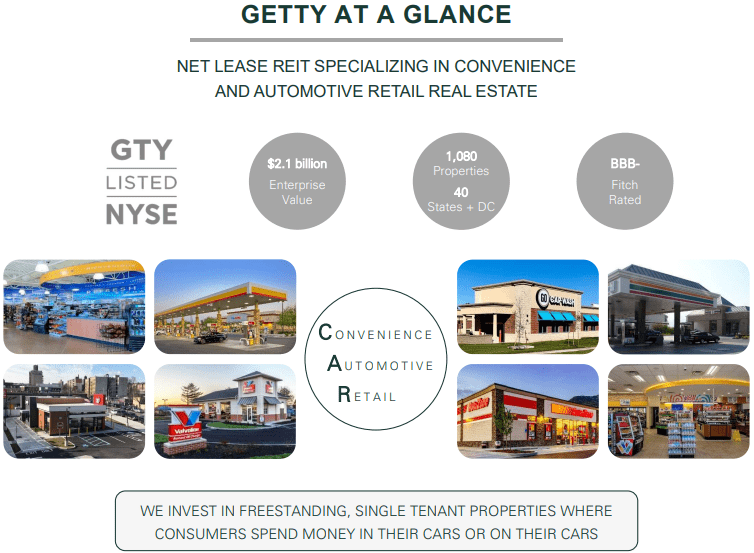
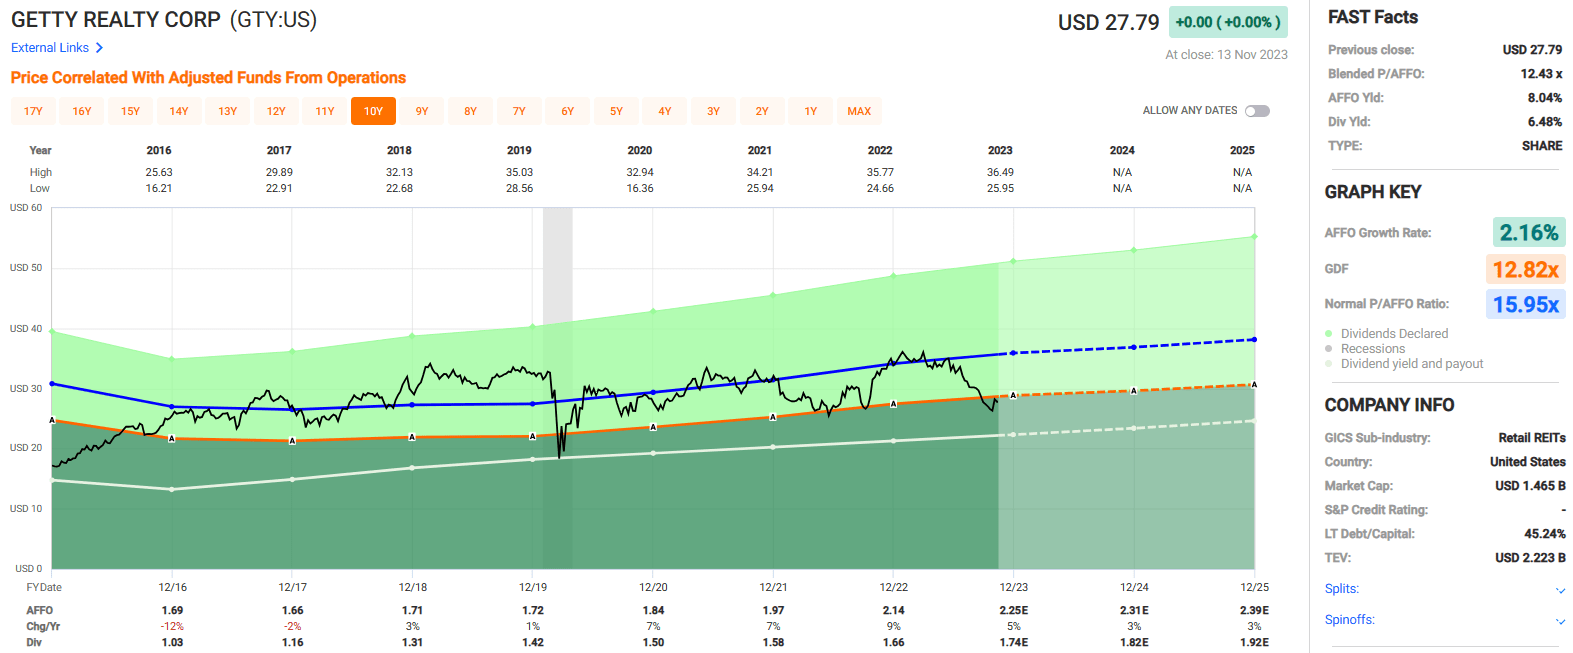
Getty Realty is a net-lease REIT that specializes in acquiring and developing free-standing, single-tenant properties that are related to convenience and automotive real estate.
GTY has a focus on convenience and automotive properties which are essential businesses and are resistant to both e-commerce and recessions. The types of properties GTY targets are convenience stores, gas stations, legacy gas & repair, auto service, and auto parts.
Based on ABR, their largest property type is convenience and gas which makes up 68.5% of their ABR, followed by car washes and legacy gas & repair which makes up 16.8% and 9.8% of their ABR, respectively.
Some of the attributes GTY looks for in a property include buildings that range between 3,000 and 5,000 square feet, properties with corner locations and high traffic counts, and properties that have an alternative use potential.
GTY’s portfolio consists of 1,080 free-standing properties located across 40 states and Washington, D.C. The properties are 99.7% occupied and have a weighted average lease term of approximately 9.0 years.
Getty Realty released its third quarter operating results in October and reported total revenues during the quarter of $50.5 million, compared to total revenues of $42.0 million in the third quarter of 2022.
FFO was reported at $27.7 million, or $0.53 per share in 3Q-23, compared to FFO of $23.7 million, or $0.50 per share in 3Q-22. AFFO during the third quarter was reported at $29.4 million, or $0.57 per share, compared to AFFO of $25.8 million, or $0.54 per share for the same period in 2022.
During the quarter, GTY invested approximately $155.0 million across 50 properties and had a committed investment pipeline of over $95.0 million for the acquisition and development of 42 automotive retail and convenience store properties.
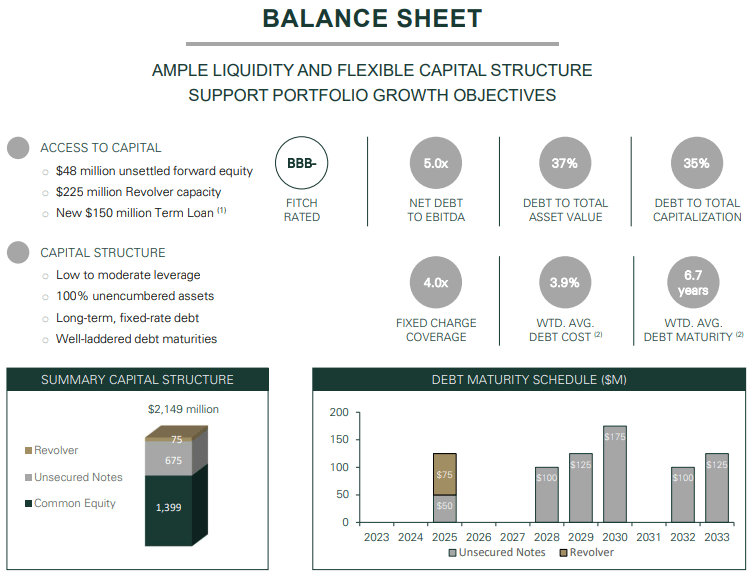
GTY provided several debt metrics including a weighted average interest rate of 3.9% and a weighted average term to maturity of 6.7 years. Additionally, the company has a net debt to EBITDA of 5.0x, a debt to total asset value ratio of 37%, and a fixed charge coverage ratio of 4.0x. At the end of the quarter, GTY had $8.9 million in cash and equivalents and $225 million available to them under their unsecured revolving credit facility.
Since 2016 GTY has had a blended average AFFO growth rate of 2.16% and an average dividend growth rate of 5.65%. Analysts expect AFFO per share to increase by 5% in 2023, and then increase by 3% in both 2024 and 2025.
GTY pays a 6.48% dividend yield that is well-covered with a 2022 year-end AFFO payout ratio of 77.57% and a 2023 expected AFFO payout ratio of 77.33%.
The stock is currently trading at a P/AFFO of 12.43x, which compares favorably to their normal AFFO multiple of 15.95x.
We rate Getty Realty a Spec Buy.
Four Corners Property Trust, Inc. ( FCPT )
FCPT was originally formed in 2015 as a wholly owned subsidiary of Darden Restaurants ( DRI ) to acquire and own net lease properties related to the restaurant and food service industries.
Later that same year, Darden completed a spin-off of FCPT to make Four Corners Property Trust a standalone net lease REIT.
As part of the spinoff, FCPT received 418 properties operating under 5 brands including Olive Garden and LongHorn Steakhouse.
Since that time, FCPT has grown their property count from 418 to 1,106, expanded their brands from 5 to 148, and increased their annual base rent from $94.4 million to approximately $215.3 million as of September 30, 2023.
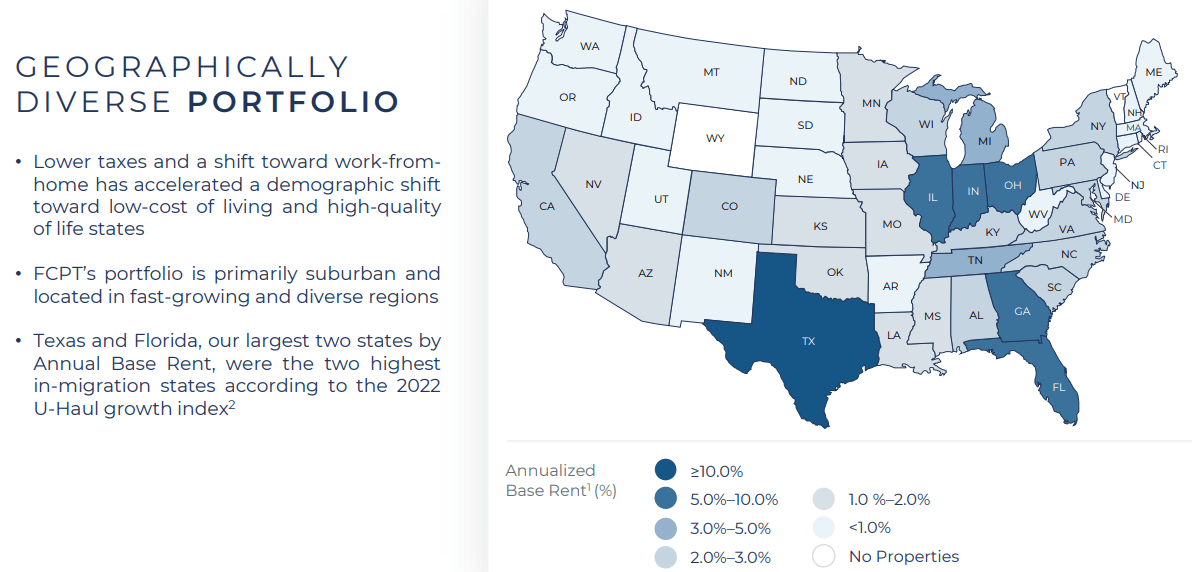
FCPT is one of the leading owners of restaurant and other retail real estate in the U.S., with a portfolio of 1,106 owned properties covering 7.5 million square feet across 47 states. The average remaining lease term is 8 years and the occupancy rate is 99.8%.
Their portfolio is geographically diversified across the U.S., but as a percentage of annualized base rent their largest presence is in Texas, Florida, Georgia, Illinois, Indiana, and Ohio.
Since its inception FCPT has actively made steps to further diversify its portfolio. When the company was initially spun-off in 2015 they had a single tenant (Darden Restaurants), but now have multiple tenants operating under 148 separate brands.
Additionally, FCPT has established new verticals with the inclusion of auto service and medical retail properties in their portfolio, which now make up 9% and 7% of their ABR respectively.
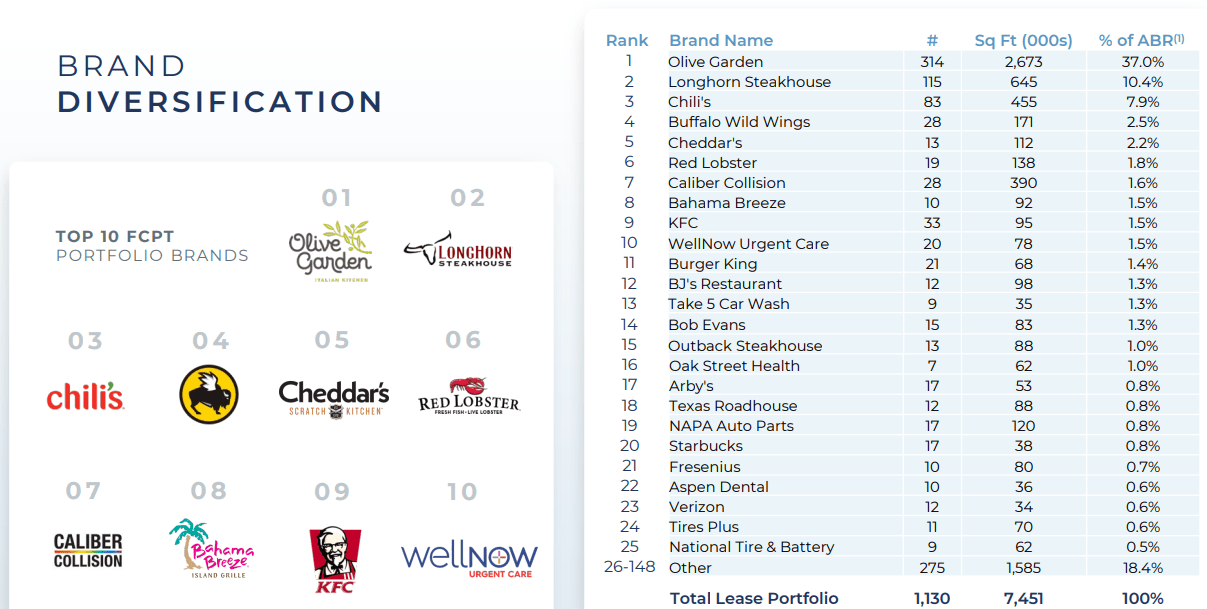
Olive Garden is FCPT’s largest brand and makes up 37% of their ABR, followed by Longhorn Steakhouse which makes up 10.4%, and Chili’s which makes up 7.9% of their ABR.
Other notable brands include KFC, Burger King, Bob Evans, Outback Steakhouse, Arby’s, Starbucks, Aspen Dental, and Tires Plus.
Their 2 largest brands, Olive Garden and Longhorn Steakhouse, are both owned by Darden and as of their most recent update Darden made up 52% of their ABR, down from 100% in 2015.
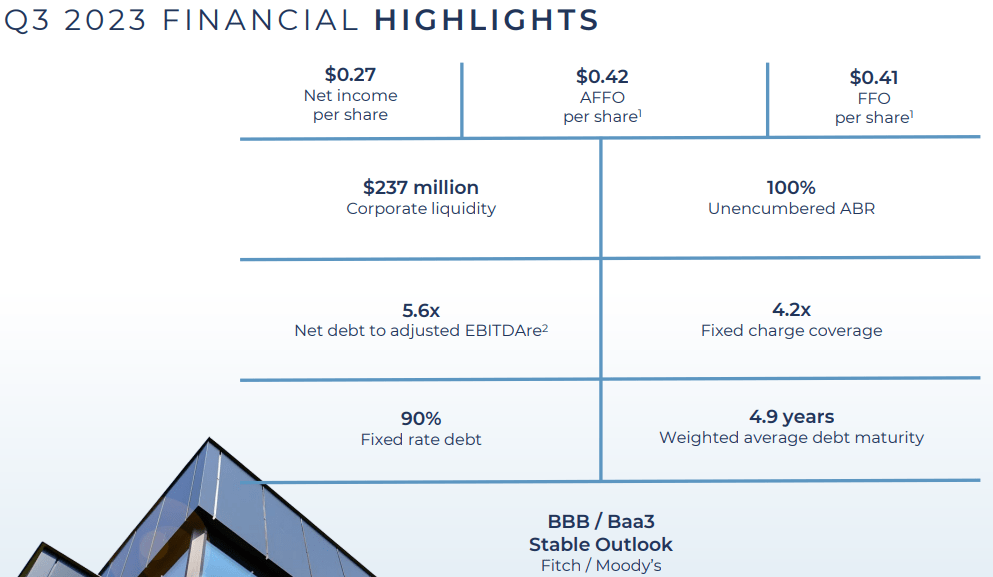
On November 1 st FCPT released their third quarter operating results and reported total revenues during the quarter of $64.8 million, compared to total revenues of $56.0 million in the third quarter of 2022.
NAREIT FFO was reported at $37.3 million, or $0.41 per share in 3Q-23, compared to FFO of $33.3 million, or $0.40 per share in 3Q-22.
AFFO during the quarter came in at 38.0 million, or $0.42 per share, compared to AFFO of $33.8 million, or $0.41 per share during the third quarter of 2022.
During the quarter, FCPT acquired 31 properties for $130.2 million at an initial weighted average cash yield of 6.4% and a weighted average lease term of 12.1 years and sold 2 properties for approximately $11.2 million.
FCPT provided updates on its financial position with $237 million of available liquidity and a net debt to adjusted EBITDAre of 5.6x.
FCPT has an investment-grade balance sheet with a Baa3 credit rating from Moody’s and solid debt metrics, including a fixed charge coverage ratio of 4.2x and a long-term debt to capital ratio of 42.17%.
Additionally, their debt is 90% fixed rate with a weighted average term to maturity of 4.9 years.
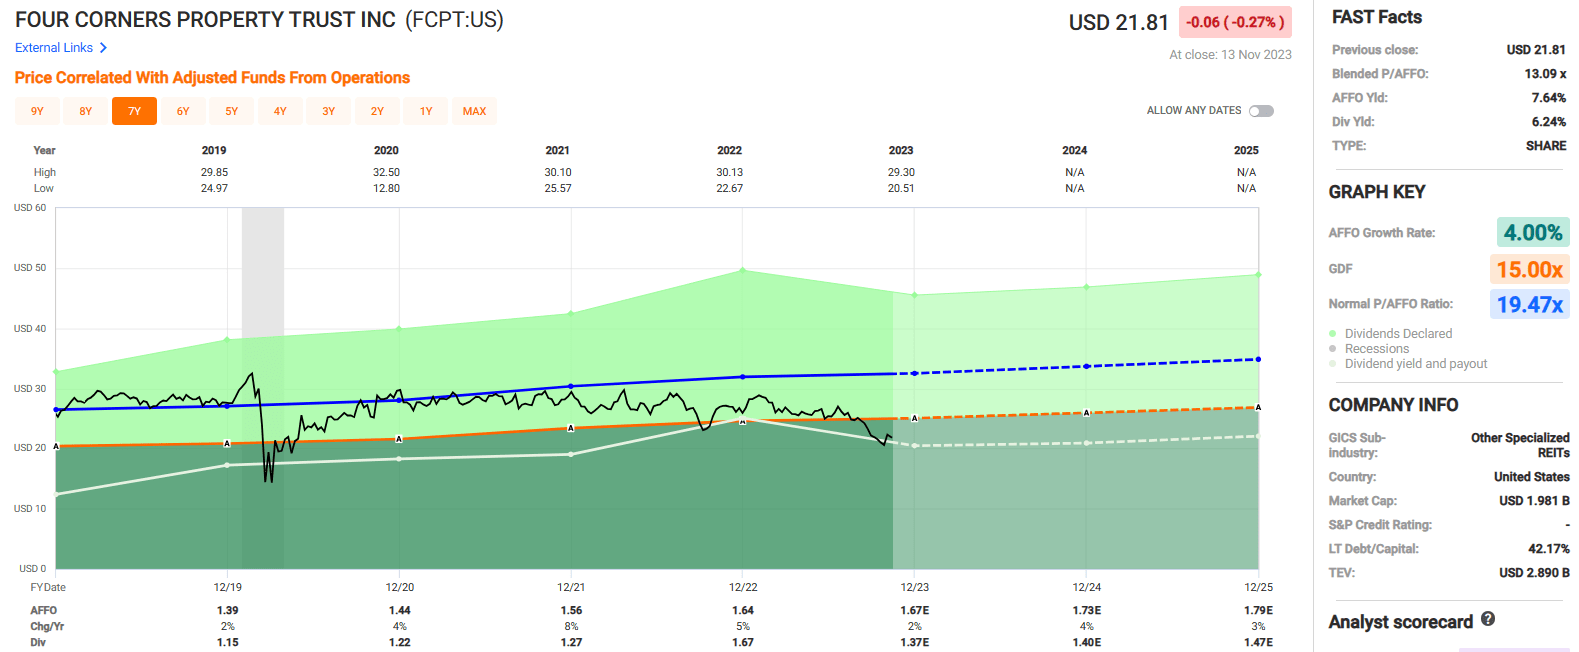
Since 2019 FCPT has had a blended average AFFO growth rate of 4.00% and an average dividend growth rate of 20.27%.
While the dividend growth has been impressive, FCPT ended 2022 with an AFFO payout ratio of 101.83%.
Their 2023 expected AFFO payout ratio is closer to 82% so from that perspective the dividend is currently covered and pays a high yield of 6.24%.
Currently the stock is trading at a P/AFFO of 13.09x, which is a sharp discount compared to their normal AFFO multiple of 19.47x.
We rate Four Corners Property Trust a Buy.
Broadstone Net Lease, Inc. ( BNL )
Broadstone is a diversified REIT that primarily invests in single-tenant commercial real estate that is net leased to a diversified group of tenants operating across multiple property types including industrial, restaurants, healthcare, office, and retail.
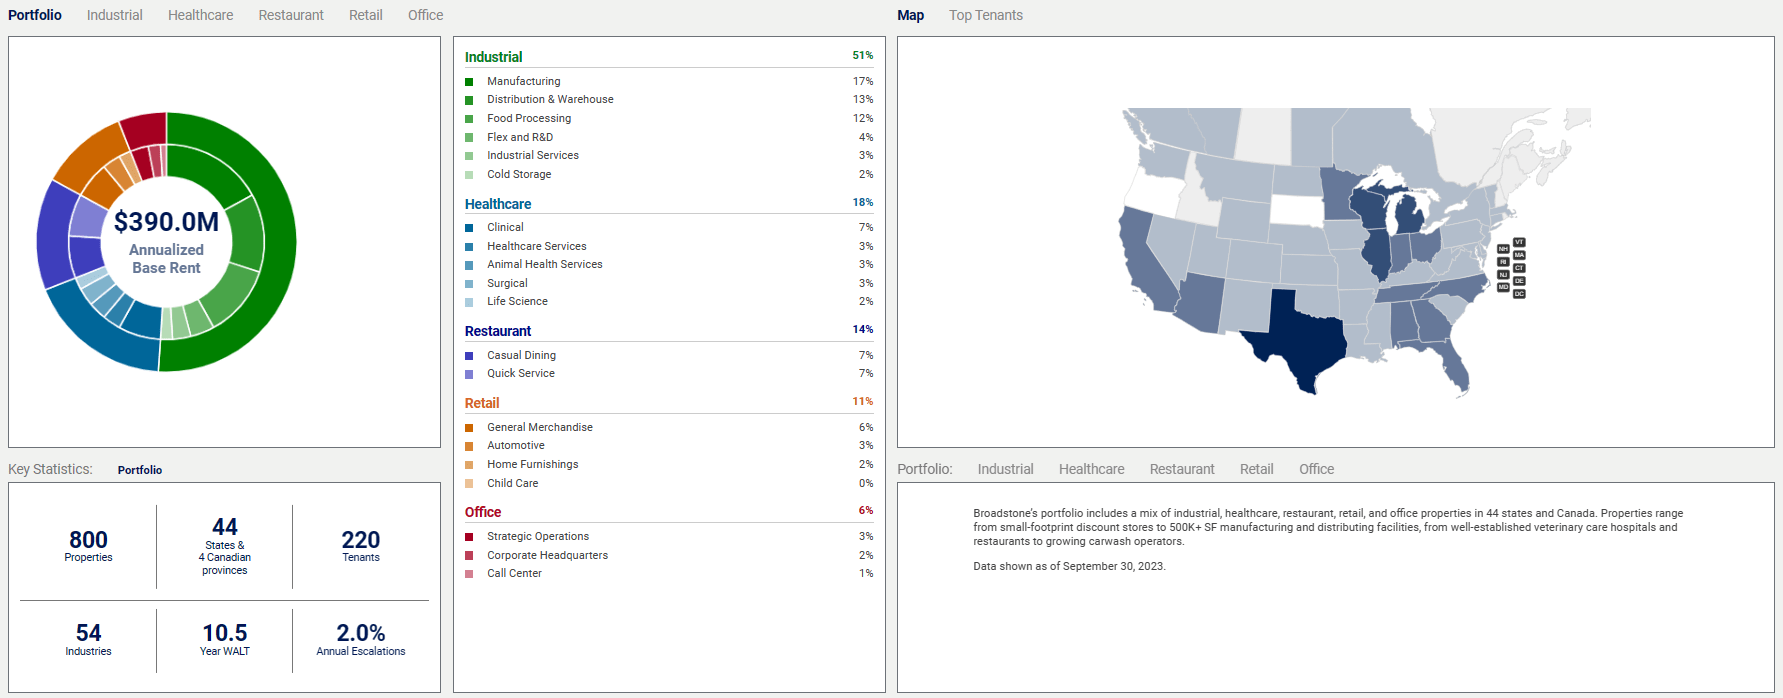
While BNL invests in several property types, the REIT is industrial-focused with their industrial properties making up 51% of their portfolio ABR.
Healthcare is their next largest property type, making up 18% of their portfolio ABR, followed by restaurants which makes up 14%, and retail and office which makes up 11% and 6% respectively.
Broadstone owns a diversified portfolio that includes 800 net leased commercial properties and covers approximately 38.2 million rentable square feet (“RSF”) across 44 states within the U.S. and 4 Canadian provinces.
The majority of their properties are in the U.S. (793 properties), although they also own 7 properties in Canada. BNL is well diversified by tenant and has 220 tenants operating in 54 industries.
Their top tenant only makes up 4.0% of their ABR and their top 10 tenants combined makes up 19.3% of their ABR. At the end of the third quarter, BNL’s properties were 99.4% leased and had a weighted average lease term (“WALT”) of 10.5 years.
On November 1 st BNL released their third quarter operating results and reported revenues during the quarter of $109.5 million, compared to revenue of $103.5 million for the same period in 2022.
Core FFO was reported at $74.8 million, or $0.38 per share, compared to Core FFO of $66.7 million, or $0.36 per share in the third quarter of 2022.
Adjusted FFO during 3Q-23 was reported at $70.0 million, or $0.36 per share, compared to adjusted FFO of $63.4 million, or $0.35 per share in 3Q-22.
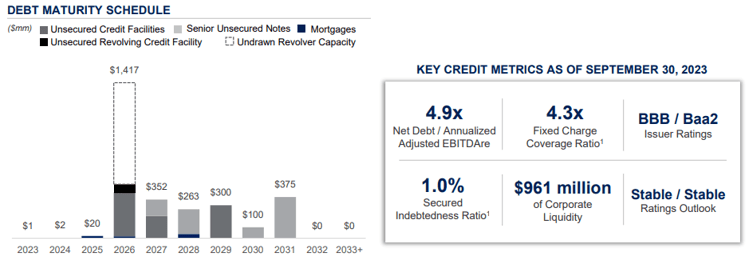
BNL - IR
Broadstone Net Lease also provided several debt metrics including a net debt to adjusted EBITDAre ratio of 4.9x and a fixed charge coverage ratio of 4.3x.
Additionally, BNL had $961.0 million of corporate liquidity at the end of the third quarter and no significant debt maturities until 2026.
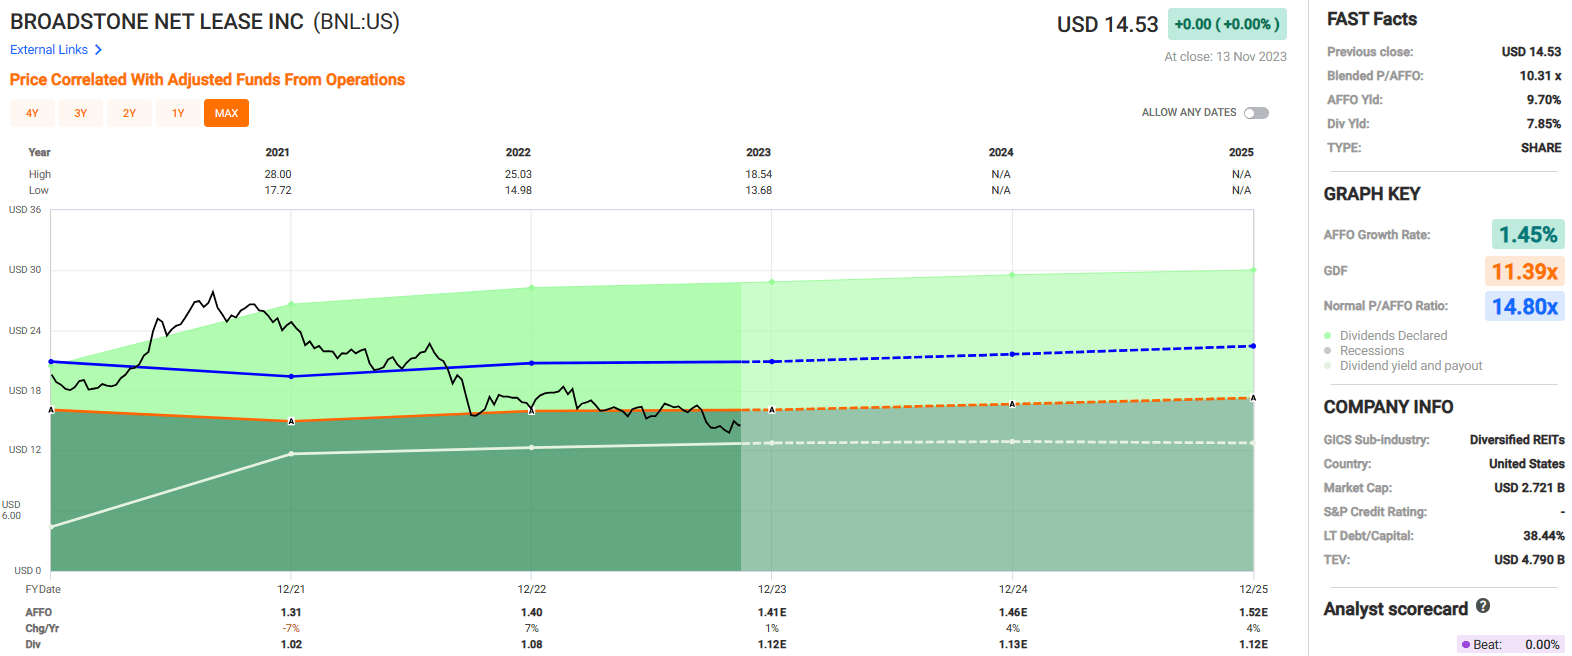
Broadstone Net Lease was formed in 2007 but has only been a publicly traded company since 2020, when they filed their initial public offering (“IPO”). Since 2021, BNL has had a blended average AFFO growth rate of 1.45%.
Analysts expect modest AFFO growth in 2023 with projections for AFFO to increase by 1%, but the REIT is projected to grow AFFO per share by 4% in both 2024 and 2025.
BNL pays a 7.85% dividend yield that is well covered with a 2022 year-end AFFO payout ratio of 77.14% and an expected 2023 year-end AFFO payout ratio of 79.43%. In 2022 the company increased its dividend by 5.37% and analysts expect the dividend to grow by 3.7% in 2023.
Currently the stock is trading at a P/AFFO of 10.31x, which is a sizable discount when compared to their average AFFO multiple of 14.80x.
We rate Broadstone Net Lease a Spec Buy.
Alpine Income Property Trust, Inc. ( PINE )
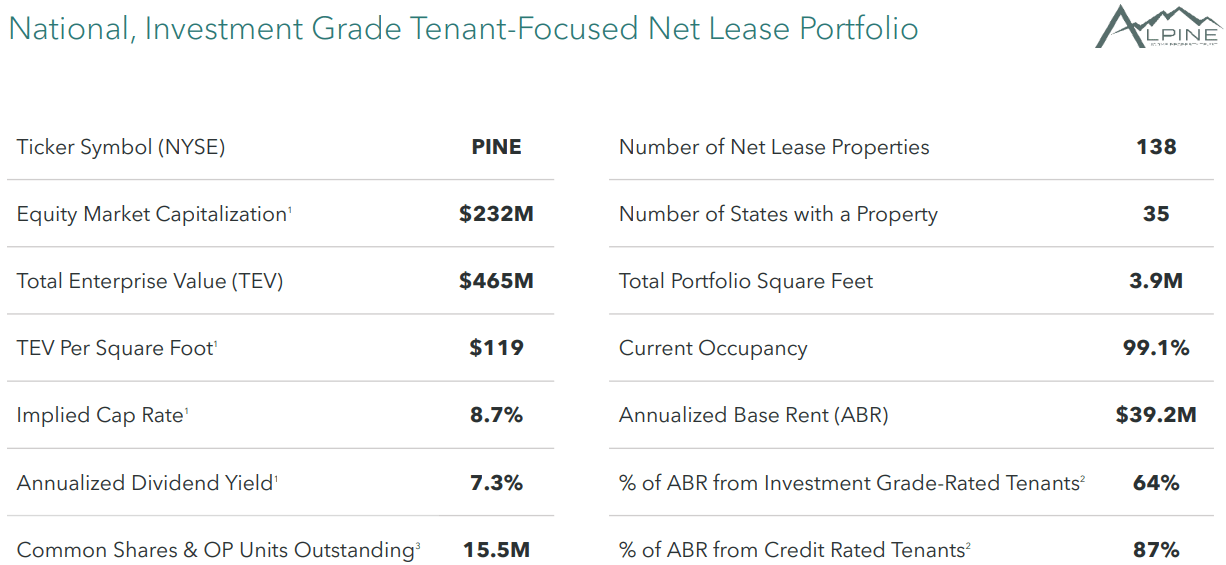
PINE is an externally managed net lease REIT that owns and operates a portfolio of single-tenant commercial properties that are primarily leased to publicly traded companies and credit rated tenants on a long-term, triple-net basis.
CTO Realty Growth ( CTO ) is PINE’s external manager. While normally I would advise caution when looking at an externally managed equity REIT, in this case there is high-alignment between CTO and PINE. The external manager has invested approximately $34.0 million in PINE and has a 15% ownership position in the net lease REIT.
PINE’s portfolio consists of 138 net lease properties covering 3.9 million square feet across 35 states within the U.S. Their net-lease portfolio generates $39.2 million in annualized base rent (“ABR”) and 87% of their ABR comes from credit rated tenants, while 64% of their ABR comes from investment-grade rated tenants.
As of the end of the third quarter, PINE had a portfolio occupancy of 99.1% with a weighted average remaining lease term of 7.1 years.
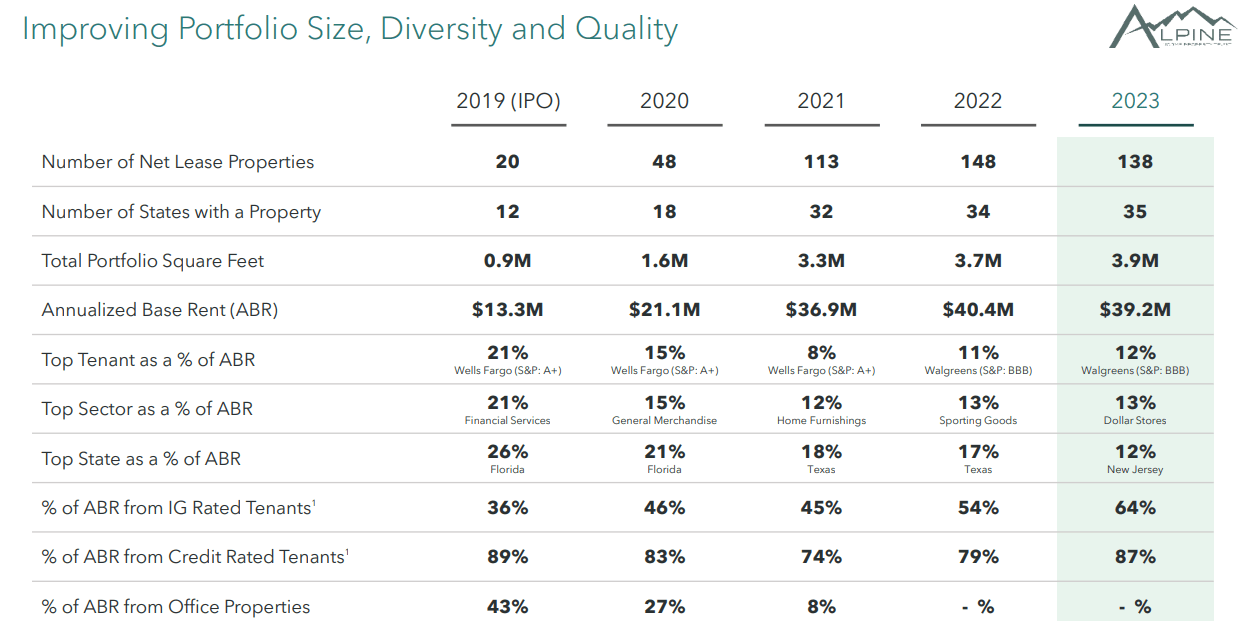
Since its IPO in 2019 PINE has improved its portfolio size and diversity. From 2019 to 2023, PINE’s net lease properties grew from 20 to 138, their number of states increased from 12 to 35, their portfolio SF increased from 0.9 million to 3.9 million SF, and their ABR grew from $13.3 million in 2019 to $39.2 million in 2023. Additionally, PINE has reduced its office exposure from 43% of ABR in 2019 to 0% of ABR in 2023.
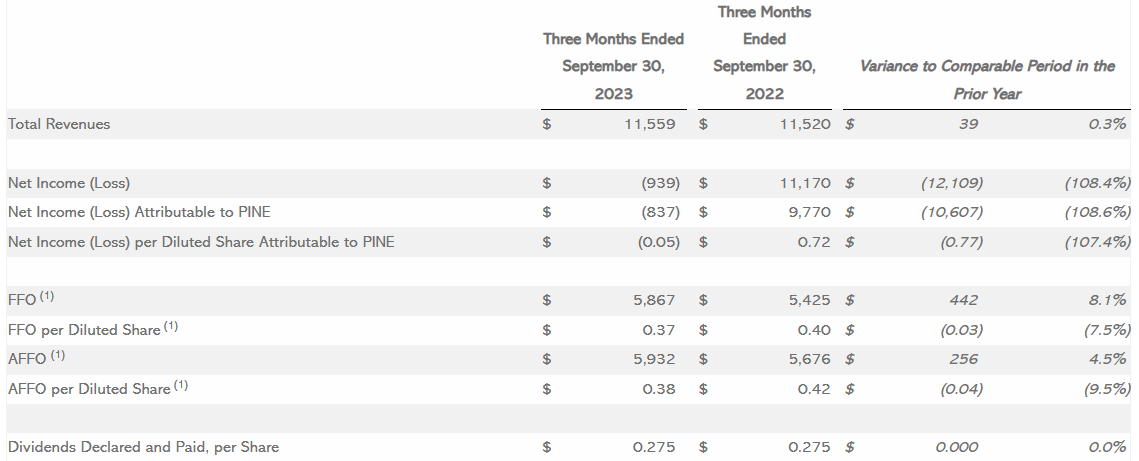
PINE released its third quarter operating results in October and reported total revenue during the quarter of $11.6 million, compared to total revenue of $11.5 million in the third quarter of 2022.
FFO was reported at $5.9 million, or $0.37 per share, compared to FFO of $5.4 million, or $0.40 per share for the same period in 2022. AFFO during the quarter was reported at $5.9 million, or $0.38 per share, compared to $5.7 million, or $0.42 per share in the third quarter of 2022.
On a per share basis, the third quarter year-over-year change represents a -7.5% decrease in FFO and a -9.5% decrease in AFFO.
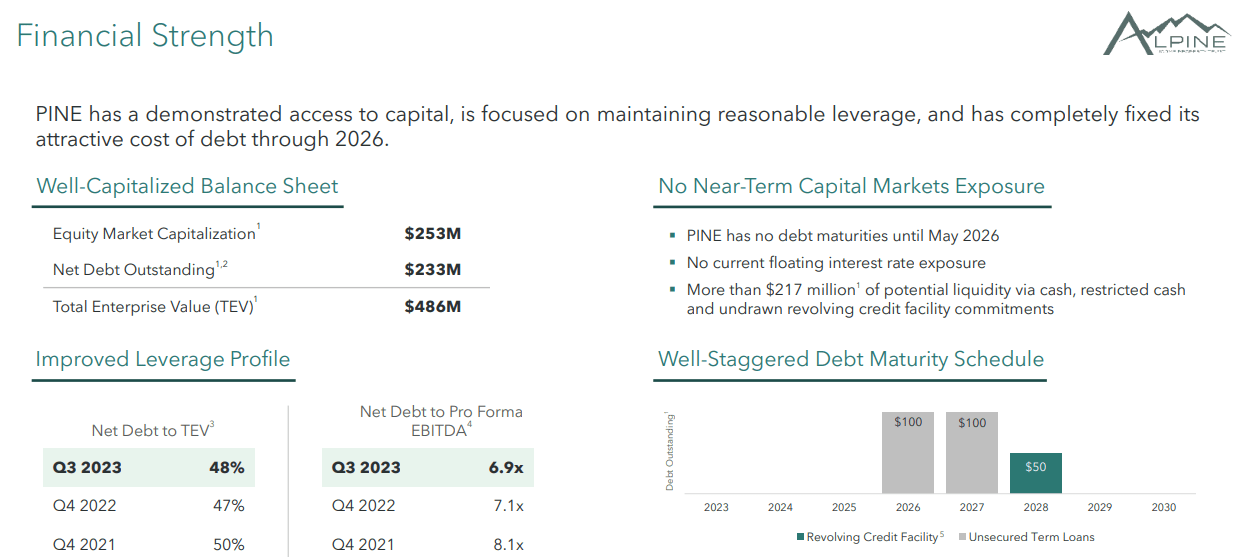
At the end of the third quarter PINE reported a net debt to total enterprise value of 48% and a net debt to pro forma EBITDA of 6.9x.
While a net debt to EBITDA of 6.9x is a little higher than I’d like to see, this debt metric has improved over the past several years. The leverage ratio was 7.1x in 4Q-22 and 8.1x in 4Q-21.
Additionally, PINE has no floating interest rate exposure, no debt maturities until 2026, and as of their most recent update the company had over $217 million of potential liquidity.
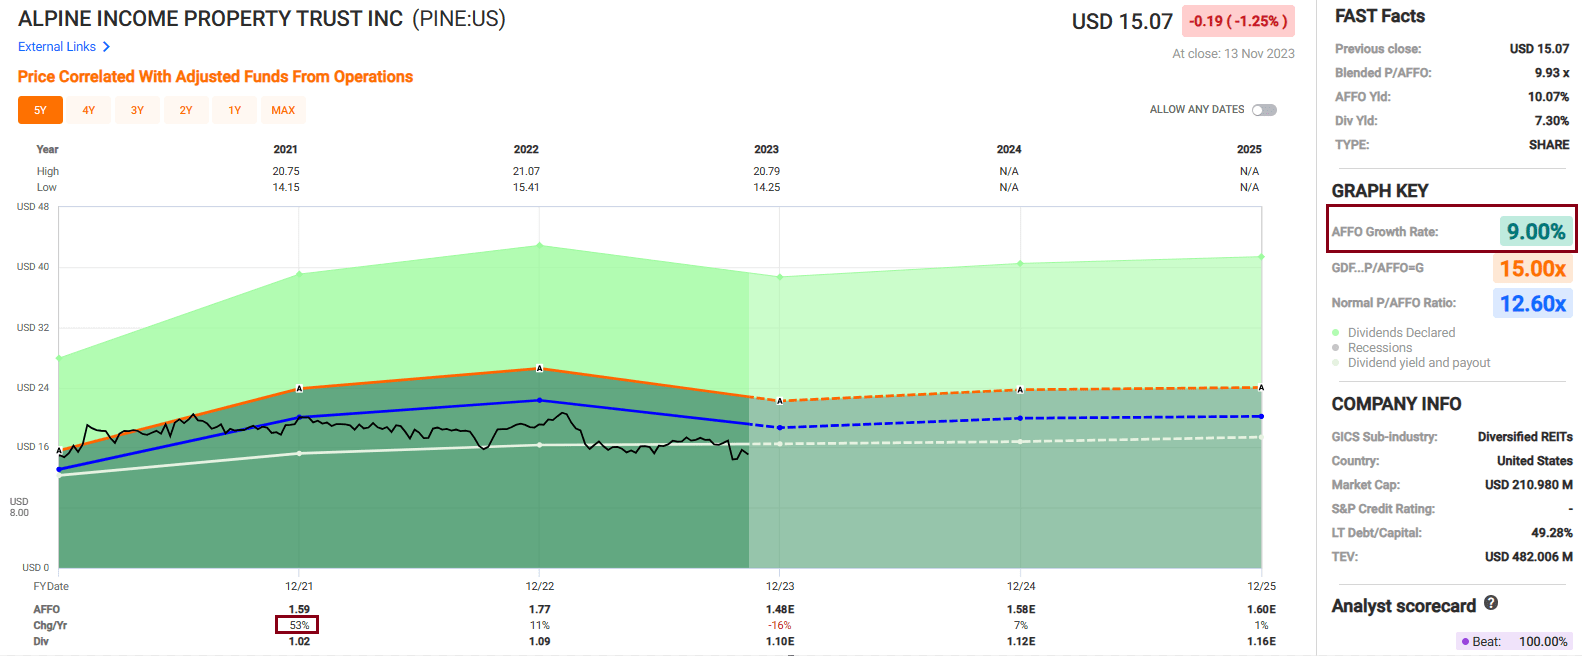
Since 2021 PINE has had a blended average AFFO growth rate of 9.00%, however I believe this average growth rate is skewed due to the growth rate in 2021 of 53%. AFFO increased by 11% in 2022 and is expected to decline by -16% in 2023.
Analysts expect AFFO growth to rebound in 2024 with AFFO per share projected to increase by 7%, followed by an expected modest increase of 1% in 2025.
PINE pays a 7.30% dividend yield that is well-covered with a 2022 year-end AFFO payout ratio of 61.58% and currently trades at a P/AFFO of 9.93x, which is well below their normal AFFO multiple of 12.60x.
We rate Alpine Income Property Trust a Spec Buy.
In Closing…
As you know, I never consider M&A to be a catalyst supporting our buy and sell recommendations; however, as Joey Agree pointed out to me, “I don’t see a place for REITs sub $3 billion dollars.”
Our team will be continuing to watch these REITs recognizing that there will be likely consolidation. As always, thank you for reading and I look forward to your comments below.
iREIT®
For further details see:
5 Prime-Time Net Lease REIT Takeover Targets