QQQ - 5 Reasons To Get Out Of The Market
2023-05-24 09:51:04 ET
Summary
- The market's valuations aren't attractive - and it's not just the top 10-20 stocks that are expensive.
- The consensus estimates for 2H FY2023 earnings may be 20% off.
- The fall in copper prices and growing inventories of the metal are seen as pieces of evidence of weaker-than-expected demand in the West.
- In the United States, it's projected that liquidity could decline between $600 billion and $1.2 trillion by the end of the year.
- Despite the risks to my thesis, I reiterate my sell rating on the S&P 500 Index, the Nasdaq 100, and the stock market in general.
Intro & Thesis
Just recently, I published my bearish article on Apple Inc. ( AAPL ) stock. When I looked at the whole situation a bit more broadly, I realized that the problems of this giant company are indeed not idiosyncratic. That is, the company's upcoming headwinds and unfavorable risk-reward aren't unique - in my opinion, they apply to the entire market, particularly the S&P 500 Index ( SPX , SP500 , SPY ), the Nasdaq 100 ( NDX ), and even the Dow Jones Industrial Average Index ( DJI ). So in today's article, I'll attempt to present this view again, which has only strengthened in my mind despite the recent rally in the aforementioned indices.
What's Wrong With The Market And Why Is It Likely To Sell Off Soon?
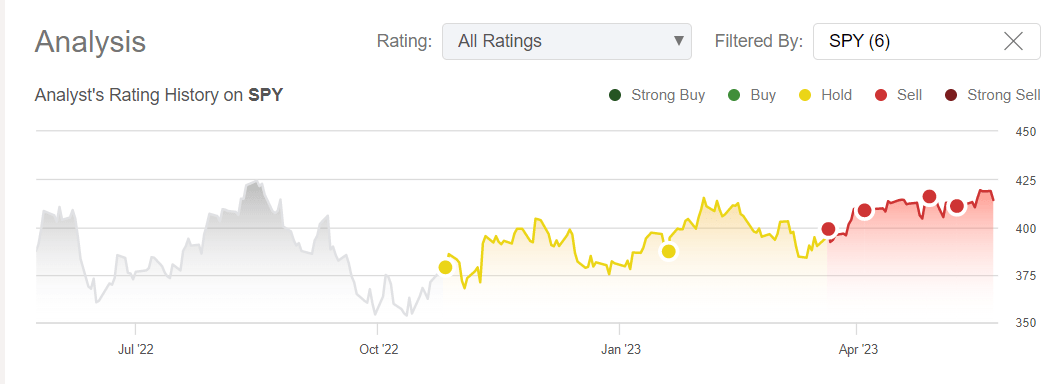
If you've read my previous articles on the S&P 500 Index, you probably know that I took a bearish position on future developments back in late March 2023, when the SPX was just slightly below 4,000 points. Everyone knows what happened after that - the index continued to rise, leaving my bearish thesis out in the cold.
Seeking Alpha, my past coverage of SPY
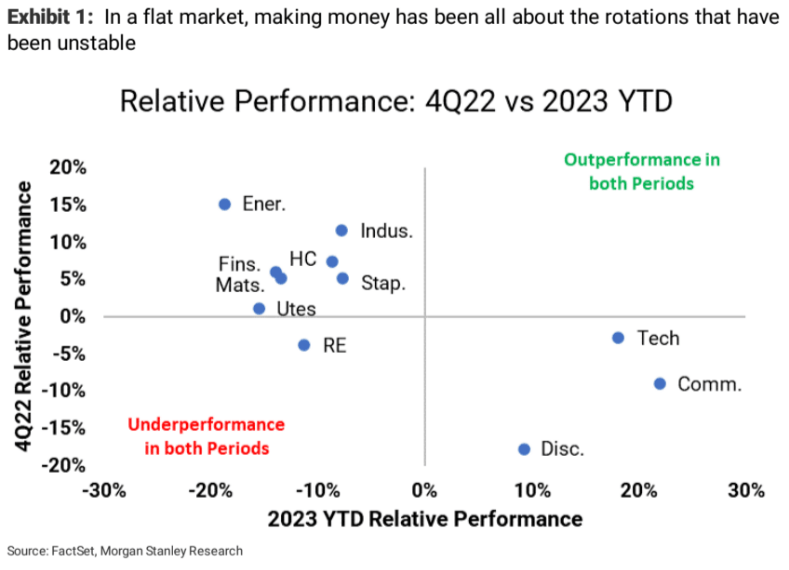
Why did it keep soaring higher? I think it's all about repositioning, which was mentioned by Morgan Stanley's Mike Wilson in his recently released weekly note to the bank's clients:
Last year, the energy, materials, financials, and industrials sectors led the way for the broad market, while the technology sector lagged behind. Small caps also outperformed, and market breadth was high as we may recall. The bullish narrative revolved around China's reopening, which was expected to contribute to global growth. However, there is a very narrow breadth in the market at the moment, with only the technology and consumer sectors showing strength. Investors seem to be more optimistic now, or at least less bearish, about the proliferation of technologies, especially artificial intelligence - the fear of missing out is pushing the overall greediness of the buyers who seem to ignore everything else.
But buyers shouldn't ignore everything else in my opinion - if anything, it looks too dangerous at the levels they have driven SPX and NDX to with their behavior.
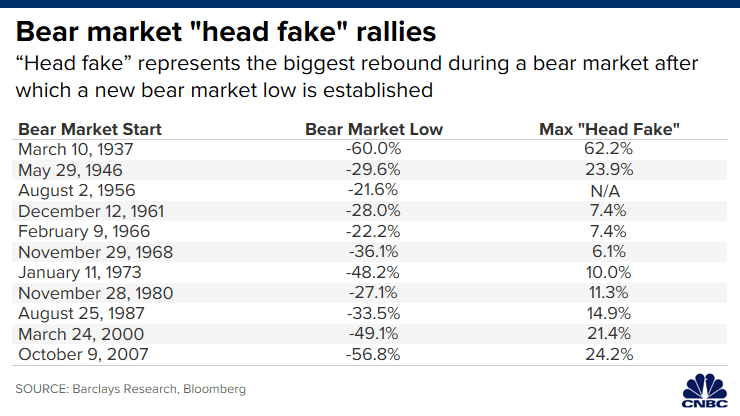
Morgan Stanley believes that the breakout we see today on the stock chart will prove to be a head fake, similar to last summer's. In fact, however, false bursts are quite common. Before the peak of the GFC's fear, there were at least 11 such events in the stock market history:
Why is the current penetration very likely to be just a head fake? Consider a few reasons.
First , valuations aren't attractive, and it's not just the top 10-20 stocks that are expensive. The median P/E ratio of the S&P 500 is 18.3x, which is in the top 15% of historical values since the mid-1990s. The median S&P 500 (excluding the Technology sector) is 18.0x, also in the top 15% of historical values, and the equity risk premium is only 200 basis points. If we look at valuation and look at other metrics - for example, the Shiller P/E ratio, which smooths short-term earnings fluctuations and provides a broader view of valuation - we'll see that market valuation has deflated since the end of 2021 but is still unsustainably high. Earnings yield works in an inverse relationship - the higher it is, the more attractive the market appears. Not today.
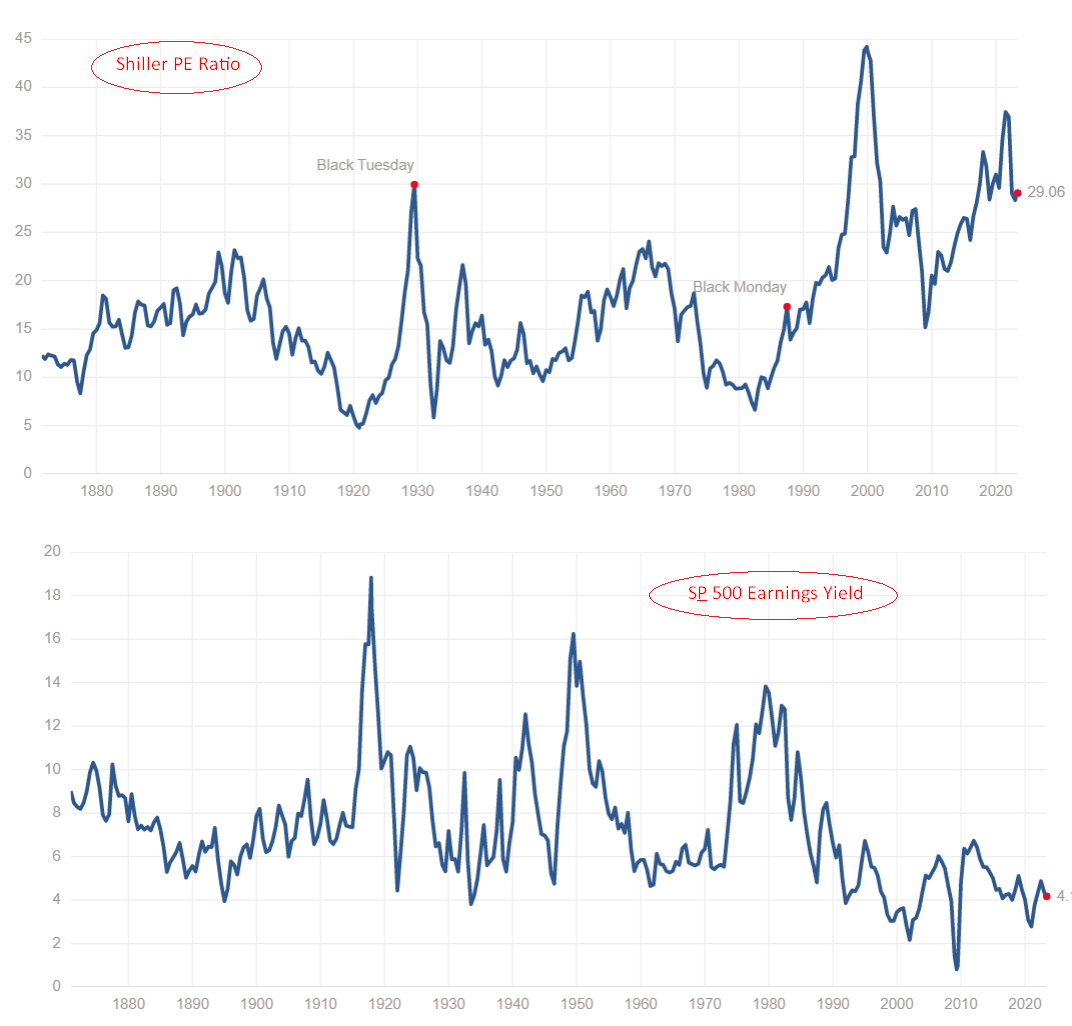
The second reason to get out of the market today is the consensus estimates for second-half earnings (mid-to-high single-digit growth for both the overall index and the ex-tech index), which include a very healthy acceleration. This is in direct contrast to Morgan Stanley's model forecasts, which continue to point sharply lower. I remember how MS's model was rejected strongly when it first predicted the earnings recession of 2022. But as we all see, its outputs proved they were right. And now it forecasts a much bleaker outcome than the consensus that seems to be off by as much as 20%. And again nobody believes in this outcome as the full-year EPS revisions indices keep going higher:
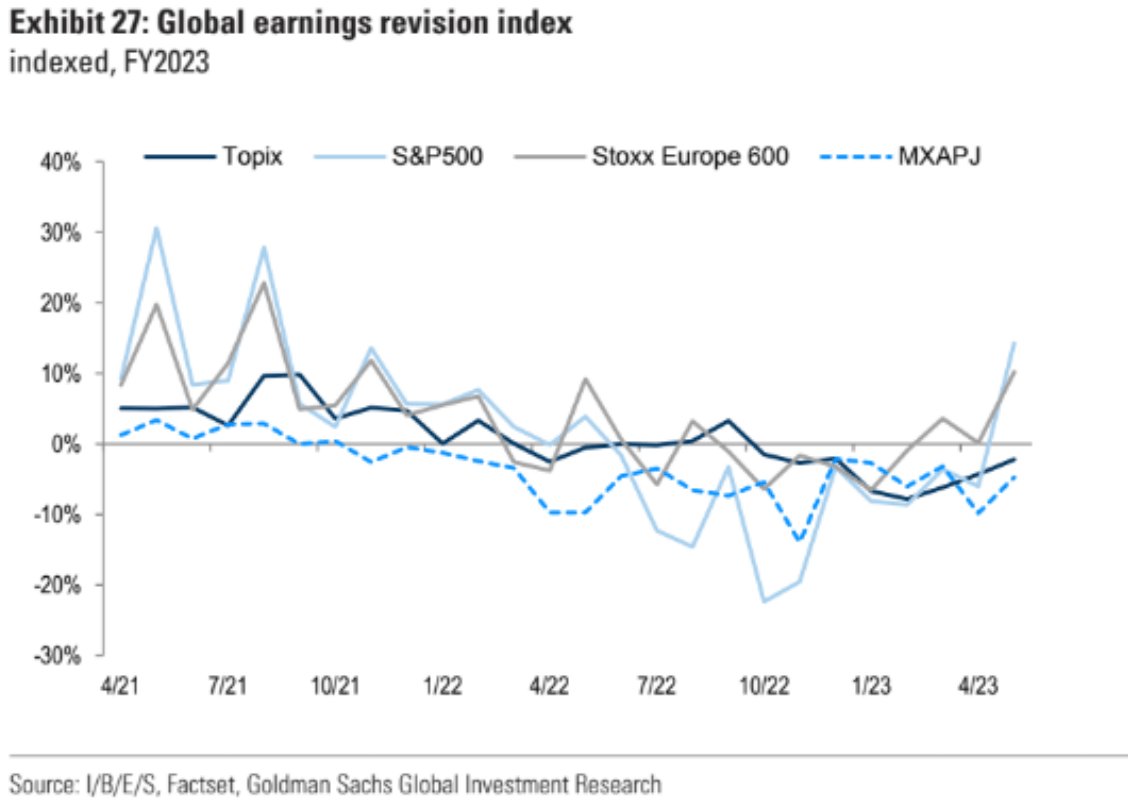
If we explain the current situation in simple terms, we see the following: Everybody believes in a fast recovery of companies' margins and thus their EPS. And assuming a higher-than-average P/E multiple, investors continue to drive the SPX higher. But in fact, there are objective reasons that margins will break in the second half of 2023 - contrary to current expectations. In my earlier articles , I cited the AlphaWise survey in which analysts attempted to measure the expectations of the U.S. population regarding their future buying activity. That is, AlphaWise essentially tried to measure the growth potential of consumption - the future demand for various goods and services. And as the survey showed, U.S. consumer buying intentions have slowed, even among high-end consumers. Again, the questions were based on expectations, i.e., future spending. If there will be less spending, as respondents expected, where will the increase in margins come from?
The third reason is the slowdown in manufacturing activity in developed economies. This reason follows from the second reason above, which is logical: less demand - less supply - less production. And to assess the situation on the production side, we don't just have to look at the PMIs, which obviously continue to fall.
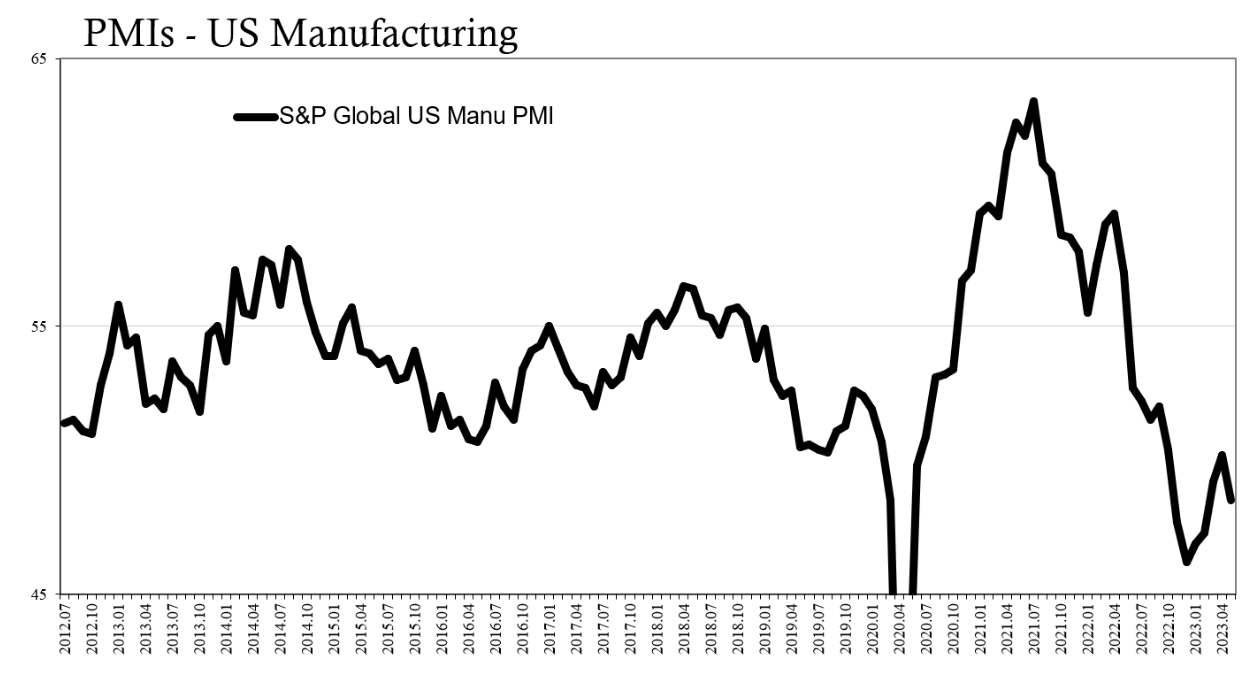
Let's look at copper, which was supposed to rally strongly as the economy recovered, but for some reason decided not to do so.
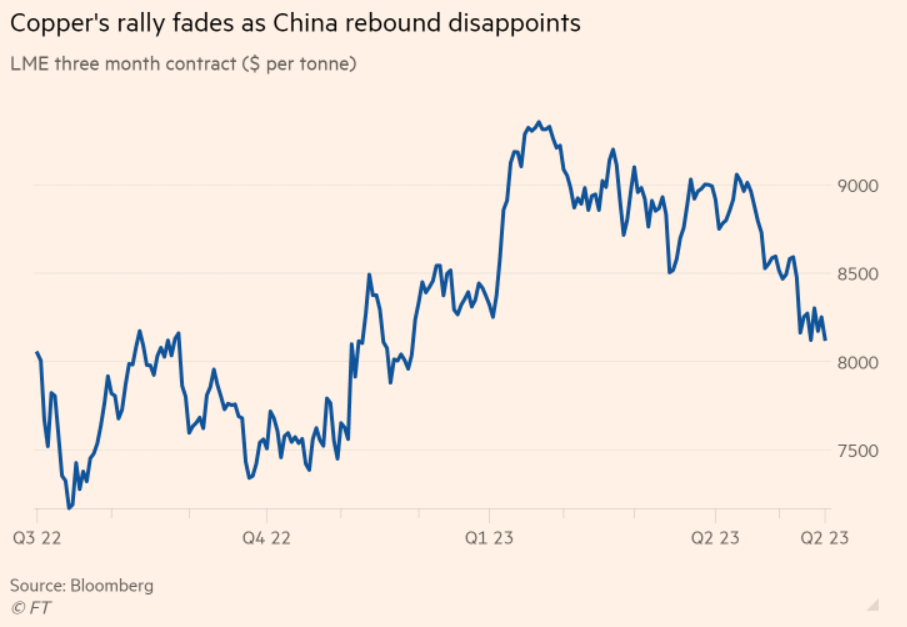
The decline in copper prices is attributed to rising stockpiles of the metal outside China, particularly in LME warehouses, as industrial activity in the U.S. and Europe slows down. Copper, known as "Dr. Copper" for its ability to gauge the health of the global market, is widely used in construction, infrastructure, and household appliances. The fall in copper prices is seen as evidence of weaker-than-expected demand in the West. The slowdown in manufacturing in the West and a less robust recovery in China have prompted Goldman Sachs to revise its copper price forecast for this year - look for more detail in Oakoff's recently-published article on the topic here . Considering how much copper's influence has grown in new infrastructure projects [EVs and renewable energy transition], the price of this metal should feel much better than in previous recession periods. But now copper stocks are piling up, which is a bad sign if you ask me.
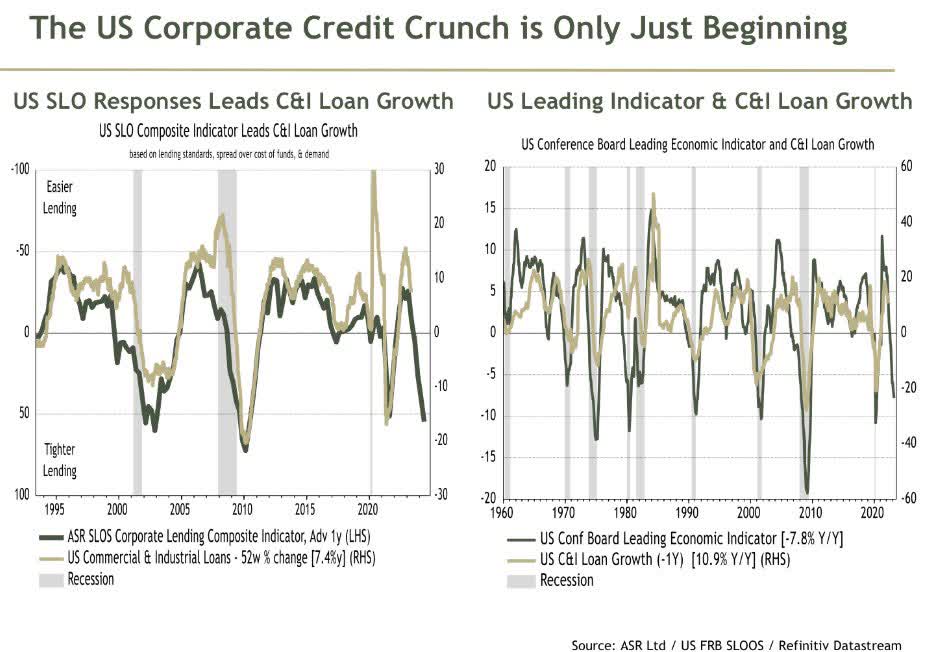
The fourth reason - the equity market is now pricing in Fed cuts before the end of the year without any material impact on growth. However, Morgan Stanley economists believe that the Fed will only cut rates if we finally enter a recession or if tensions in the banking system increase significantly. Moreover, the Fed's rate cuts currently imply that inflation will fall to at least 3%. While this is possible, it's not without significant implications for growth. There's also an assumption in the market that the situation in the banking system won't deteriorate and become systemic. And that's amid an upcoming acceleration in the credit crunch by the end of the year, Mike Wilson notes in his research paper and I totally concur. Just take a look at the leading indicators - credit-driven corporate growth is a major risk going forward:
The fifth reason to be cautious - raising the debt ceiling could reduce market liquidity - MS expects significant government bond issuance in the 6 months following the passage of the debt ceiling. If the sides fail to reach an agreement on the debt ceiling, there could be serious economic consequences. According to credit strategists at Bank of America [proprietary source], the worst-case scenario could lead to a corporate debt default rate of 15%. However, BofA believes a lower peak of 8% is more probable - even with the lower estimate, this would still result in nearly $1 trillion worth of new and outstanding debt defaulting, which is a lot.
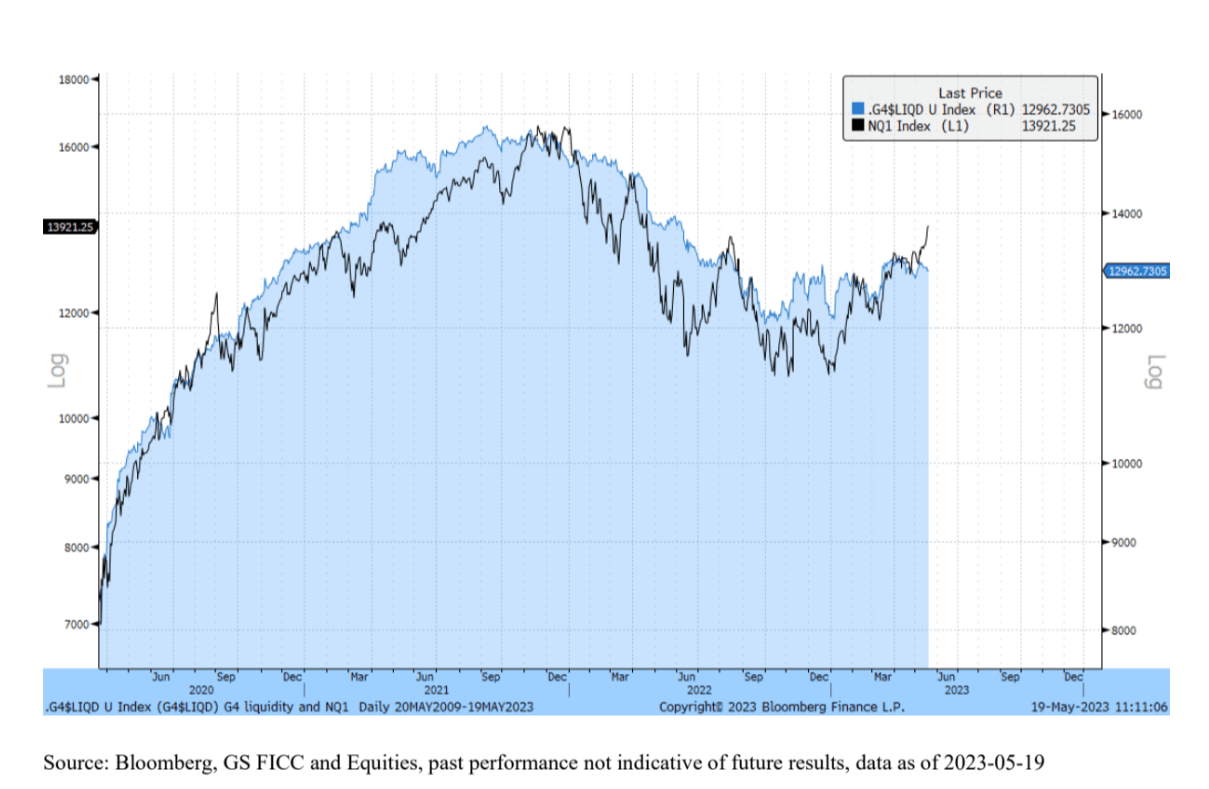
A few more words about liquidity. After a period of favorable liquidity conditions in 1H FY2023, there is now a potential for substantial tightening in 2H, Goldman Sach writes. In the United States, it is projected that liquidity could decline between $600 billion and $1.2 trillion by the end of the year. Additionally, Europe may experience an additional decline of $400-500 billion due to the expiration of the TLTRO (Targeted Longer-Term Refinancing Operations) and quantitative tightening [QT]. The extent of liquidity withdrawal in the U.S. depends on how the planned Treasury General Account [TGA] restocking, following the raising of the debt ceiling, will be funded. If primarily funded through existing money market fund holdings in the RRP ]Reverse Repurchase Agreement] facility, the overall liquidity decline could be around $600 billion.
However, if corporates or money market funds purchase bills and reduce bank deposits, or if there are new inflows into money market funds that maintain the stability of the RRP, liquidity could decrease by as much as $1.2 trillion. In any case, this isn't a good sign for the next market movement, which started to move away from a clear correlation with liquidity levels due to the existing FOMO:
Bloomberg, Goldman Sachs [May 19, 2023 - proprietary source]
The Bottom Line
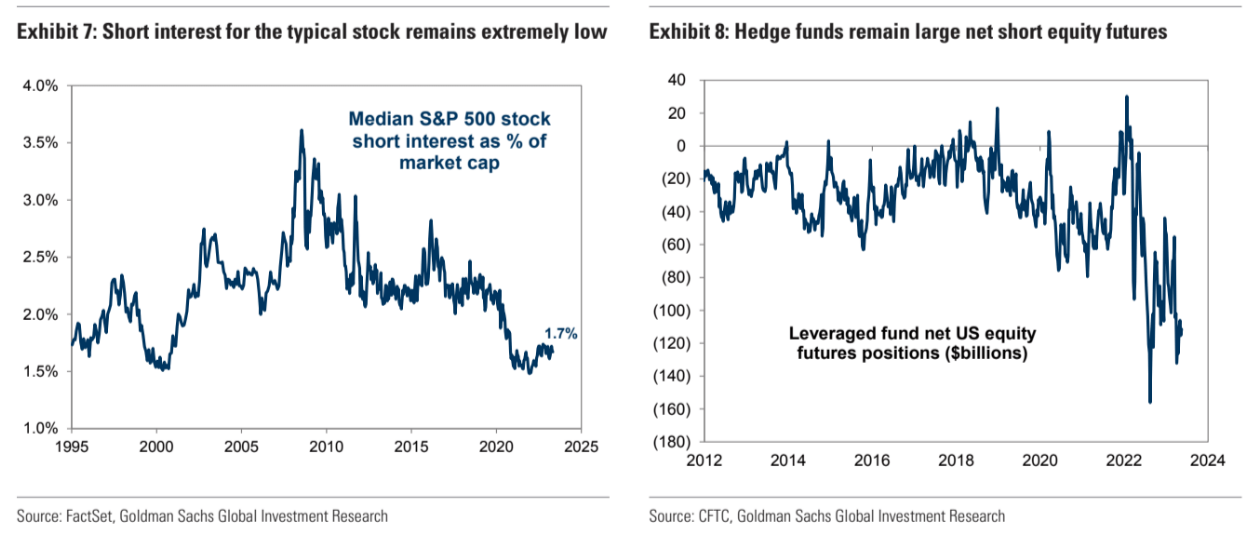
Of course, my bearish thesis carries some upside risks that I can't keep from you. First, a large number of institutional investors know everything I wrote above - and more, so they have positioned their portfolios accordingly:
Going forward, they'll have to cover their positions as the cost of shorting increases due to rising Fed rates - holding a short position for a long time isn't a cheap pleasure now. Covering will cause a squeeze that will keep the market relatively high.
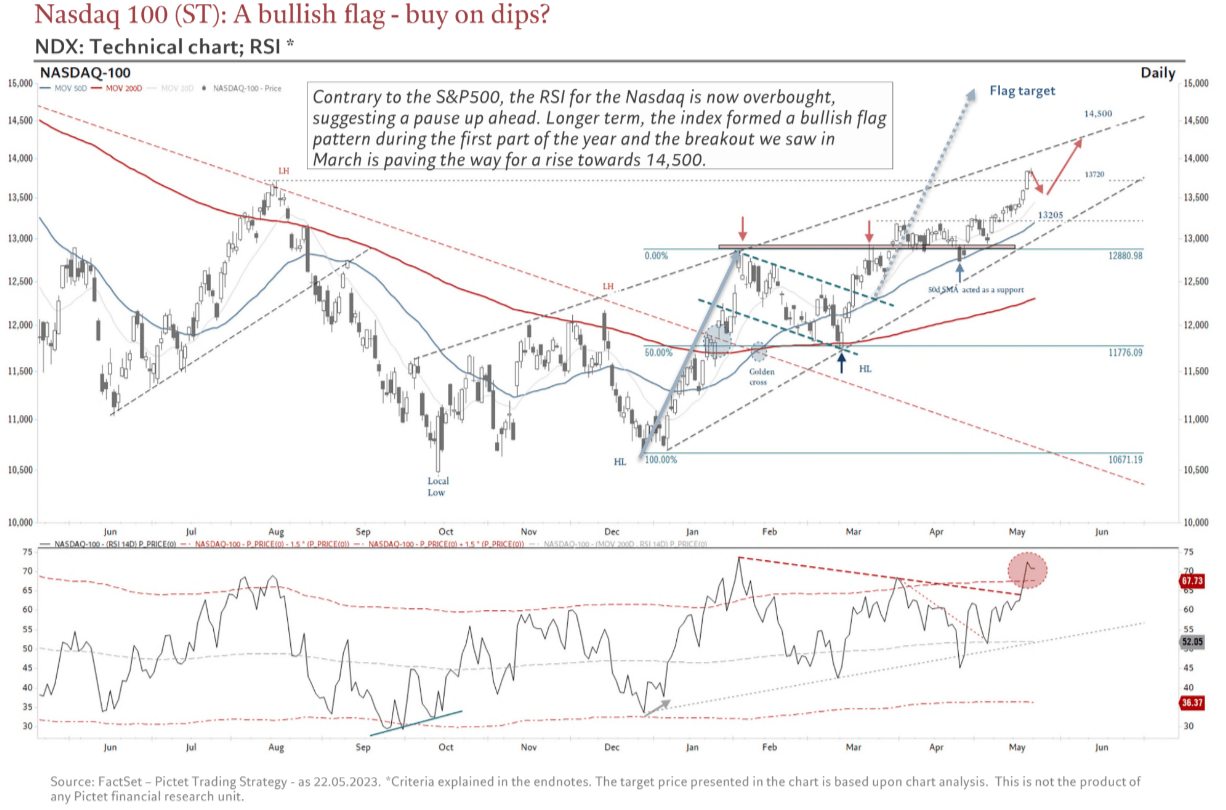
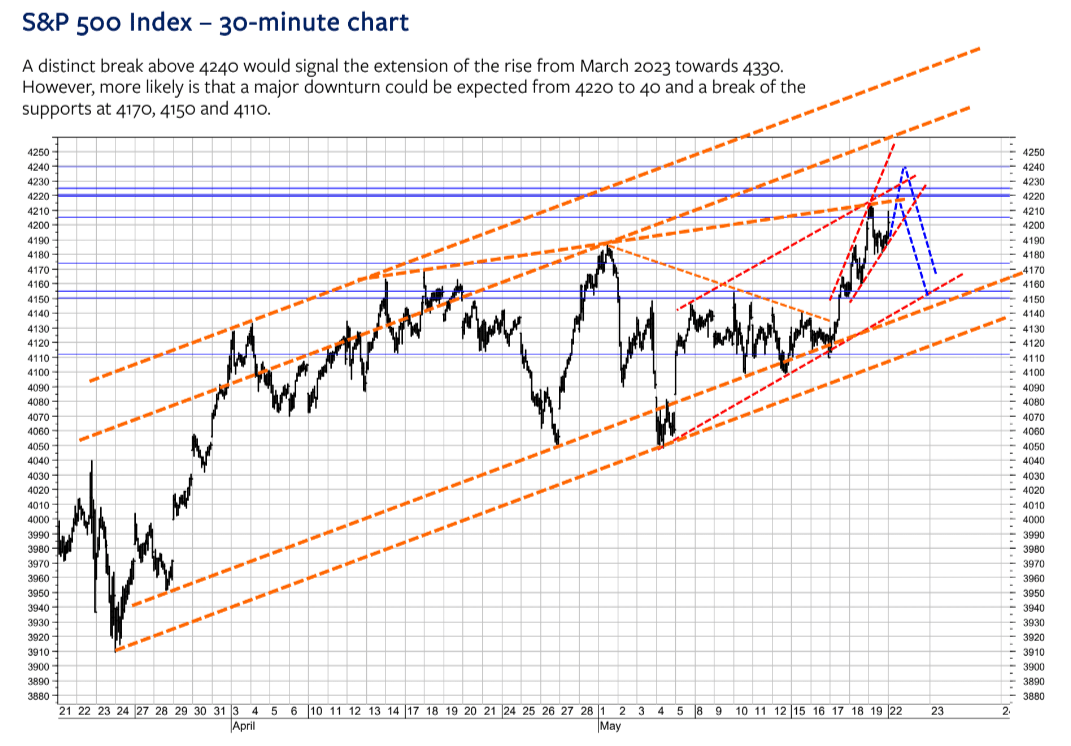
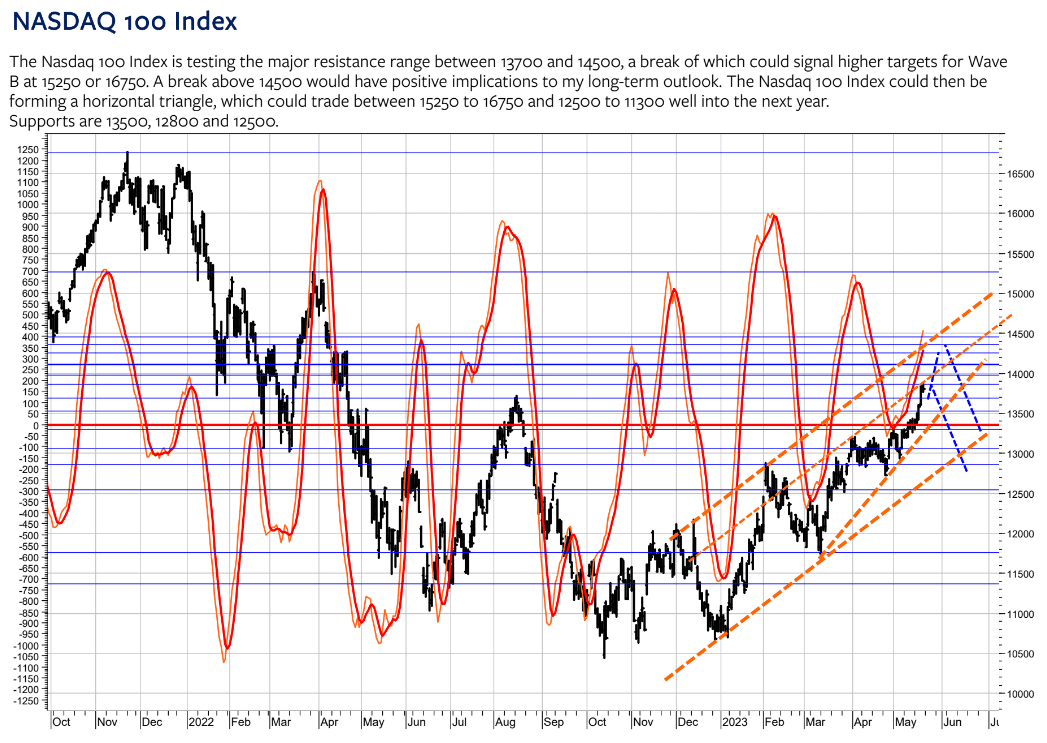
?I'm also seeing a lot of technical charts lately that talk about the S&P 500 Index, the Nasdaq 100, and even the DJI making higher highs. Here are just a few of those charts:
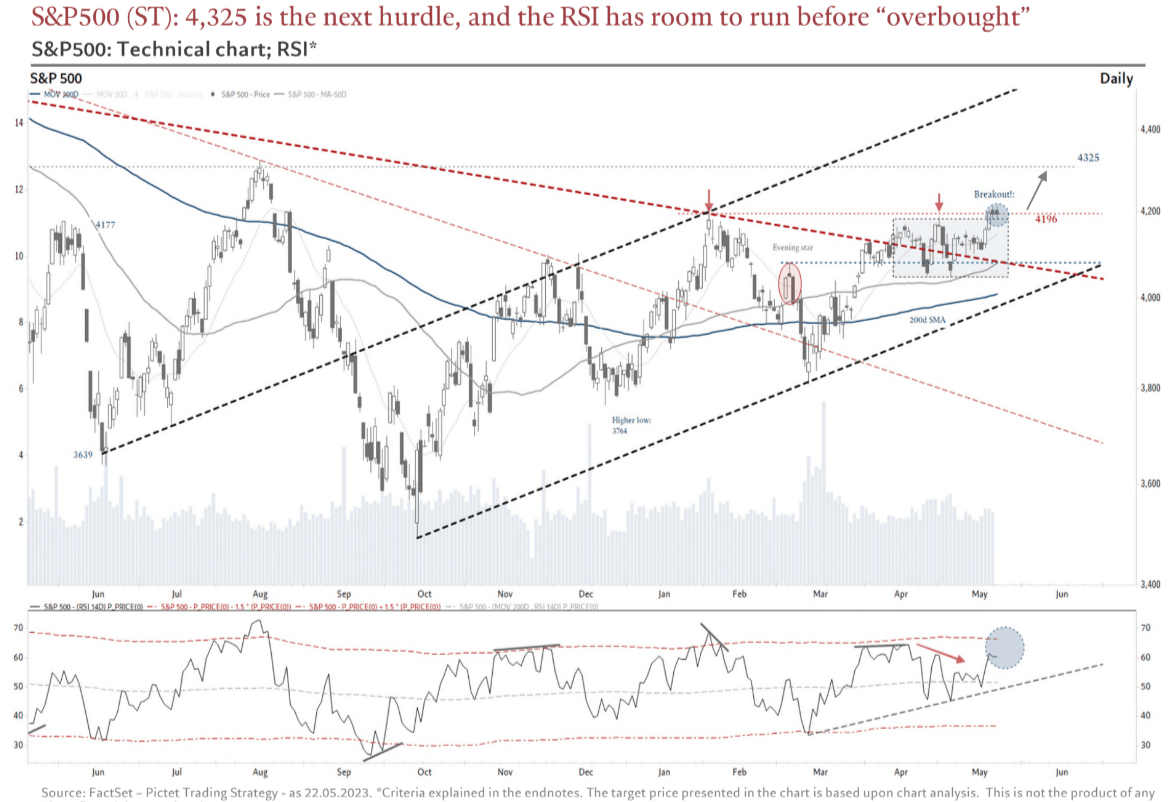
But there are enough bearish charts as well:
Despite the risks to my thesis, I reiterate my sell rating on the S&P 500 Index, the Nasdaq 100, and the stock market in general due to the plethora of risks that are inadequately priced-in due to the new FOMO.
Thank you for reading! Please, let me know what you think in the comment section below!
For further details see:
5 Reasons To Get Out Of The Market