RTNTF - 5 Relatively Safe And Cheap Dividend Stocks To Invest In - March 2023
2023-03-04 09:30:00 ET
Summary
- This article is part of our monthly series where we highlight five companies that are large-cap, relatively safe, dividend-paying, and are offering large discounts to their historical norms.
- We go over our filtering process to select just five conservative DGI stocks from more than 7,500 companies that are traded on U.S. exchanges, including OTC networks.
- In addition to the conservative list that yields between 3% and 4%, we present two other groups of five DGI stocks each, with the goal of moderate to high yields.
Author's Note: This is our monthly series on Dividend Stocks, usually published in the first week of every month. We scan the entire universe of roughly 7,500 stocks that are listed and traded on U.S. exchanges and use our proprietary filtering criteria to select five stocks that are relatively safe and maybe trading cheaper compared to their historical valuations. Some of the sections in the article, like 'Selection Process/Methodology,' are repeated each month with few changes. This is intentional as well as unavoidable, as this is necessary for the new readers to be able to conceptualize the process. Regular readers of this series could skip such sections to avoid repetitiveness.
************
The market gained some positive momentum early this year, but recently, it has lost steam. The CPI (consumer price index) report in February came in a bit higher than expected, while employment remained reasonably solid. This gave rise to the perception that the Fed's battle with inflation is not over yet, and they are likely to keep rates higher and longer than expected earlier. Since mid-February, the market has given back more than half of its gains from January. All eyes are now on the next CPI report, due to be released on 14th March.
The market is, at best, conflicted right now. Most investors believe that we are going to have some kind of recession by the end of 2023 or early 2024 but are divided over the scope of the recession in terms of hard landing versus soft landing. In fact, a third view has been emerging of 'no landing' at all, meaning inflation stays relatively high while the economy keeps growing, albeit at a slower pace.
In a nutshell, this period of economic uncertainty may last longer than we thought earlier. Against this backdrop, it is important to keep some cash reserves and dry powder ready to be able to deal with any scenario. At the same time, we believe it is not possible to catch the exact bottom (or the peak), so it is best to invest regularly and consistently in good, solid dividend-paying stocks when their valuations are attractive.
The main goal of this series of articles is to shortlist and highlight companies that have a solid history of paying and raising dividends. In addition, we demand that these companies support strong fundamentals, carry low debt, and are offered at a relatively cheaper valuation. These DGI stocks are not going to make anyone rich overnight, but if your goal is to attain financial freedom by owning stocks that would grow dividends over time, meaningfully and sustainably, then you are at the right place. These lists are not necessarily recommendations to buy, but a shortlist of probable candidates for further research. The purpose is to keep our buy list handy and dry powder ready so that we can use the opportunity when the time is right. Besides, every month, this analysis is able to highlight a few companies that otherwise would not be on our radar.
Every month, we start with roughly 7,500 stocks that are listed and traded on U.S. exchanges, including over-the-counter ((OTC)) networks. By using our filtering criteria, the initial list is quickly narrowed down to roughly 700 stocks, which are mostly dividend-paying and dividend-growing stocks. From thereon, by using various data elements, including dividend history, payout ratios, revenue growth, debt ratios, EPS growth, etc., we calculate a 'Dividend Quality Score' for each stock that measures the relative safety and sustainability of the dividend. In addition to dividend safety, we also seek cheaper valuations. We also demand that the selected companies have an established business model, solid dividend history, manageable debt, and investment-grade credit rating.
This month, we highlight three groups with five stocks each that have an average dividend yield (as a group) of 3.04%, 5.49%, and 6.97%, respectively. The first list is for conservative and risk-averse investors, while the second one is for investors who seek higher yields but still want relatively safe dividends. The third group is for yield-hungry investors but comes with an elevated risk, and we urge investors to exercise caution.
Notes: 1) Please note that when we use the term "safe" in relation to stocks and investments, it should be interpreted as "relatively safe" because nothing is absolutely safe in investing. Even though we present only 5 to 10 stocks in our final list, one should have 15-20 stocks at a minimum in a well-diversified portfolio.
2) All tables in this article are created by the author unless explicitly specified. The stock data have been sourced from various sources such as Seeking Alpha, Yahoo Finance, GuruFocus, and CCC-List (drip investing).
The Selection Process
Note: Regular readers of this series could skip this section to avoid repetitiveness. However, we include this section for new readers to provide the necessary background and perspective.
Goals:
We start with a fairly simple goal. We want to shortlist five companies that are large-cap, relatively safe, dividend-paying, and trading at relatively cheaper valuations in comparison to the broader market. The objective is to highlight some of the dividend-paying and dividend-growing companies that may be offering juicy dividends due to a temporary decline in their share prices. The excess decline may be due to an industry-wide decline or some kind of one-time setbacks like some negative news coverage or missing quarterly earnings expectations. We adopt a methodical approach to filter down the 7,500-plus companies into a small subset.
Our primary goal is income that should increase over time at a rate that at least beats inflation. Our secondary goal is to grow the capital and provide a cumulative growth rate of 9%-10% at a minimum. These goals are, by and large, in alignment with most retirees and income investors, as well as DGI investors. A balanced DGI portfolio should keep a mix of high-yield, low-growth stocks along with some high-growth but low-yield stocks. That said, how you mix the two will depend upon your personal situation, including income needs, time horizon, and risk tolerance.
A well-diversified portfolio would normally consist of more than just five stocks and preferably a few stocks from each sector of the economy. However, in this periodic series, we try to shortlist and highlight just five stocks that may fit the goals of most income and DGI investors. But at the same time, we try to ensure that such companies are trading at attractive or reasonable valuations. However, as always, we recommend you do your due diligence before making any decision on them.
Selection Criteria:
The S&P 500 currently yields roughly 1.60%. Since our goal is to find companies for a dividend income portfolio, we should logically look for companies that pay yields that are at least similar to or better than the S&P 500. Of course, the higher, the better, but at the same time, we should not try to chase very high yields. If we try to filter for dividend stocks paying at least 1.50% or above, nearly 2,000 such companies are trading on U.S. exchanges, including OTC networks. We will limit our choices to companies that have a market cap of at least $10 billion and a daily trading volume of more than 100,000 shares. We also will check that dividend growth over the last five years is positive, but there can be some exceptions.
We also want stocks that are trading at relatively cheaper valuations. But at this stage, we want to keep our criteria broad enough to keep all the good candidates on the list. So, we will measure the distance from the 52-week high but save it to use at a later stage. Also, at this initial stage, we include all companies that yield 1% or higher. In addition, we also include other lower-yielding but high-quality companies at this stage.
Criteria to Shortlist:
- Market cap > $10 billion ($9 billion in a down market)
- Dividend yield > 1.0% (some exceptions are made to include high quality but lower yielding companies)
- Daily average volume > 100,000
- Dividend growth past five years >= 0.
By applying the above criteria, we got around 600 companies.
Narrowing Down the List
As a first step, we would like to eliminate stocks that have less than five years of dividend growth history. We cross-check our current list of over 600 stocks against the list of so-called Dividend Champions, Contenders, and Challengers originally defined and created by David Fish. Generally, the stocks with more than 25 years of dividend increases are called dividend Champions, while stocks with more than ten but less than 25 years of dividend increases are termed, Contenders. Further, stocks with more than five but less than ten years of dividend increases are called Challengers. Also, since we want a lot of flexibility and wider choice at this initial stage, we include some companies that pay dividends lower than 1.50% but otherwise have a stellar dividend record and growing dividends at a fast pace.
After we apply all the above criteria, we're left with roughly 312 companies on our list. However, so far in this list, we have demanded five or more years of consistent dividend growth. But what if a company had a very stable record of dividend payments but did not increase the dividends from one year to another? At times, some of these companies are foreign-based companies, and due to currency fluctuations, their dividends may appear to have been cut in US dollars, but in reality, that may not be true at all when looked at in the actual currency of reporting. At times, we may provide some exceptions when a company may have cut the dividend in the past but otherwise looks compelling. So, by relaxing some of the conditions, a total of 74 additional companies were considered to be on our list. We call them category 'B' companies. After including them, we had a total of 386 (312 + 74) companies that made our first list.
We then imported the various data elements from many sources, including CCC-list, GuruFocus, Fidelity, Morningstar, and Seeking Alpha, among others, and assigned weights based on different criteria as listed below:
- Current yield: Indicates the yield based on the current price.
- Dividend growth history (number of years of dividend growth): This provides information on how many years a company has paid and increased dividends on a consistent basis. For stocks under the category 'B' (defined above), we consider the total number of consecutive years of dividends paid rather than the number of years of dividend growth.
- Payout ratio: This indicates how comfortably the company can pay the dividend from its earnings. We prefer this ratio to be as low as possible, which would indicate the company's ability to grow the dividend in the future. This ratio is calculated by dividing the dividend amount per share by the EPS (earnings per share). The cash-flow payout ratio is calculated by dividing the dividend amount paid per share by the cash flow generated per share.
- Past five-year and 10-year dividend growth: Even though it's the dividend growth rate from the past, this does indicate how fast the company has been able to grow its earnings and dividends in the recent past. The recent past is the best indicator that we have to know what to expect in the next few years.
- EPS growth (average of previous five years of growth and expected next five years' growth): As the earnings of a company grow, more than likely, dividends will grow accordingly. We will take into account the previous five years' actual EPS growth and the estimated EPS growth for the next five years. We will add the two numbers and assign weights.
- Chowder number: So, what's the Chowder number? This number has been named after well-known SA author Chowder, who first coined and popularized this factor. This number is derived by adding the current yield and the past five years' dividend growth rate. A Chowder number of "12" or more ("8" for utilities) is considered good.
- Debt/equity ratio: This ratio will tell us about the debt load of the company in relation to its equity. We all know that too much debt can lead to major problems, even for well-known companies. The lower this ratio, the better it is. Sometimes, we find this ratio to be negative or unavailable, even for well-known companies. This can happen for a myriad of reasons and is not always a reason for concern. This is why we use this ratio in combination with the debt/asset ratio (covered next).
- Debt/asset ratio: This ratio will tell us about the debt load in relation to the total assets of the company. In almost all cases, this ratio would be lower than the debt/equity ratio. Also, this ratio is important because, for some companies, the debt/equity ratio is not a reliable indicator.
- S&P's credit rating: This is the credit rating assigned by the rating agency S&P Global and is indicative of the company's ability to service its debt. This rating can be obtained from the S&P website.
- PEG ratio: This also is called the price/earnings-to-growth ratio. The PEG ratio is considered to be an indicator if the stock is overvalued, undervalued, or fairly priced. A lower PEG may indicate that a stock is undervalued. However, PEG for a company may differ significantly from one reported source to another, depending on which growth estimate is used in the calculation. Some use past growth, while others may use future expected growth. We're taking the PEG from the CCC list wherever available. The CCC list defines it as the price/earnings ratio divided by the five-year estimated growth rate.
- Distance from 52-week high: We want to select companies that are good, solid companies but also are trading at cheaper valuations currently. They may be cheaper due to some temporary down cycle or some combination of bad news or simply having a bad quarter. This criterion will help bring such companies (with a cheaper valuation) near the top as long as they excel in other criteria as well. This factor is calculated as (current price - 52-week high) / 52-week high.
- Sales or Revenue growth: This is the average growth rate in annual sales or revenue of the company over the last five years. A company can only grow its earnings power as long as it can grow its revenue. Sure, it can grow the earnings by cutting costs, but that can't go on forever.
Downloadable Dataset:
Below we provide a link to the table with relevant data on 380 stocks. This table can be downloaded by readers for further analysis. Please note that the table is sorted on the "Total Weight" or the "Quality Score."
File-for-export_-_5_Safe_and_Cheap_DGI_-_March_2023.xlsx
Selection Of The Top 50
We will first bring down the list to roughly 60 names by automated criteria, as listed below. In the second step, which is mostly manual, we will bring the list down to about 30.
- Step 1: First, take the top 20 names from the above table (based on total weight or quality score).
- Step 2: As a second step, we will take the top 10 names based on the highest dividend yield. When it comes to dividend yield, some of the industry segments tend to be overcrowded. So, we will take the top two (or max three) names from any single industry segment. We take the top 10 stocks after the sort to the final list.
- Step 3: Now, we will sort our list based on five-year dividend growth (highest at the top) and select the top 10 names.
- Step 4: We also want to give priority to stocks that are rated highest in terms of credit rating. So, we will sort the list based on the numerical weight of the credit rating and select the top 10 stocks with the best credit rating. Again, we are careful not to have too many names from the same sector.
- Step 5: Lastly, as the name of the series suggests, we want to have some names that may be trading cheaper in comparison to their historical valuation. So, we select the top ten names with the highest discount. However, we need to be careful that they meet our other quality criteria.
From the above steps, we now have a total of 60 names in our final consideration. However, the following stocks appeared more than once:
Stocks that appeared two times:
AAP, ADP, CI, CVX, IMO, MSFT, NEM, PXD, VFC (9 duplicates).
After removing nine duplicates, we are left with 51 (60-9) names.
Since there are multiple names in each industry segment, we will keep a maximum of two or three names (from the top) from any one segment. We keep the following:
Financial Services, Banking, and Insurance:
Banking:
Financial Services - Others: ( MS ), ( V ), ( ALLY )
Insurance:
Business Services/ Consulting:
Conglomerates:
( CSL )
Industrials:
Transportation/ Logistics:
( UPS )
Chemicals:
Materials/Mining/Gold:
Materials:
Mining (other than Gold): ( RIO ), ( BHP )
Defense:
None
Consumer/Retail/Others:
Cons-defensive:
Cons-discretionary: ( ADM ), ( VFC ), ( TSN )
Cons-Retail: ( TGT ), ( LOW ), ( COST )
Communications/Media
( VZ )
Healthcare:
Pharma: ( PFE ), ( JNJ ), ( MRK )
Healthcare Ins: ( CI ), ( UNH )
Technology:
Energy:
Pipelines/ Midstream: ( ENB ), ( MPLX ), ( ET )
Oil & Gas (prod. & exploration): ( EOG ), ( CVX ), ( CTRA )
Utilities:
( NRG )
Housing/ Construction:
( LEN )
REIT:
Final Step: Narrowing Down To Just Five Companies
In this step, we construct three separate lists of five stocks each, with different sets of goals, dividend income, and risk levels.
The lists are:
1) Conservative Dividend list,
2) Moderately High Dividend List,
3) Ultra High Dividend List, and
4) A combined list of the above three (duplicates removed).
Out of the top 50, we make our judgment calls to make these three lists, so basically, the selections are based on our research and perceptions. So, while most of the filtering was based on automated criteria, the last step is a subjective one. We try to make each of the three lists highly diversified among various sectors and industry segments and try to ensure that the safety of dividends matches the overall risk profile of the group. We certainly encourage readers to do further research on the highlighted names.
Nonetheless, here are our three final lists for this month:
Final A-List (Conservative Safe Income):
Average yield: 3.04%
Table-1A: A-LIST (Conservative Income)
**CTRA – Dividend yield has been calculated based on the most recent quarterly dividend amount of $0.20 per share plus the variable dividend amount of $0.37 per share. Please note that many website show yield without including the variable amount. It is important to know the variable amount is variable (as the name says) and subject to change every quarter.
We think this set of five companies (in the A-List) would form a solid diversified group of dividend companies that would be appealing to income-seeking and conservative investors, including retirees and near-retirees. The average yield is almost double of S&P500 at 3.04%. The average dividend growth history is nearly 20 years, and the average discount from a 52-week high is very attractive for these stocks at -19.5%. Also, four of the five companies have an excellent credit rating of A- or higher.
If you must need even higher dividends, consider B-List or C-List, as presented below.
CTRA (Coterra Energy):
We may have seen the peak price of oil in the year 2022. That's why the investment thesis for most energy companies has changed for 2023, and CTRA is no exception. In the year 2023, the oil prices are likely to be lower than 2022 levels but still remain elevated due to limited supply and the war in Eastern Europe. Moreover, natural gas prices have come down significantly from the peak of 2022. CTRA earns nearly 2/3 rd of its total revenue from natural gas and the rest from oil products. So, due to the significant weakness in natural gas, this is a minus. That said, there is an opportunity going forward for the company to supply liquified NG to Europe, as Europe's supply from Russia appears to be permanently impacted. In a nutshell, CTRA is a solid energy company and is likely to do well as the world will keep using these products for a long time in spite of the push for green energy. Moreover, it currently provides a very high level of dividend yield, though its variable dividend is likely to moderate in 2023. The stock price appears to be undervalued and nearly 30% down from its 52-week high.
ADP (Automatic Data Processing) and V (Visa) have been selected for the reliability and growth of their dividends. Even though their current yields are low, growth should compensate in the long run.
TSM (Taiwan Semiconductor):
TSM is the world's largest contract chip manufacturer or foundry. It manufactures chips and ICs based on customers' designs. Further, it is in the midst of a geographical expansion of its manufacturing facilities in the U.S. and Japan. The stock price has been seeing some weakness due to the geopolitical tensions between the U.S. and China and also due to the news that Warren Buffett's Berkshire reduced its stake in the company late last year. At the same time, the semiconductor industry is cyclical, and due to macro headwinds, sales, and revenues are expected to decline from the peak during the Covid. That said, we want to buy good stocks in the weakness and patiently wait for the rebound while collecting the dividends.
PFE (Pfizer):
Last month, this series recommended Merck ( MRK ); however, MRK has become even more expensive, and it was not cheap to start with. This month, we are selecting Pfizer since it may be an equally compelling investment with a higher yield and cheaper valuation. The stock price has seen some weakness due to the Covid reset and the expected decline in Covid-related revenue going forward. Given the weakness, the stock appears to be undervalued to some extent. The company is also in early talks to acquire the biotech company Seagen ( SGEN ). It has also committed to much higher R&D budgets going forward. If the Seagen deal goes through, it is possible that the company may look at cutting the dividend to some extent. So, the current yield should be taken with a grain of salt. That said, the company is likely to do well regardless, as it has plenty of cash to elevate its R&D to ensure the future drugs pipeline.
Final B-List (High Yield, Moderately Safe):
Average yield: 5.49%
Note 1: Very often, we include a few low-risk stocks in B-List and C-list. Also, oftentimes, a stock can appear in multiple lists. This is done on purpose. We try to make each of our lists fairly diversified among different sectors/industry segments of the economy. We try to include a few of the highly conservative names in the high-yield list to make the overall group much safer.
Note 2: MPLX is a Mid-stream Partnership and issues the K1 tax form instead of 1099-Div (for corporations).
Table-1B: B-LIST (High Yield)
BHP Group : The stock is no longer as cheap as it was back in November 2022. The quality of the company remains the same, but the value proposition has changed a bit. Currently, the dividend yield is very attractive at 10.75%; however, it is likely that the dividend may be reduced in 2023, by some estimates, as much as 20% to 40%. Even if we assume the reduced dividend payout, the future yield will still be quite attractive (at around 6% to 8% on current prices). It is quite possible for the stock price to fall back to the low 50s, so it may be best to buy this in two lots. This month, we are adding BHP to our B-List and C-List.
The company's stock is generally more volatile because of the cyclical nature of its business. The demand outlook may decline a bit going forward, but overall the demand for commodities that BHP produces is likely to remain strong as more and more people move into the middle class in the developing world. Exploration and supply growth will remain constrained due to factors like environmental regulations and the ESG framework. Moreover, China's economy has finally opened up (from Covid lockdowns), and that is a positive for BHP.
MPLX (MPLX LP):
In the B-List and C-List, we have replaced CTRA with MPLX for higher yield (current yield 8.92%) and also due to the fact that some of CTRA dividend payout is variable and may get reduced in 2023. MPLX is a midstream energy company with excellent operating history. Its dividend appears to be safe as it recently increased the payout by 10%. That said, the stock price appears to be fairly valued.
In the B-List, the overall risk profile of the group becomes slightly elevated compared to A-List. That said, the group will likely provide safe dividends for many years. This list offers an average yield for the group of 5.49%, an average of 18 years of dividend history, and an average discount of -18% (from 52-week highs).
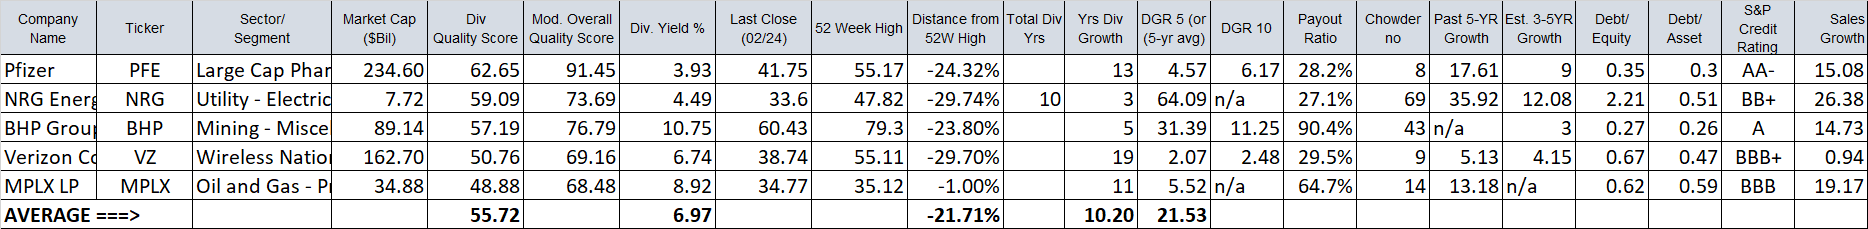
Final C-LIST (Yield-Hungry, Less Safe):
Average yield: 6.97%
Notes:
Note 1: Oftentimes, a stock can appear in multiple lists. We try to include one or two conservative names in the high-yield list to make the overall group much safer.
Note 2: MPLX is a Mid-stream Partnership and issues the K1 tax form instead of 1099-Div (for corporations).
Table-1C: C-LIST (Yield-Hungry, Elevated Risk)
Apparently, this list (C-List) is for yield-hungry DGI investors. The yield goes up as much as 7% or more. However, this list is not for conservative investors. As you can see, the average credit rating of this set of companies is much lower than the A-List. We urge due diligence to determine if it would suit your personal situation. Nothing comes for free, so there will be more risk involved with this group. That said, it's a highly diversified group spread among five different sectors.
VZ (Verizon):
In the C-list, we have included the high-yielding stock VZ (Verizon). Usually, VZ would be considered a conservative dividend stock, but due to the very high debt burden in a high-interest rate environment and slowing growth has caused the stock to decline nearly 28% from its peak. All that said, the stock is offering a much better value compared to just six months ago. It offers a very attractive dividend yield at these levels.
We may like to caution that each company comes with certain risks and concerns. Sometimes these risks are real, but other times, they may be a bit overblown and temporary. So, it's always recommended to do further research and due diligence.
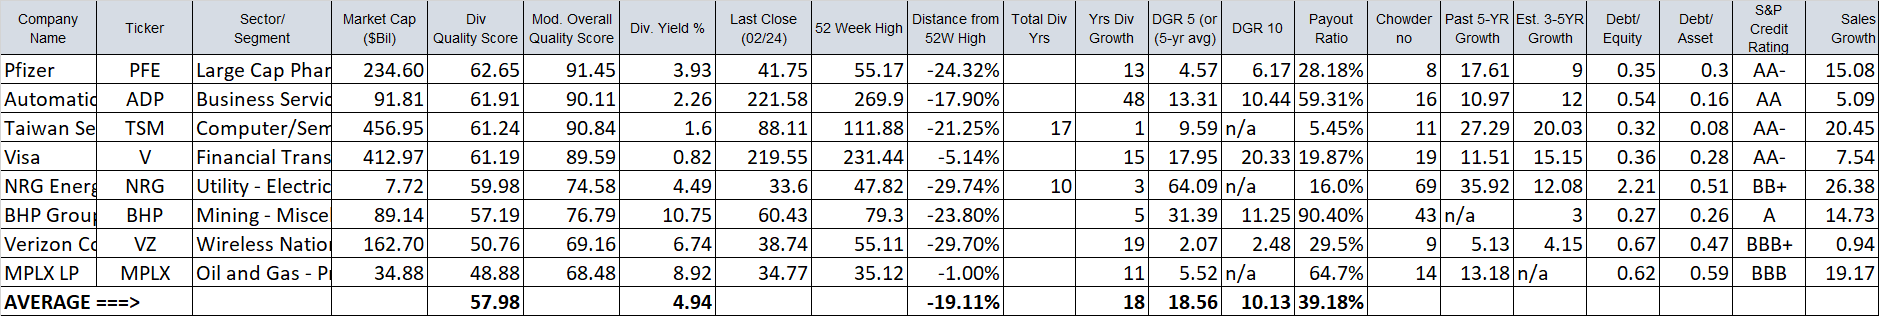
What If We Were To Combine The Three Lists?
If we were to combine the three lists and thereafter remove the duplicates (because of combining), we would be left with nine names. However, between CTRA, and MPLX, we keep MPLX (both from the Energy sector), so we now have eight names. The combined list is highly diversified in many industry segments. The stats for the group of 8 are as follows:
Average yield: 4.94%
Average discount (from 52WK High): -19.11%
Average 5-Yr dividend growth: 18.56%
Average Payout Ratio: 39.18%
Average Quality Score: 57.98
Table 2:
Conclusion
In the first week of every month, we start with a fairly large list of dividend-paying stocks and filter our way down to just a handful of stocks that meet our selection criteria and income goals. In this article, we have presented three groups of stocks (five each) with different goals in mind to suit the varying needs of a wider audience. Even though the risk profile of each group is different, each group in itself is fairly balanced and diversified.
The first group of five stocks is for conservative investors who prioritize the safety of the dividend and the preservation of their capital. The second group reaches for a higher yield but with only a slightly higher risk. However, the C-group comes with an elevated risk and is certainly not suited for everyone.
This month, the first group yields 3.04%, while the second group elevates the yield to 5.49%. We also presented a C-List for yield-hungry investors with a 6.97% yield. The combined group (all three lists combined with duplication removed) offers an even more diversified group with eleven positions and a 4.94% yield.
For further details see:
5 Relatively Safe And Cheap Dividend Stocks To Invest In - March 2023