KEYUF - 5 Ridiculously Cheap 6%-Plus Yielding Blue Chips For 2023
Summary
- 2022 has been a wild but profitable time for long-term income investors, and 2023 is likely to start out the same way.
- Five 6%-plus yielding blue chips are trading at ridiculously attractive valuations and are potentially set to soar in 2023 and beyond.
- They offer a very safe 7.2% yield, are 27% undervalued, trading at 8.5X earnings or cash flow, and could deliver 70% returns in the next two years.
- They have a BBB+ credit rating, a 25-year dividend growth streak, and offer 73rd global long-term risk management percentile according to the S&P.
- Long term, they could deliver close to 14% annual returns, just as they've done for the last 20 years. All while delivering 16% annual income growth and 8.2X more inflation-adjusted dividends than the S&P 500.
This article was published on Dividend Kings on Tuesday, Dec. 12.
Buyandhold 2012 is a legendary commenter on Seeking Alpha who has been investing since the 1970s in mostly blue-chip dividend stocks.
His dividend income has swelled to more than $600,000 per year, and he's achieved all our dreams of true financial freedom. Consider this.
October 2008: The S&P plummets 17% in a single month: His income keeps rolling in.
Pandemic crash: Market falls 34% in a single month; he's ecstatic because he's investing a fortune in excess dividends at very safe yields as high as 19%.
December 2018: S&P was down 9%, and he couldn't be happier because his annual income growth hasn't been negative in decades.
September 2022: the market was down 9%, and he couldn't care less because his excess dividend stream had never been higher.
This is a man who truly has learned the lessons of Buffett and has trained himself to focus purely on fundamentals and to be "greedy when others are fearful."
No matter how crazy the economy or market gets, he only cares about one thing, generous, safe, and steadily growing income. And thanks to blue-chip dividend stocks, his dividend stream is the stuff of legend.
His wealth is incredible, over $15 million. His fear during market crashes? Absolutely none.
This is a man we should all strive to emulate, no matter if we're investing $500 per month of $500,000.
Today I wanted to highlight five ultra-yield blue chips that offer incredible safe income growth opportunities. Not just in 2023 but far beyond.
What's coming in 2023? No one knows for sure, but we're likely facing a recession and a potentially painful final leg lower to the bear market in the first half of the year.
But if you buy these five ultra-yield blue-chip screaming bargains, then you can be like B&H 2012 and sleep well at night, awash in safe income no matter what happens with the economy.
How to Find The Best 6+% Yielding Blue-Chips For 2023... In One Minute
Let me show you how to screen the Dividend Kings Zen Research Terminal, which runs off the DK 500 Master List, to find the best ultra-yield blue chips.
- 6+% safe or very safe yield (2X the yield of VYM and 4X the yield of the S&P)
- non-speculative (for sleeping well at night in the 2023 recession)
The Dividend Kings 500 Master List includes some of the world's best companies, including:
- every dividend champion (25+ year dividend growth streaks, including foreign aristocrats)
- every dividend aristocrat
- every dividend king (50+ year dividend growth streaks)
- every Ultra SWAN (as close to perfect quality companies as exist)
- the 20% highest quality REITs according to iREIT
- 40 of the world's best growth blue-chips
Here's a quick and easy screen for finding the best ultra-yield sleep well at night blue-chips... in one minute flat.
| Step |
| Screening Criteria |
| Companies Remaining |
| % Of Master List |
| 1 |
| Strong Buy, Very Strong Buy, Ultra Value Buy (Never Overpay For Stocks) |
| 127 |
| 25.40% |
| 2 |
| 10+ Quality (Blue-Chip Or Better) |
| 121 |
| 24.20% |
| 3 |
| Non-Speculative Blue-Chips |
| 98 |
| 19.60% |
| 4 |
| 10+% long-term return potential (Market's historical return) |
| 74 |
| 14.80% |
| 5 |
| 6+% ultra yield |
| 5 |
| 1.00% |
| Total Time |
| 1 Minute |
It's really that easy when you have the right tools. From 500 of the world's best companies to just the five that best fit our particular goal today.
5 Ridiculously Cheap 6% Yielding Blue Chips For 2023
I've linked articles that dive deeply into each company's investment thesis, growth outlook, and risk profile.
In order of most to least undervalued, here are the best Ultra-Yield blue chips for 2023.
- British American Tobacco ( BTI )
- Altria ( MO )
- Keyera ( OTCPK:KEYUF )
- Enterprise Products Partners ( EPD ) - uses a K1 tax form
- Enbridge ( ENB )
Tax Implications
- KEYUF and ENB are Canadian companies (no K1 tax forms, 1099 qualified dividends)
- 15% dividend tax withholding in taxable accounts
- none in retirement accounts
- tax credit available for taxable accounts
- own in a retirement account to minimize tax preparation paperwork
FAST Graphs Up Front
British American Tobacco 2024 Consensus Total Return Potential
Altria 2024 Consensus Total Return Potential
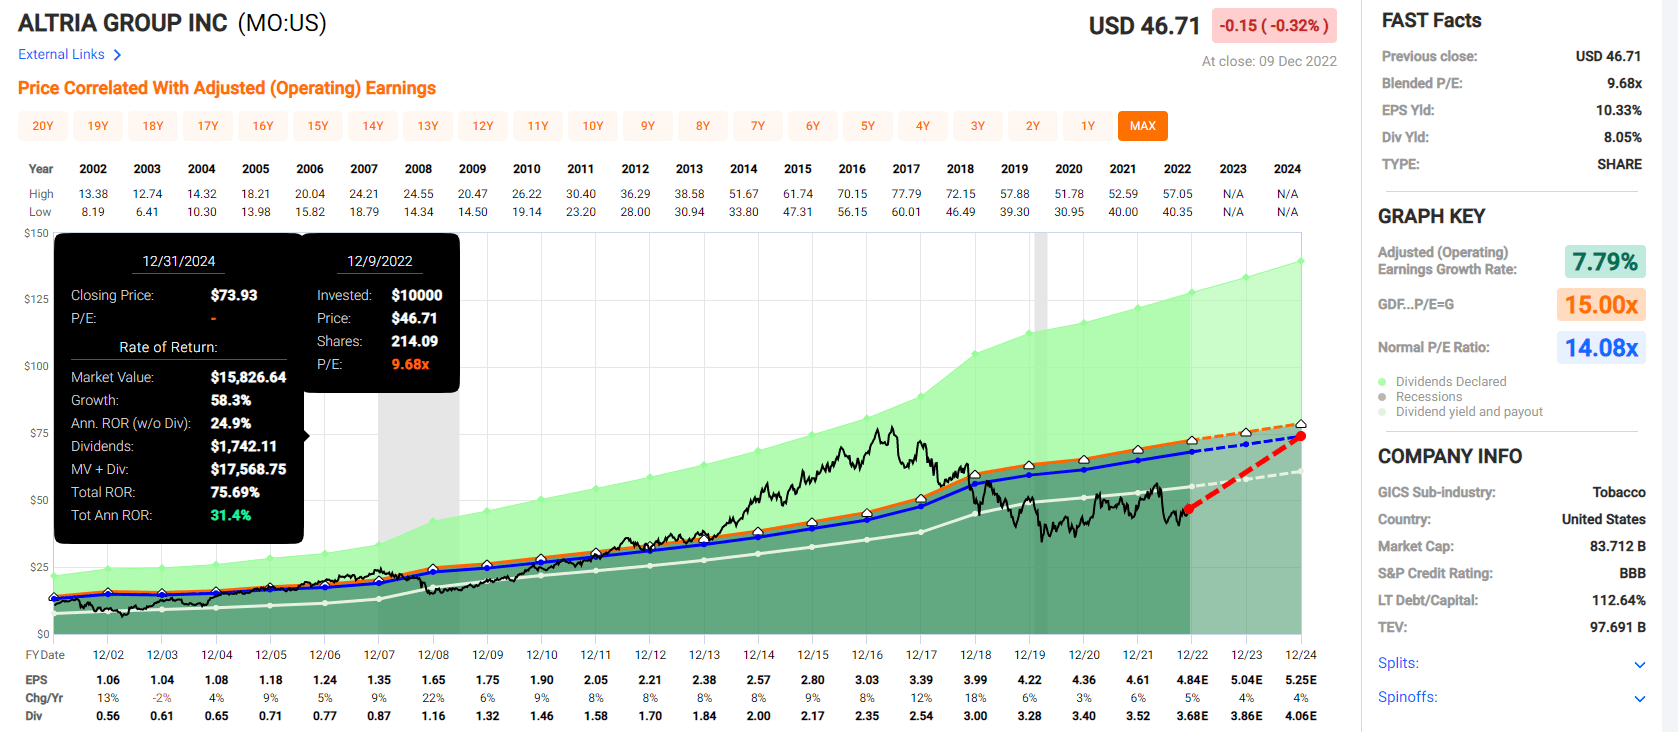
Keyera 2024 Consensus Total Return Potential
Enterprise Products Partners 2024 Consensus Total Return Potential
Enbridge 2024 Consensus Total Return Potential
Now compare that to the S&P 500.
S&P 2024 Consensus Total Return Potential
The consensus growth rate for earnings next year has fallen from 10% to 3% and is likely still too high.
- 0% to -20% is the blue-chip consensus
And yet even with earnings estimates likely still too high you can see that market return potential is solid, but basically at historical levels.
- Ultra-Yield bargains: 30% consensus annual return potential through 2024
- two-year total return potential: 69% vs. 20% S&P 500
- 3.5X better total return potential than the S&P 500
But my goal isn't to help you earn a quick 30% or even 70% over two years. I want to help you generate sensational safe income for years and decades to come.
5 Of The Safest Ultra Yield Blue-Chips On Wall Street
These aren't just Ultra-yield blue-chips; they are 13/13 Ultra-yield Ultra SWANs (sleep well at night). That means wide moat, very safe dividends, and exceptional dependability. Or, to put it another way, as close to perfect quality ultra-yield blue-chips as exist on Wall Street.
Let's see why.
Their average dividend cut risk in a historically average recession since WWII is about 0.5%.
- 1 in 200
Their average recession-cut risk in a Pandemic or Great Recession-level downturn is approximately 1.63%.
- 1 in 63
Ben Graham considered a 20+ year streak without dividend cuts an important sign of quality. A 20+ year dividend growth streak is the Graham standard of excellence.
Their average dividend growth streak is 25.4 years, making this effectively a dividend aristocrat ultra-yield portfolio bucket.
- average dividend growth streak every year since 1996
That's dividend growth every year through:
- four recessions
- three market crashes
- seven bear markets
- inflation as high as 9%
- interest rates as high as 7%
S&P estimates their average 30-year bankruptcy risk at 6.7%, a BBB stable credit rating.
- they yield almost as much as junk bonds but have a 7X lower 30-year bankruptcy risk
Most important for long-term investors going into a 2023 recession, S&P estimates their average long-term risk management global percentile at 73rd.
DK uses S&P Global's global long-term risk-management ratings for our risk rating.
- S&P has spent over 20 years perfecting their risk model
- which is based on over 30 major risk categories, over 130 subcategories, and 1,000 individual metrics
- 50% of metrics are industry specific
- this risk rating has been included in every credit rating for decades
The DK risk rating is based on the global percentile of how a company's risk management compares to 8,000 S&P-rated companies covering 90% of the world's market cap.
These Ultra-Yield Ultra SWANs score 73rd Percentile On Global Long-Term Risk Management
S&P's risk management scores factor in things like:
- supply chain management
- crisis management
- cyber-security
- privacy protection
- efficiency
- R&D efficiency
- innovation management
- labor relations
- talent retention
- worker training/skills improvement
- occupational health & safety
- customer relationship management
- business ethics
- climate strategy adaptation
- sustainable agricultural practices
- corporate governance
- brand management
These 5 Ultra-Yield Ultra SWAN Long-Term Risk Management Is The 185th Best In The Master List (63rd Percentile In The Master List_
| Classification |
| S&P LT Risk-Management Global Percentile |
| Risk-Management Interpretation |
| Risk-Management Rating |
| BTI, ILMN, SIEGY, SPGI, WM, CI, CSCO, WMB, SAP, CL |
| 100 |
| Exceptional (Top 80 companies in the world) |
| Very Low Risk |
| Strong ESG Stocks |
| 86 |
| Very Good |
| Very Low Risk |
| Foreign Dividend Stocks |
| 77 |
| Good, Bordering On Very Good |
| Low Risk |
| Ultra SWANs |
| 74 |
| Good |
| Low Risk |
| 5 Ultra-Yield Ultra SWAN Bargains |
| 73 |
| Good |
| Low Risk |
| Dividend Aristocrats |
| 67 |
| Above-Average (Bordering On Good) |
| Low Risk |
| Low Volatility Stocks |
| 65 |
| Above-Average |
| Low Risk |
| Master List average |
| 61 |
| Above-Average |
| Low Risk |
| Dividend Kings |
| 60 |
| Above-Average |
| Low Risk |
| Hyper-Growth stocks |
| 59 |
| Average, Bordering On Above-Average |
| Medium Risk |
| Dividend Champions |
| 55 |
| Average |
| Medium Risk |
| Monthly Dividend Stocks |
| 41 |
| Average |
| Medium Risk |
(Source: DK Research Terminal)
Their risk-management consensus is in the top 37% of the world's best blue chips and is similar to:
- Procter & Gamble ( PG ): Ultra SWAN dividend king
- Johnson & Johnson ( JNJ ): Ultra SWAN dividend king
- Federal Realty Investment Trust ( FRT ): Ultra SWAN dividend king
- Illinois Tool Works ( ITW ): Ultra SWAN dividend aristocrat
- Nike ( NKE ): Ultra SWAN
So now that you know why these are five Ultra-yielding Ultra SWANs you can trust, here's why you might want to buy some of them today.
6%-Plus Yielding Ultra SWANs Trading At Ridiculously Attractive Valuations
For context, the S&P trades at 17.2X forward earnings and a 2% historical discount.
These ultra-yield ultra SWAN bargains trade at 8.5X earnings or cash flow.
The S&P bottomed at 11.7X earnings in March 2009, the darkest days of the Great Recession.
The last time the S&P traded at 8.5X earnings? 1982, 41 years ago.
You can buy these Ultra-yield Ultra SWAN aristocrats at a lower price than the S&P has seen in four decades or likely will ever see again.
That's why analysts expect them to deliver 24% total returns in just the next year alone.
- compared to 10% for the S&P 500
Their fundamentally justified 12-month total return potential is 46%.
- if they all grow as expected and return to market-determined mid-range historical fair value within a year, you will make 46% within 12 months
But my goal isn't to help you earn 24% in one year, 46% within 12 months, or even 70% within two years, all of which these ultra-yield bargains are capable of.
My goal is to help you drown in safe dividends while potentially earning 50X returns over 30 years.
How These Ultra-Yield Ultra SWAN Aristocrats Can Potentially Help You Retire In Safety And Splendor
Not only do these Ultra SWAN aristocrats offer one of the safest 7.2% yields on earth, but they're also growing at almost the same rate as the S&P 500.
That means the potential for almost 14% long-term total returns.
Consensus Long-Term Return Potential (Assuming Zero Valuation Multiple Expansion)
| Investment Strategy |
| Yield |
| LT Consensus Growth |
| LT Consensus Total Return Potential |
| Long-Term Risk-Adjusted Expected Return |
| Long-Term Inflation And Risk-Adjusted Expected Returns |
| Years To Double Your Inflation & Risk-Adjusted Wealth |
| 10-Year Inflation And Risk-Adjusted Expected Return |
| 5 Ultra-SWAN Ultra-Yield Bargains |
| 7.2% |
| 6.7% |
| 13.9% |
| 9.7% |
| 7.3% |
| 9.8 |
| 2.03 |
| Safe Midstream |
| 5.9% |
| 6.4% |
| 12.3% |
| 8.6% |
| 6.2% |
| 11.6 |
| 1.83 |
| REITs |
| 3.9% |
| 6.1% |
| 10.0% |
| 7.0% |
| 4.6% |
| 15.7 |
| 1.57 |
| Schwab US Dividend Equity ETF |
| 3.5% |
| 8.5% |
| 12.0% |
| 8.4% |
| 6.0% |
| 12.1 |
| 1.78 |
| 60/40 Retirement Portfolio |
| 2.1% |
| 5.1% |
| 7.2% |
| 5.0% |
| 2.6% |
| 27.3 |
| 1.30 |
| Dividend Aristocrats |
| 1.9% |
| 8.5% |
| 10.4% |
| 7.3% |
| 4.9% |
| 14.8 |
| 1.61 |
| S&P 500 |
| 1.7% |
| 8.5% |
| 10.2% |
| 7.1% |
| 4.7% |
| 15.2 |
| 1.59 |
| Nasdaq |
| 0.8% |
| 11.8% |
| 12.6% |
| 8.8% |
| 6.4% |
| 11.2 |
| 1.87 |
(Sources: DK Research Terminal, FactSet, Morningstar, Ycharts)
7.2% yield and higher long-term return potential than just about any popular investing strategy. That includes the S&P 500, dividend aristocrats, SCHD, and even the Nasdaq.
What does that potentially mean for long-term investors? About a potential 50X return over the next 30 years.
Inflation-Adjusted Consensus Total Return Potential: $1,000 Initial Investment
| Time Frame (Years) |
| 7.8% CAGR Inflation-Adjusted S&P 500 Consensus |
| 8.0% Inflation-Adjusted Aristocrat Consensus |
| 11.5% CAGR Inflation-Adjusted 5 Ultra-Yield Ultra SWAN Bargain Consensus |
| Difference Between Inflation-Adjusted 5 Ultra-Yield Ultra SWAN Bargain Consensus And S&P Consensus |
| 5 |
| $1,453.75 |
| $1,469.33 |
| $1,723.35 |
| $269.60 |
| 10 |
| $2,113.39 |
| $2,158.92 |
| $2,969.95 |
| $856.56 |
| 15 |
| $3,072.33 |
| $3,172.17 |
| $5,118.27 |
| $2,045.94 |
| 20 |
| $4,466.40 |
| $4,660.96 |
| $8,820.58 |
| $4,354.18 |
| 25 |
| $6,493.02 |
| $6,848.48 |
| $15,200.98 |
| $8,707.96 |
| 30 (retirement time frame) |
| $9,439.23 |
| $10,062.66 |
| $26,196.67 |
| $16,757.44 |
| 35 |
| $13,722.27 |
| $14,785.34 |
| $45,146.11 |
| $31,423.84 |
| 40 |
| $19,948.73 |
| $21,724.52 |
| $77,802.70 |
| $57,853.97 |
| 45 |
| $29,000.45 |
| $31,920.45 |
| $134,081.55 |
| $105,081.10 |
| 50 |
| $42,159.37 |
| $46,901.61 |
| $231,069.90 |
| $188,910.52 |
| 55 |
| $61,289.14 |
| $68,913.86 |
| $398,215.08 |
| $336,925.94 |
| 60 (investing lifetime) |
| $89,099.03 |
| $101,257.06 |
| $686,265.30 |
| $597,166.28 |
(Source: DK Research Terminal, FactSet)
Over the next 30 years, these Ultra-Yield Ultra SWANs could potentially deliver 50X returns or 26X adjusted for inflation.
That's almost 3X more than the S&P 500 or dividend aristocrats.
| Time Frame (Years) |
| Ratio Inflation-Adjusted 5 Ultra-Yield Ultra SWAN Bargain Consensus/Aristocrat Consensus |
| Ratio Inflation-Adjusted 5 Ultra-Yield Ultra SWAN Bargain Consensus vs. S&P consensus |
| 5 |
| 1.17 |
| 1.19 |
| 10 |
| 1.38 |
| 1.41 |
| 15 |
| 1.61 |
| 1.67 |
| 20 |
| 1.89 |
| 1.97 |
| 25 |
| 2.22 |
| 2.34 |
| 30 (retirement time frame) |
| 2.60 |
| 2.78 |
| 35 |
| 3.05 |
| 3.29 |
| 40 |
| 3.58 |
| 3.90 |
| 45 |
| 4.20 |
| 4.62 |
| 50 |
| 4.93 |
| 5.48 |
| 55 |
| 5.78 |
| 6.50 |
| 60 (investing lifetime) |
| 6.78 |
| 7.70 |
(Source: DK Research Terminal, FactSet)
And over an investing lifetime, they offer about 7X better return potential than the S&P or aristocrats and could deliver life-changing wealth growth.
Think that tobacco and pipelines won't exist in 60 years? The bond market disagrees.
- EPD's longest-duration bonds mature in 55 years
- ENB just bought back bonds maturing in 2112
- BTI and MO plan to sell zero tobacco within 30 years (or less)
OK, so this all seems too good to be true. What evidence is there that these ultra-yield Ultra SWANs can actually deliver anything close to Nasdaq-beating 14% annual returns?
Historical Returns Since 2003
The future doesn't repeat, but it often rhymes. - Mark Twain
Remember, "past performance is no guarantee of future results."
But studies show that blue chips with relatively stable fundamentals offer predictable returns based on yield, growth and valuation mean reversion over time.
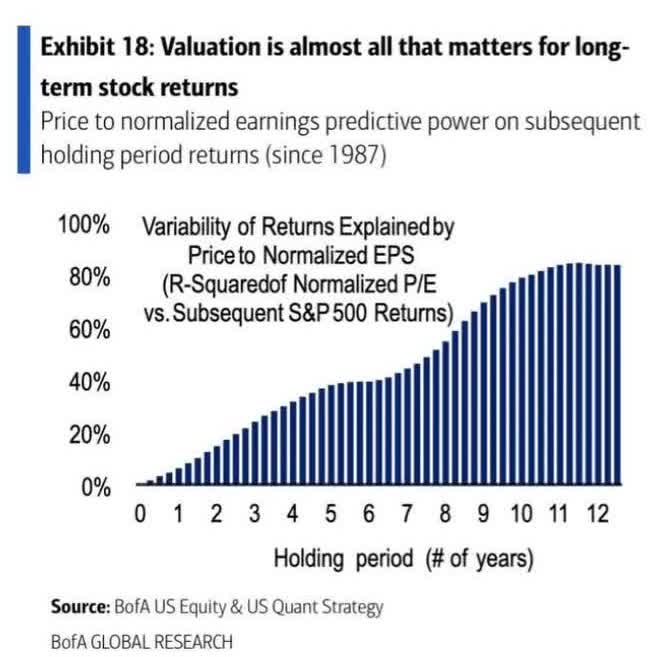
Nineteen years is a time period when 91% of returns are a result of fundamentals, not luck.
14% long-term returns? Check.
Market and Nasdaq-beating return? Check.
Relatively low volatility due to the defensive nature of these Ultra SWANs? Check.
- 20% better negative-volatility adjusted total returns than the Nasdaq (Sortino Ratio)
- 50% better negative-volatility adjusted total returns than the S&P 500
Average rolling returns of 12.5% to 15.5% for two decades, just like analysts expect in the future.
Oh, and let's not forget about the main purpose of ultra-yield blue chips, life-changing income.
Income That Rich Retirements Are Made Of
2007 and 2008 were 3 MO spin-offs ((Source: Portfolio Visualizer Premium))
Cumulative Dividends Since 2004 Per $1,000 Initial Investment
| Metric |
| S&P 500 |
| Nasdaq |
| 5 Ultra-Yield Ultra SWAN Bargains |
| Total Dividends |
| $855 |
| $522 |
| $7,044 |
| Total Inflation-Adjusted Dividends |
| $531.06 |
| $324.22 |
| $4,375.16 |
| Annualized Income Growth Rate |
| 7.9% |
| 17.8% |
| 15.8% |
| Total Income/Initial Investment % |
| 0.86 |
| 0.52 |
| 7.04 |
| Inflation-Adjusted Income/Initial Investment % |
| 0.53 |
| 0.32 |
| 4.38 |
| More Inflation-Adjusted Income Than S&P 500 |
| NA |
| 0.61 |
| 8.24 |
| Starting Yield |
| 2.1% |
| 0.4% |
| 6.9% |
| Today's Annual Dividend Return On Your Starting Investment (Yield On Cost) |
| 8.3% |
| 6.5% |
| 96.7% |
| 2022 Inflation-Adjusted Annual Dividend Return On Your Starting Investment (Inflation-Adjusted Yield On Cost) |
| 5.2% |
| 4.0% |
| 60.1% |
(Source: Portfolio Visualizer Premium)
After 20 years of 16% annual income growth, courtesy of numerous bear markets in which dividend reinvestment turbocharged income compounding, the Ultra-Yield Ultra SWANs delivered 8X more inflation-adjusted income than the S&P 500.
Their inflation-adjusted yield on cost is 60%, 12X more than the S&P and 15X more than the Nasdaq.
Turning These Ultra-Yield Ultra SWAN Bargains Into An Ultra SWAN Retirement Portfolio
Investing 100% of your savings into tobacco and pipelines isn't good risk management. But here's how we fix that.
- 33.33% SCHD or VYM (gold standard blue-chip high-yield ETFs)
- 16.7% EDV, ZROZ, or TLT (long-duration US treasury bonds)
- 16.7% DBMF, PQTAX, GIFMX, or AMFAX (managed futures funds)
- 33.33% Ultra Yield Ultra SWAN bargains (6.66% each)
Now instead of 100% tobacco and pipelines, we have 20% pipelines and 12% tobacco, a concentrated but still diversified and prudently risk-managed portfolio.
- Fidelity, Schwab, and Charlie Munger recommend 33% or less max sector concentration for concentrated portfolios
This is a ZEUS Ultra-Yield Ultra SWAN portfolio.
- ZEUS = Zen Extraordinary Ultra SWAN portfolio
ZEUS Portfolios are long-term recession optimized "set and forget and rebalance once per year" sleep-well-at-night portfolios that are far superior to the 60/40 retirement portfolio or even the S&P.
Here is the power of the ZEUS:
- optimal long-term asset allocation
- blue-chip assets
- 2+X the yield of a 60/40
- market-matching or beating long-term returns
- 33% lower annual volatility than the market
- 50% smaller peak declines in even the worst market crashes (like the Great Recession)
ZEUS Ultra Yield Ultra SWAN Portfolio Vs. 60/40
| Metric |
| 60/40 |
| ZEUS Ultra-Yield Ultra SWAN Portfolio |
| X Better Than 60/40 |
| Yield |
| 2.1% |
| 5.6% |
| 2.67 |
| Growth Consensus |
| 5.1% |
| 4.8% |
| 0.94 |
| LT Consensus Total Return Potential |
| 7.2% |
| 10.4% |
| 1.44 |
| Risk-Adjusted Expected Return |
| 5.0% |
| 7.3% |
| 1.44 |
| Safe Withdrawal Rate (Risk And Inflation-Adjusted Expected Returns) |
| 2.8% |
| 5.0% |
| 1.81 |
| Conservative Time To Double (Years) |
| 26.0 |
| 14.4 |
| 1.81 |
(Source: DK Research Terminal, FactSet)
Almost 3X the yield of a 60/40, with 44% better return potential, 81% higher safe withdrawal rates, and an 81% faster conservative doubling time.
ZEUS Ultra Yield Ultra SWAN Portfolio Vs. S&P 500
| Metric |
| S&P 500 |
| ZEUS Ultra-Yield Ultra SWAN Portfolio |
| X Better Than S&P 500 |
| Yield |
| 1.8% |
| 5.6% |
| 3.20 |
| Growth Consensus |
| 8.5% |
| 4.8% |
| 0.56 |
| LT Consensus Total Return Potential |
| 10.3% |
| 10.4% |
| 1.01 |
| Risk-Adjusted Expected Return |
| 7.2% |
| 7.3% |
| 1.01 |
| Safe Withdrawal Rate (Risk And Inflation-Adjusted Expected Returns) |
| 4.9% |
| 5.0% |
| 1.02 |
| Conservative Time To Double (Years) |
| 14.7 |
| 14.4 |
| 1.02 |
(Source: DK Research Terminal, FactSet)
Same returns as the S&P 500 but with more than 3X the yield and half the peak declines during even the most extreme market crashes.
ZEUS isn't just for retirees - it works wonderfully for young investors as well.
- next year I'm planning to rebalance my retirement portfolio into a ZEUS portfolio
- one with a 99.97% probability of long-term success
Inflation-Adjusted Consensus Total Return Potential: Per $510,000 Average Retired Couples Starting Savings
| Time Frame (Years) |
| 4.8% CAGR Inflation-Adjusted 60/40 |
| 8.0% Inflation-Adjusted ZEUS Ultra-Yield Ultra SWAN |
| Difference Between ZEUS Ultra-Yield Ultra SWAN Consensus and 60/40 Consensus |
| 5 |
| $644,728.09 |
| $737,978.55 |
| $93,250.47 |
| 10 |
| $815,047.66 |
| $1,067,867.35 |
| $252,819.69 |
| 15 |
| $1,030,361.01 |
| $1,545,221.96 |
| $514,860.95 |
| 20 |
| $1,302,554.28 |
| $2,235,962.10 |
| $933,407.82 |
| 25 |
| $1,646,653.58 |
| $3,235,474.66 |
| $1,588,821.08 |
| 30 (retirement time frame) |
| $2,081,654.53 |
| $4,681,786.10 |
| $2,600,131.57 |
| 35 |
| $2,631,570.86 |
| $6,774,623.01 |
| $4,143,052.15 |
| 40 |
| $3,326,760.08 |
| $9,802,993.13 |
| $6,476,233.04 |
| 45 |
| $4,205,599.33 |
| $14,185,095.48 |
| $9,979,496.15 |
| 50 |
| $5,316,603.94 |
| $20,526,071.09 |
| $15,209,467.16 |
| 55 |
| $6,721,105.64 |
| $29,701,569.15 |
| $22,980,463.51 |
| 60 (investing lifetime) |
| $8,496,638.38 |
| $42,978,668.75 |
| $34,482,030.37 |
(Source: DK Research Terminal, FactSet)
Over a 30-year retirement, ZEUS Ultra-Yield Ultra SWAN could potentially deliver an extra $2.6 million in inflation-adjusted returns for the average retired couple.
Over an even longer time frame, the potential extra returns climb into the tens of millions.
| Time Frame (Years) |
| Ratio ZEUS Ultra-Yield Ultra SWAN Portfolio Vs. 60/40 Consensus |
| 5 |
| 1.1 |
| 10 |
| 1.3 |
| 15 |
| 1.5 |
| 20 |
| 1.7 |
| 25 |
| 2.0 |
| 30 (retirement time frame) |
| 2.2 |
| 35 |
| 2.6 |
| 40 |
| 2.9 |
| 45 |
| 3.4 |
| 50 |
| 3.9 |
| 55 |
| 4.4 |
| 60 (investing lifetime) |
| 5.1 |
(Source: DK Research Terminal, FactSet)
This is the power of combining the best blue-chip assets, including the best individual stocks. This is the power of ZEUS.
Historical Returns Since December 2007 (Start Of The Great Recession)
3% more annual returns than a 60/40? Market-like returns? Check.
But with 40% less annual volatility than the S&P and 25% less than a 60/40.
A peak decline that's half as much as a 60/40 during the Great Recession and 60% less than the S&P 500.
Negative-volatility-adjusted total returns are 2X more than a 60/40, 33% more than the Ultra SWANs alone, and 50% more than the S&P 500.
Smooth and consistent superior returns to the 60/40, and just take a look at the low volatility.
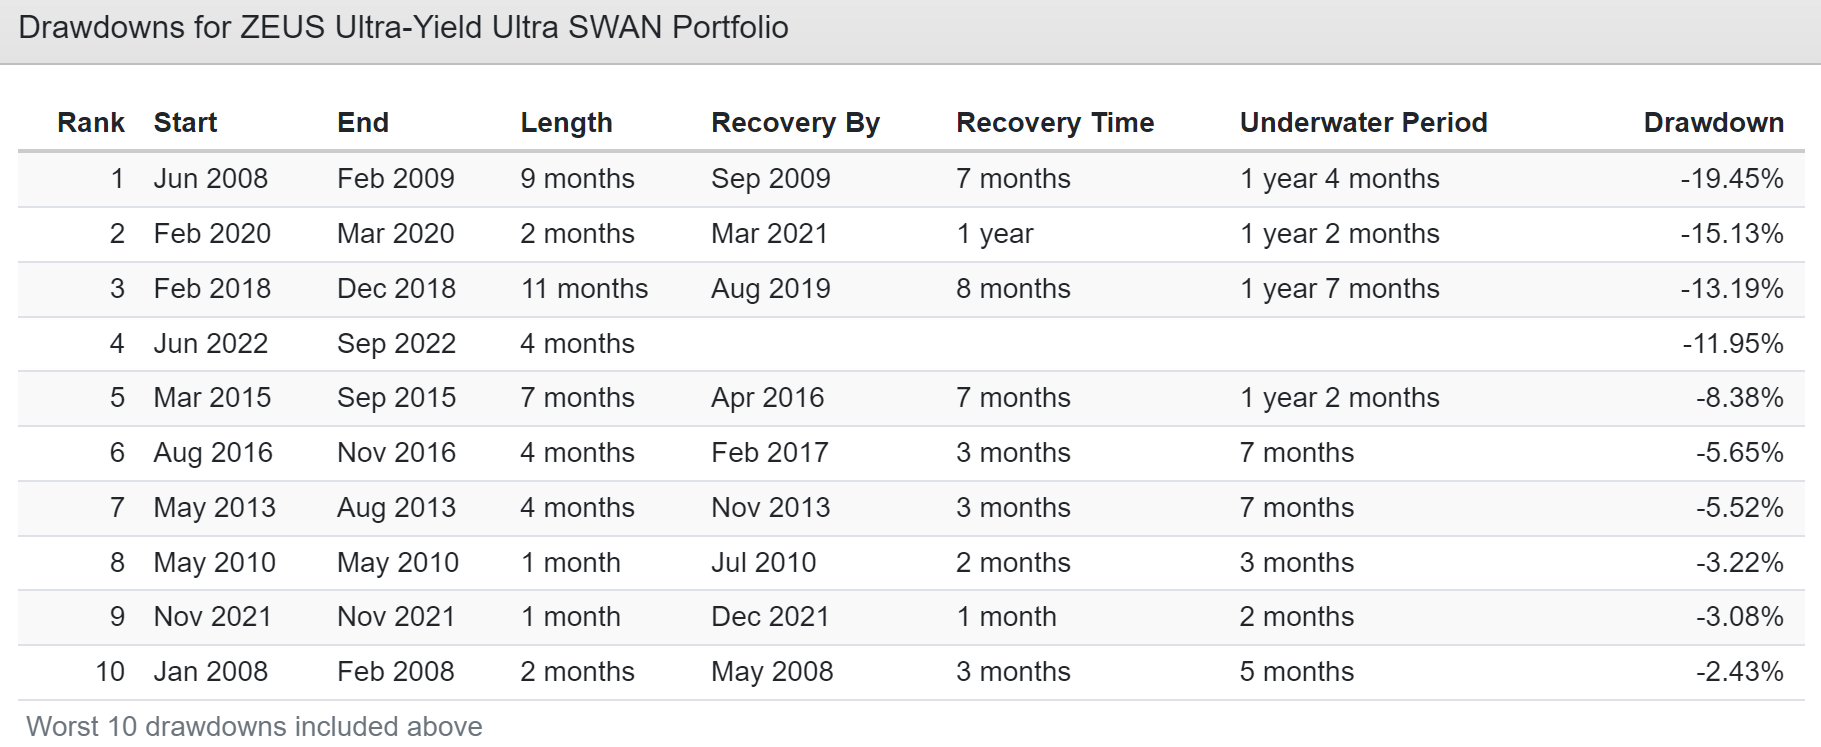
In the last 15 years, the S&P has had four bear markets and 60/40 two.
ZEUS Ultra-Yield Ultra SWAN hasn't suffered one. Not even during the second-largest market crash in US history.
10,000 Monte Carlo Simulations: Stress Testing The Next 75 Years
The statistical probability of this portfolio suffering a 20+% bear market in the next 75 years is approximately 5.33%.
- 1 in 18.8
- a bear market is expected once every 1,410 years
- the S&P once every six years
In any given year, ZEUS Ultra-Yield Ultra-SWAN is 235X less likely than the S&P 500 to suffer a bear market.
What about a 40+% crash?
Approximate probability 0.06% = 1 in 1,667
- a 40+% ZEUS crash is expected once every 125,025 years
- the S&P 500 once every 50 years
In any given year, ZEUS Ultra-Yield Ultra-SWAN is 2,501X less likely than the S&P 500 to suffer a 40%-plus crash.
Do you see why I call the ZEUS portfolio strategy the king of sleep-well-at-night portfolios?
OK, so maybe ZEUS did really well during the Great Recession, but what about all the other bear markets the US market has suffered over the last 15 years?
ZEUS Ultra-Yield Ultra SWAN During The Great Recession
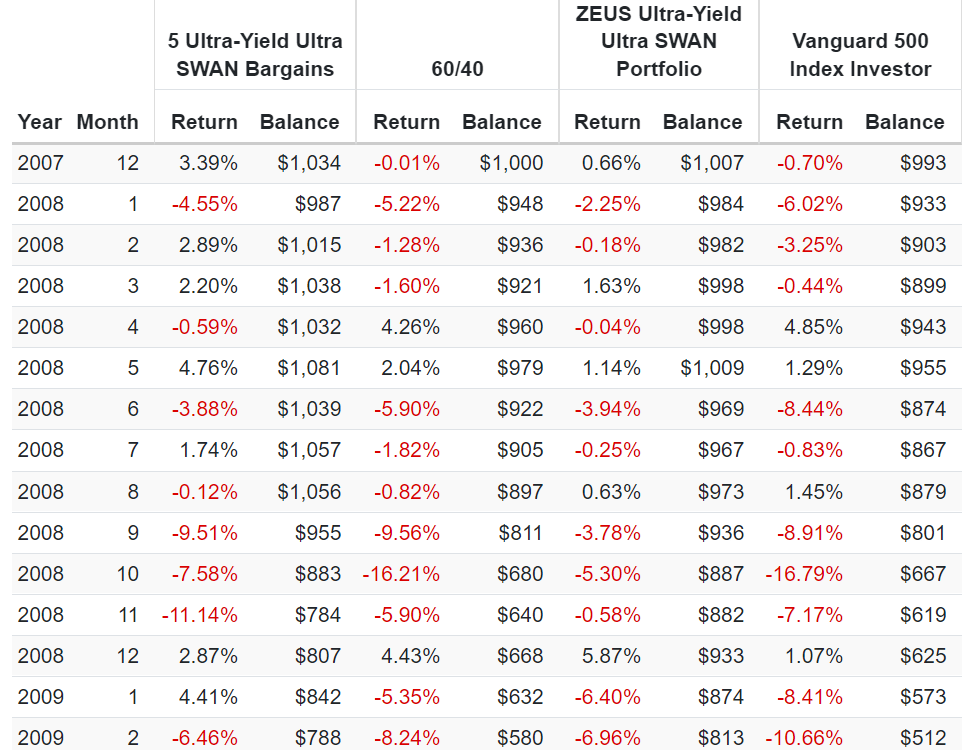
During the ultimate baptism by fire for any sleep-well-at-night retirement portfolio ZEUS was spectacular.
- fell 5% in October 2008 when the S&P fell 17% and the 60/40 16%
- fell 7% in February 2009 when the S&P fell 11% and the 60/40 8%
- fell 2% in January 2008 when the S&P fell 6% and a 60/40 5%
ZEUS Ultra-Yield Ultra SWAN During The 2011 Bear Market
During the 2011 bear market, the S&P hit -22% intra-day, including a 7% decline in September 2011.
ZEUS Ultra-Yield Ultra SWAN went UP 3.4% while the market fell off a cliff and a 60/40 fell 16%.
Like riding over a major market pothole in hovercraft.
ZEUS Ultra-Yield Ultra SWAN During The 2018 Bear Market
During the 2018 bear market, the S&P hit -a 21% peak intra-day, including a 9% decline in December.
ZEUS Ultra-Yield Ultra SWAN fell just 8% at its peak, including 1/3rd the market's decline in December.
And this was with 33% of the portfolio in a deep bear market (tobacco and pipelines).
ZEUS Ultra-Yield Ultra SWAN During The Pandemic Crash
During the pandemic, oil hit -$38 in the worst oil crash in human history. The Ultra-Yield Ultra SWANs fell 75% more than the S&P, but ZEUS Ultra-Yield Ultra SWAN fell just 15%, barely more than a 60/40 and 25% less than the S&P 500.
ZEUS Ultra-Yield Ultra SWAN During The 2022 Stagflation Bear Market
The peak decline so far in this bear market:
- Nasdaq -35%
- S&P -28%
- 60/40 -21%
- ZEUS Ultra-Yield Ultra SWAN: -11%
During the worst bond bear market in US history and the fifth worst bond bear market in human history, ZEUS still did its job, falling 60% less than the S&P 500.
- In no bear market in the last 15 years, ZEUS failed to deliver the lower volatility it was designed to deliver.
That includes falling 6% during the market's 9% decline in September and just 1% in the 9% April decline.
In December, when the market is down 4% so far, ZEUS is down 1.4%, about one-third as much.
This is the power of a diversified blue-chip portfolio; this is the power of ZEUS.
Bottom Line: These Are The Best Ultra-Yield Ultra SWANs For 2023... And Beyond
Let me be clear: I'm NOT calling the bottom in any of these Ultra SWANs (I'm not a market timer).
Ultra SWAN quality does NOT mean "can't fall hard and fast in a bear market."
Fundamentals are all that determine safety and quality, and my recommendations.
- over 30+ years, 97% of stock returns are a function of pure fundamentals, not luck
- in the short term; luck is 25X as powerful as fundamentals
- in the long term, fundamentals are 33X as powerful as luck
While I can't predict the market in the short term, here's what I can tell you about BTI, MO, EPD, ENB, and KEYUF.
- very safe 7.2% yield
- 25-year average dividend growth streak
- BBB+ stable credit rating
- 73rd percentile global long-term risk management
- 6.7% long-term growth outlook
- 13.9% long-term return potential (just as they've delivered over the last 20 years)
- 27% undervalued (potential very strong buy)
- 8.5X price/earnings or price/cash flow
Here they are if you're looking for the most outrageously attractive ultra-yield Ultra SWANs for 2023.
If you're looking for the safest 7.2% yield on Wall Street, they don't come any safer than this.
And if you're looking for a great core ultra-yield bucket around which to construct a diversified and prudently risk-managed ultra-yield retirement portfolio that runs circles around the 60/40 or even the S&P 500, then combine these with EDV, SCHD, and DBMF.
- 5.6% safe yield (almost 3X more than a 60/40 and 3.2X more than the S&P 500)
- 10.4% long-term return potential vs. 10.2% S&P 500 and 7.2% 60/40
- 2.2X the inflation-adjusted return potential of the 60/40 over the next 30 years
- 40% lower volatility than the S&P 500 and 25% less than the 60/40
- 19.7% peak decline during the Great Recession
- 10.6% peak decline in the 2022 bear market
- 5% chance of a bear market in the next 75 years
- 235X less likely to suffer a bear market in any given year than the S&P 500
- 2,501X less likely to suffer a 40+% market crash in any given year than the S&P 500
This is how you go into 2023, sleeping well at night and full of holiday cheer.
This is how you take charge of your financial destiny and stop obsessing about what the Fed or inflation is doing.
This is how you harness the power of the world's greatest blue-chips to work hard for you so that one day you won't have to.
For further details see:
5 Ridiculously Cheap 6%-Plus Yielding Blue Chips For 2023