VPU - 6 ETFs For A High Yield Dividend Portfolio In 2024
2023-12-27 01:24:13 ET
Summary
- The model portfolio has 6 ETFs in total. Collectively, they yield 3.77%, with the average expense ratio chiming in at .15%.
- The highest yield of the bunch is The SPDR Portfolio High Yield Bond ETF at 7.29%.
- This portfolio is designed to play the market themes for the year.
A 2024 Theme of coiled spring under performers
Rolling into 2024, the collective echo from financial media is rotation into under-performers, particularly those that are considered "value" versus growth. My favorite underperforming sectors and asset classes fall within the below categories:
- REITs
- Small caps
- High-yield and long duration bonds
- Utilities
- Regional banks
Within this 6 fund ETF portfolio, I am doubling up percentage-wise on only one category, bond funds. In the model, I will include one for taking advantage of yield and one for duration. As we come into possible rate cuts versus hikes, many of these rate-sensitive sectors are wound up like coiled springs. Jump in before Jerome Powell moves his first chess piece.
Model portfolio yield and expense ratios
| ETF |
| YIELD |
| EXPENSE RATIO |
| (VPU ) |
| 3.52% |
| 0.10% |
| (TLT ) |
| 3.39% |
| 0.15% |
| (SPHY ) |
| 7.29% |
| 0.05% |
| (VNQ ) |
| 3.98% |
| 0.12% |
| (VTWO ) |
| 1.44% |
| 0.10% |
| (KRE ) |
| 2.99% |
| 0.35% |
| AVERAGE |
| 3.77% |
| 0.15% |
The model portfolio has 6 ETFs in total. Collectively they yield 3.77% with the average expense ratio chiming in at .15% . The highest yield of the bunch is The SPDR Portfolio High Yield Bond ETF at 7.29%. This portfolio is designed to play the market themes for the year. While it may not beat the market over the decade to come, it has a great chance to beat in the next 12 months in my opinion.
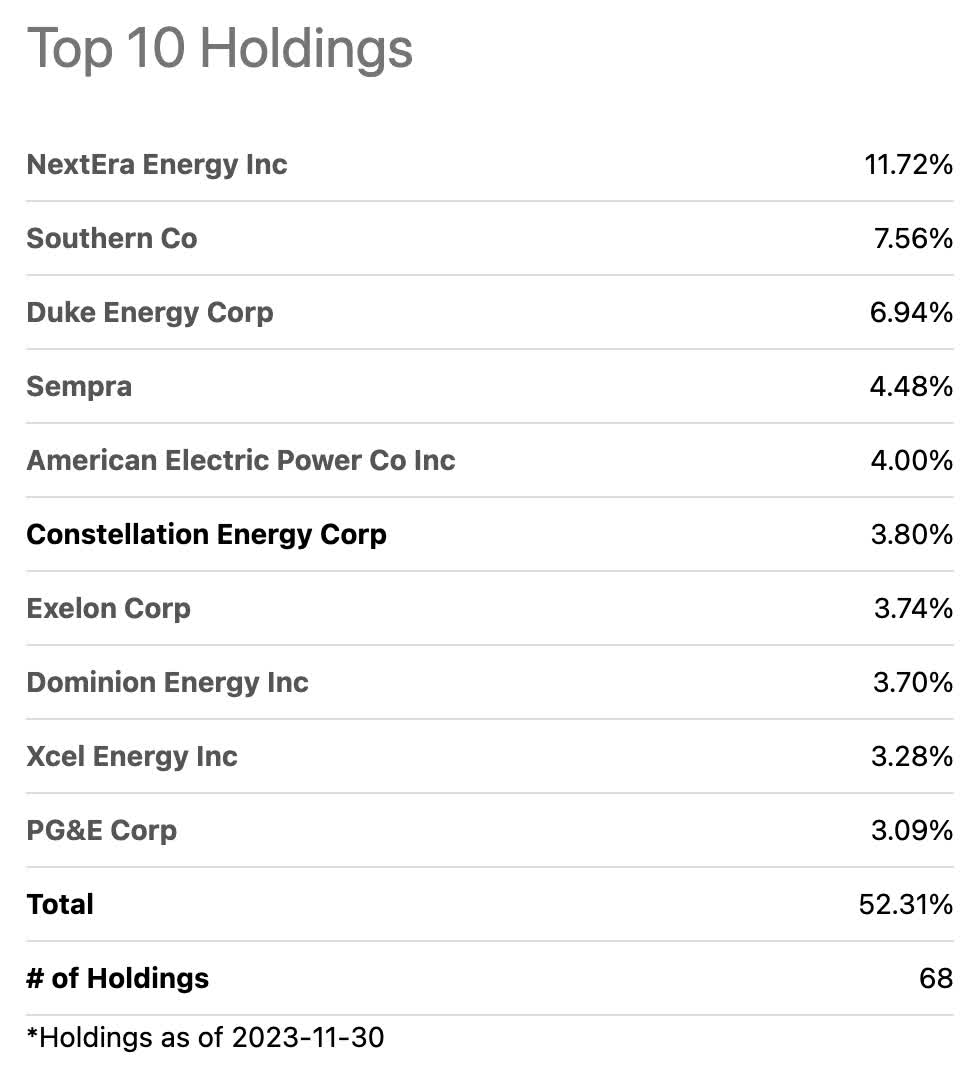
Vanguard Utilities Index Fund ETF Shares
Index followed: MSCI US IMI Utilities 25/50
Firstly we have the utilities sector. This sector is interest rate sensitive both for the reason that utility dividends were once thought to be as easy a cash flow as a high-quality bond, combined with the fact that many utilities have to rely on debt for the very expensive expansions and CAPEX maintenance. Now that the risk-free rate is so high, a dividend in the utility sector is no longer as attractive as it once was.
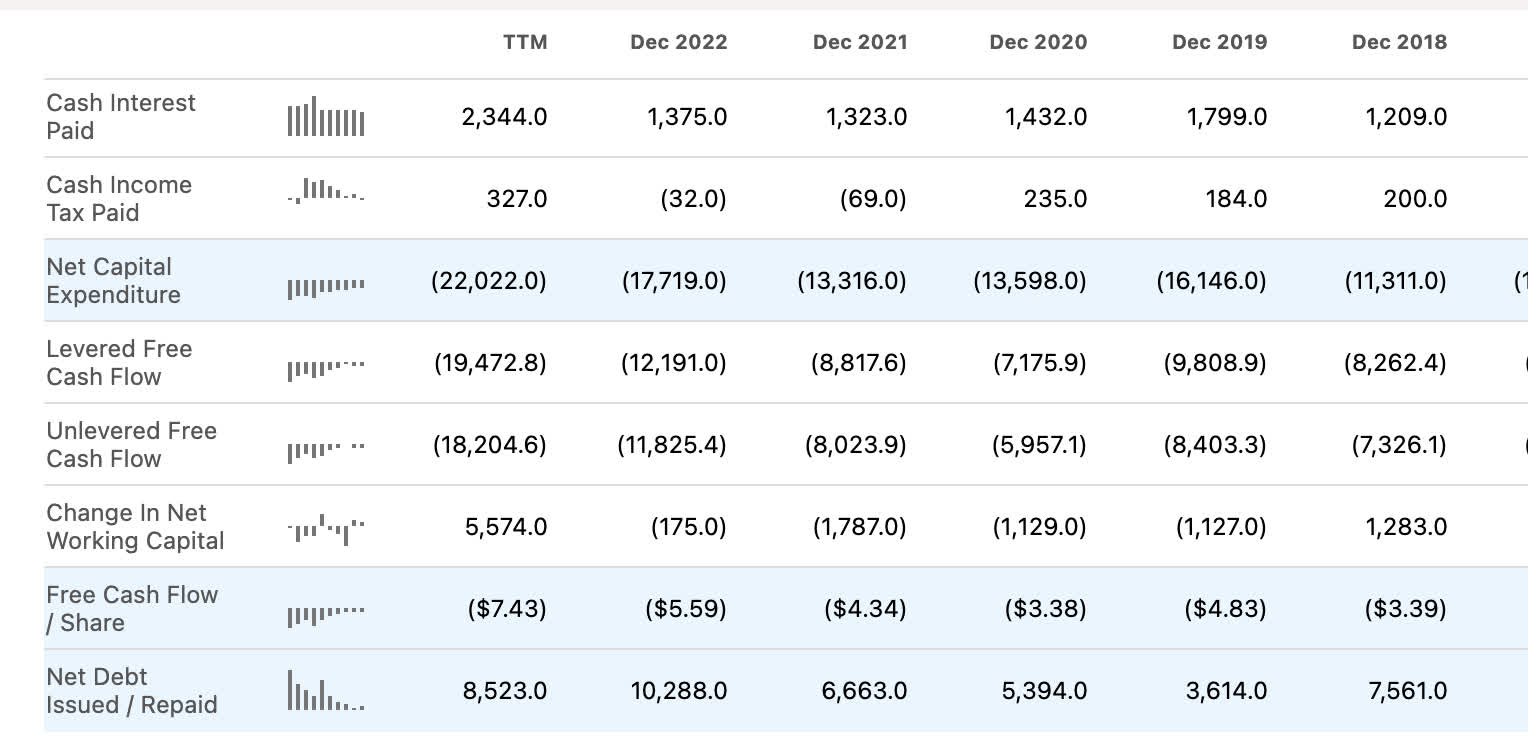
An example of this is NextEra Energy ( NEE ), VPU's highest weighted holding. Although their dividend has been popular and reliable, the large ever expanding utility company has had to rely on debt to expand due to massive capital expenditures, acquisitions and the cost of new buildouts.
We can see the signs of expansion in excess of cash from operations on the cash flow statement. Net Capital Expenditure increasing every year, net debt issued versus repaid annually, and ever increasingly negative free cash flow per share.
But, this is also an essential industry with more access to subsidies and tax incentives/rebates than almost any other sector. It should continue to operate this way. The biggest risks to the sector are lawsuits and fires which are hard to factor into cash flow equations. That being said, rate cuts should lift the sector as the cost of capital falls and ROIC improves.
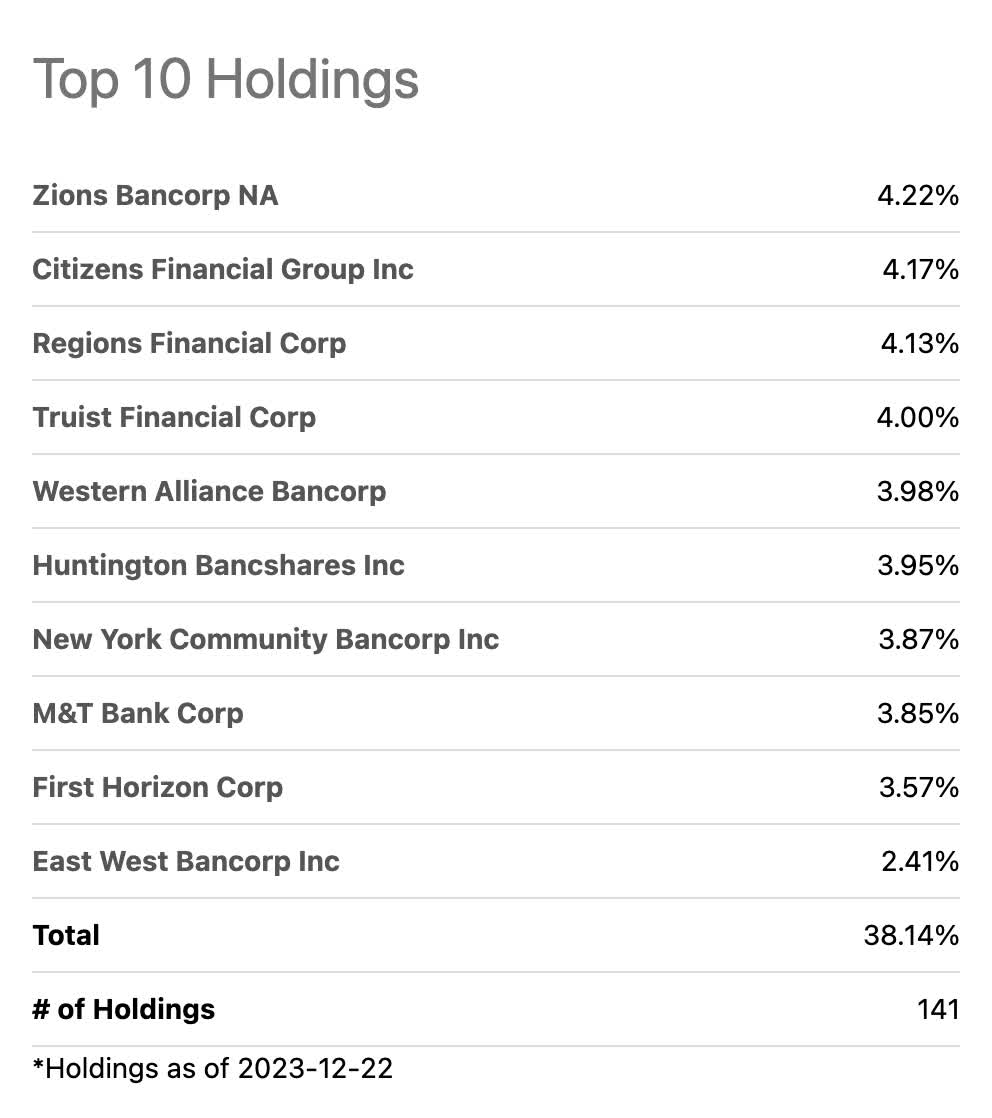
SPDR S&P Regional Banking ETF
Index followed: S&P® Regional Banks Select Industry Index
The regional banking sector to me is a sector within a rotation. The small-cap rotation is very low P/E and very low on a book value multiple basis. The regional banks are some of the most attractive names within the Russell 2000 and this fund gets you exposure to the sector across 141 regional banks. Many are worried about the regional bank commercial real estate loan book of business, but again, rate cuts should help developers extend their loans with regionals and alternative lenders in some way that makes it feasible for both parties.
Larger cities with higher exposure to office, like New York and Mayor Eric Adams, are moving to expedite rezoning of finished and unfinished office buildings alike. The rezoning alone will improve the values of scores of commercial real estate to either sell or hit required appraisal values to access refinancing:
The Adams administration launching an Office Conversion Accelerator to expedite complex office-to-housing conversion projects - speeding up the process of creating new housing while putting millions of square feet of empty offices to better use for New Yorkers.
I am more optimistic than the everyday pundits about the deals getting done to save the commercial real estate industry. The Regional Banking industry is ripe with deals.
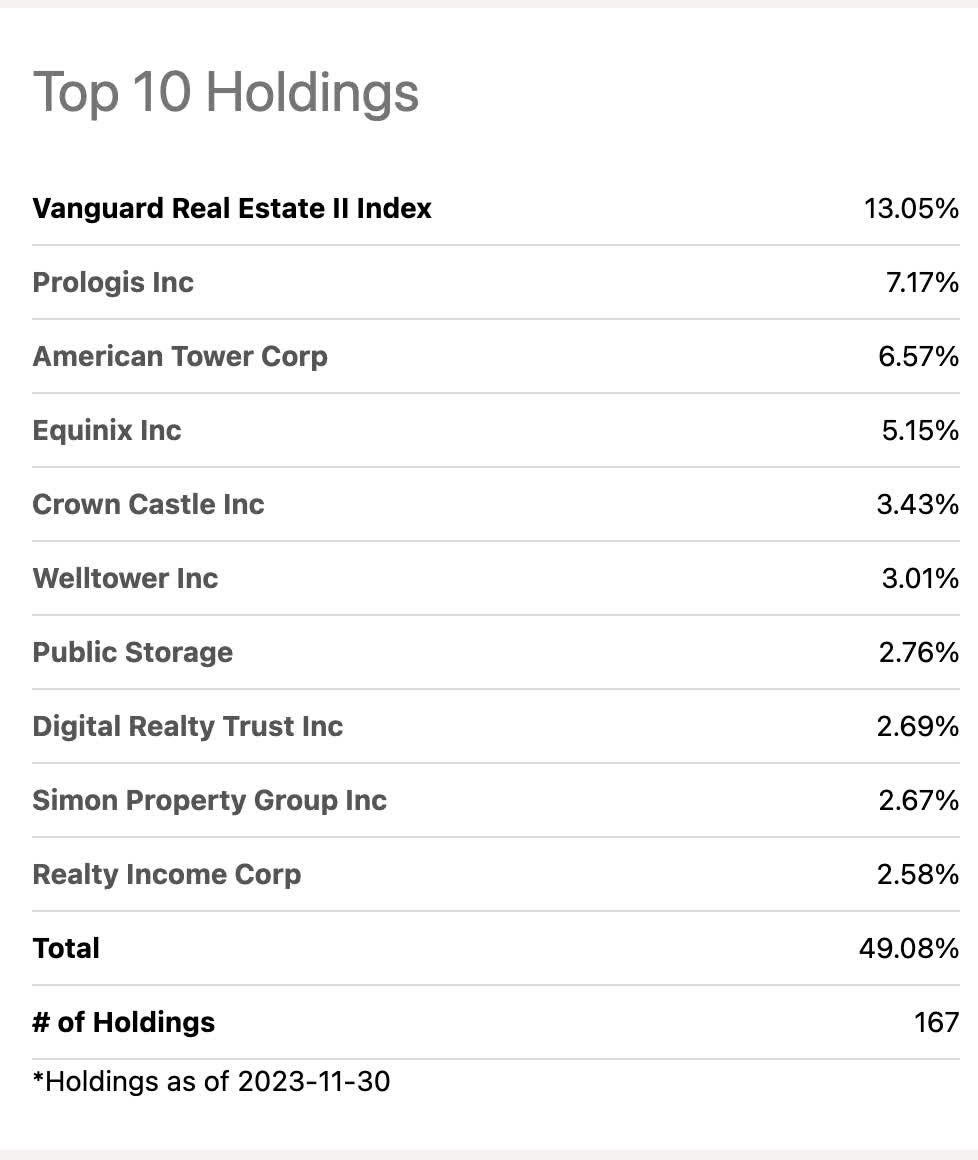
Vanguard Real Estate Index Fund ETF Shares
Index followed: MSCI US Investable Market Real Estate 25/50 Index
The majority of REIT index funds portray a common theme, higher weightings of industrial logistics, storage, and cell towers. Most are avoiding office and to a lesser extent retail in the top 10 holdings. VNQ and other low-cost index funds are a great way to take advantage of the rate-sensitive, bond proxy industry with yields hitting the top of their 10-year averages. As rent is an operating expense for a corporation, rent/lease payment is even senior to interest payments on debt until a judge allows the operator to reject a lease in bankruptcy. REITs rarely go under due to this.
REITs are also very rate-sensitive. Deals get done with leverage and share dilution. Lower rates should result in less dilution. With the sector as a whole down 23% rolling into the year, this is one of my favorite bets.
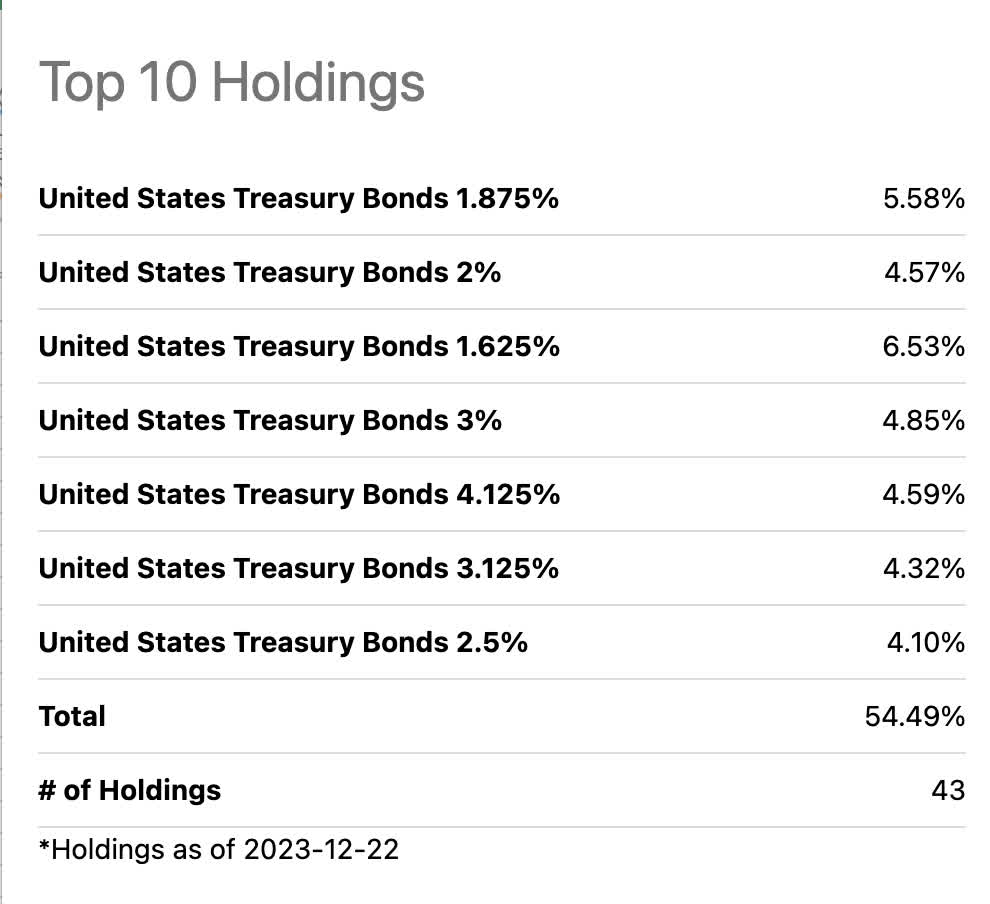
iShares 20+ Year Treasury Bond ETF
The iShares 20+ Year Treasury Bond ETF seeks to track the investment results of an index composed of U.S. Treasury bonds with remaining maturities greater than twenty years.
I recently wrote an article comparing TLT to SPHY . This was a comparison of yield versus duration and what was a better deal at the moment. I picked and prefer the shorter duration, higher yield "junk" bond funds that are selling with yields in the 6-7% range versus 3-4% for most high-grade corporate bond funds or U.S. Treasury Funds.
This article is my initial upgrade of this idea that the community has convinced me of. Reading back through When Genius Failed: The Rise and Fall of Long-Term Capital Management by Roger Lowenstein, there are other elements to Treasury funds versus just duration alone. When Russia defaulted on its sovereign debt in 1998, the whole world piled into the 10 and 20-year U.S. Treasury, driving the yield down without FED rate cuts.
For those not familiar with Long Term Capital Management's story, it was a mid to late 90s hedge fund comprised of erudite and Ivy League professors. They bet on bond arbitrage and yield convergence for on-the-run and off-the-run bonds. They were very convincing salesmen, and with the help of Wall Street, had at one point a $120+ Billon fund leveraged 30 to 1. The story did not end well for the paper billionaire partners who were wiped out in about a week when the Russian defaults sent the world bond market into a tizzy where bond math no longer worked. Fun fact, Warren Buffett almost bought the entire portfolio for $250 million while he was on vacation with Bill Gates in Alaska.
Back to the pick, rate cuts should not only send this up incrementally multiplied by the roughly 20 year duration, but a sovereign default could light this fund up like a Christmas tree. China is in all kinds of debt with their commercial real estate crisis [for which they are a partner to many deals, unlike U.S. real estate development] combined with high speed rail debt. South America is seeing a socialist/communist revolution. That never ends well. The EU probably would not default on anything as a region, but smaller micro-defaults could certainly happen.
TLT is a good bet in 2024.
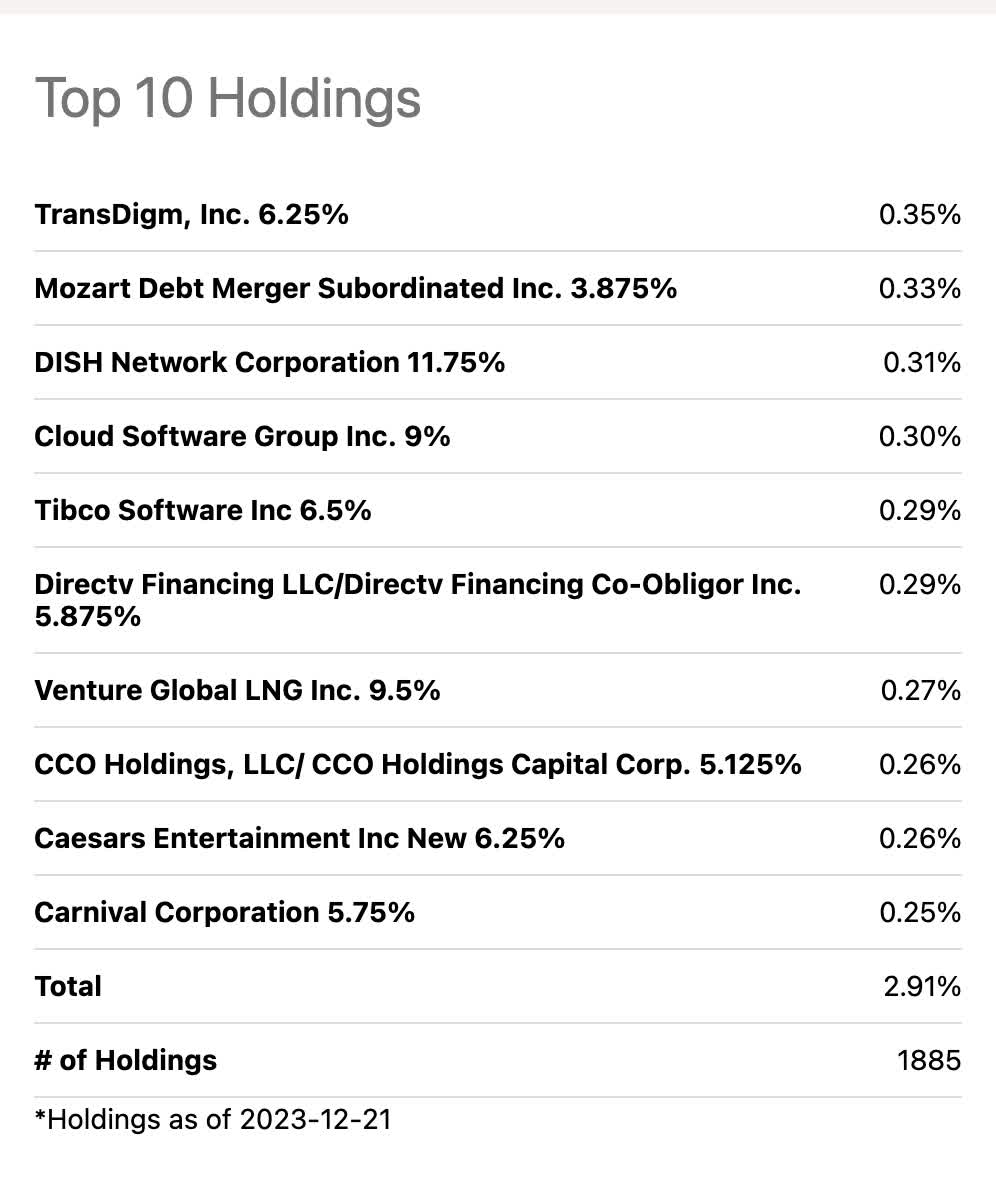
SPDR Portfolio High Yield Bond ETF
Index followed: ICE BofA US High Yield Index
This high-yield bond portfolio juices up the return of the 6 picks ringing in at a 7.29% yield. The nearly 1900 bond index fund of below investment grade corporate bonds, still has many names that we all know. Airlines, automotive, energy, and utilities throughout. I like exposure to high yield debt not related to commercial real estate. This fund gets you great exposure. Great investors of the past and present such as Peter Lynch and Warren Buffett have been noted for their kinship with high-yield debt and preferred equities. They are also known for shunning long duration U.S. Treasuries.
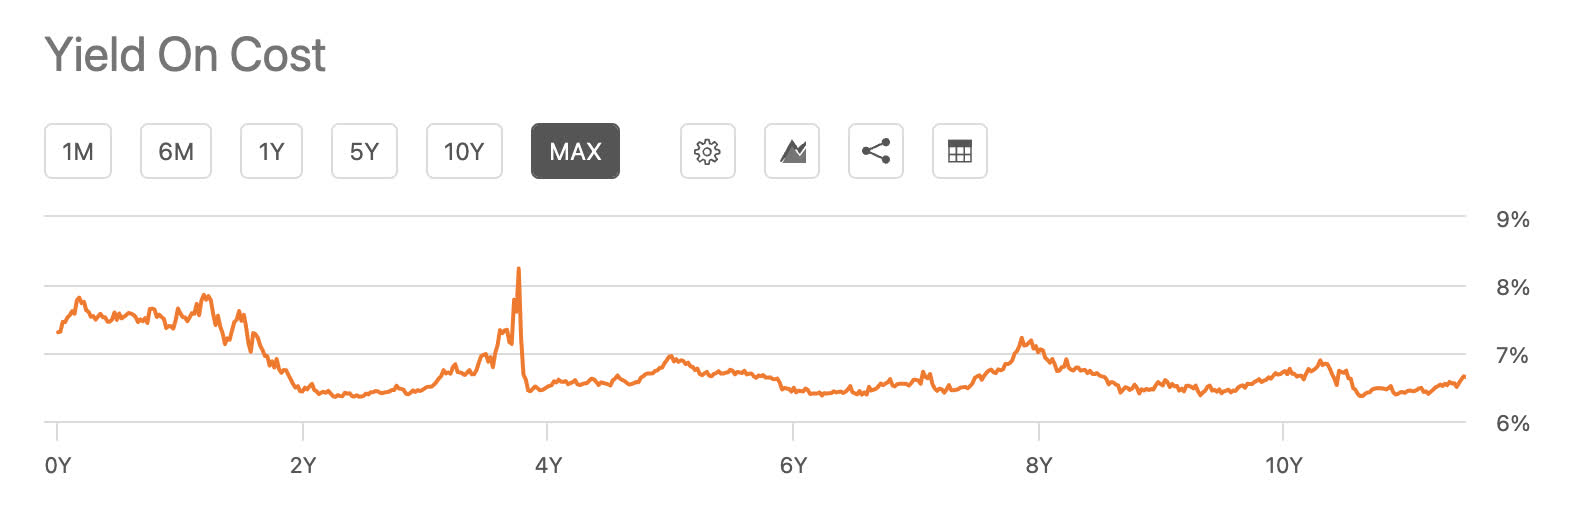
This index fund is now honing in on near all-time high yield on cost. I think TLT is a great trade, this is an excellent buy and hold. After reviewing some actively managed bond mutual funds for family members this past week as they prepare for the shift out of money markets, they all had expense ratios in the .5-1.5% range. Many were juicing yields with mortgage backed and sovereign debt-related holdings. They still all had a lower yield than if I had bought a 50/50 TLT, SPHY bond portfolio net of fees. Give me this low-cost index bond fund portfolio at a .05% expense ratio any day of the week!
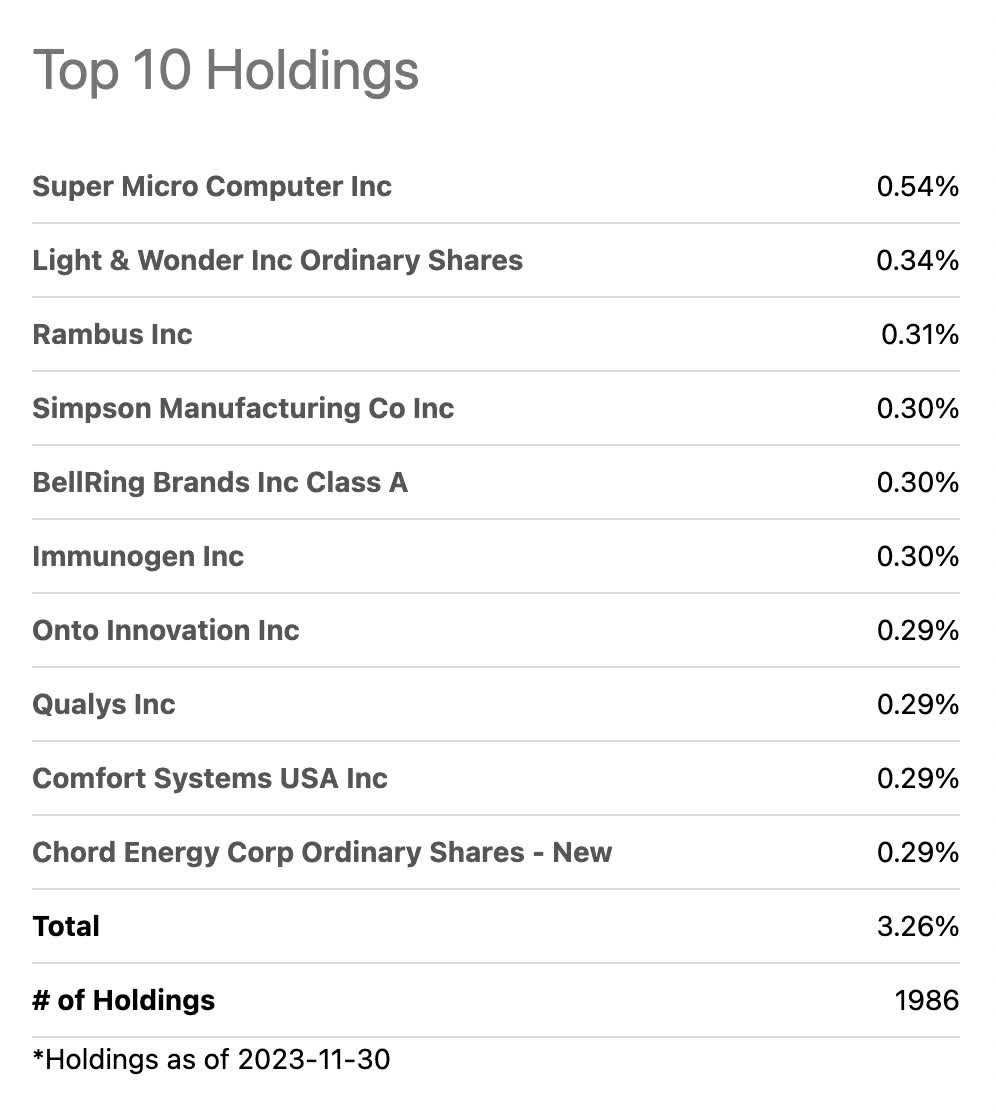
Vanguard Russell 2000 Index Fund ETF Shares
Index followed: Russell 2000 Index
Listening to financial pundits, almost every fund manager invited to speak on Bloomberg or CNBC says that funds are looking for small-cap deals in a declining rate environment. As access to capital will become easier for the less credit-worthy, smaller companies, their expansion should improve and PEG ratios drop.
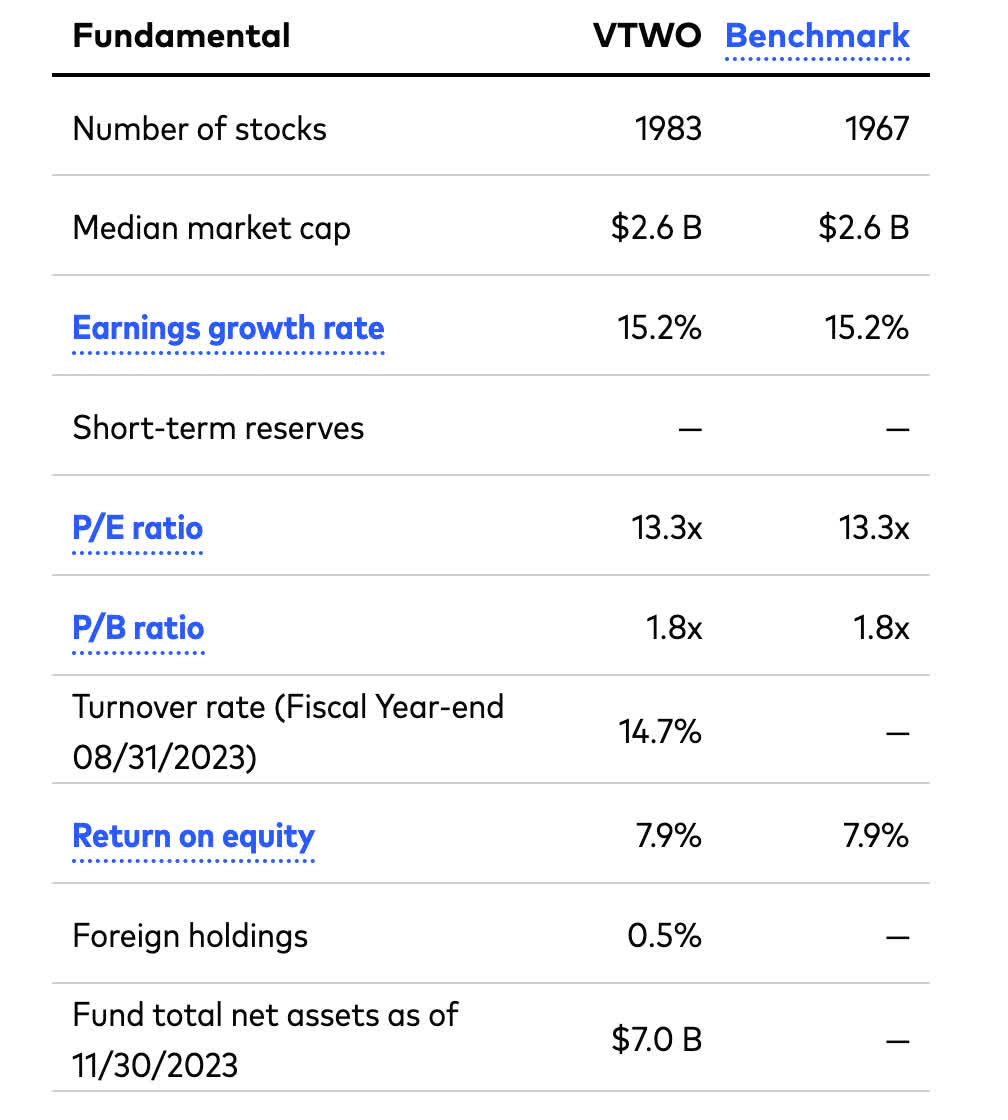
With an average P/E ratio of 13.3 X and an average price-to-book ratio of 1.8 X, the entire index collectively almost qualifies as a Graham Number value index. The Graham number is the price at which the P/E ratio times the P/B ratio does not cross 22.5. The index itself is hovering around 23. Impressive for an entire index.
A model $10,000 portfolio
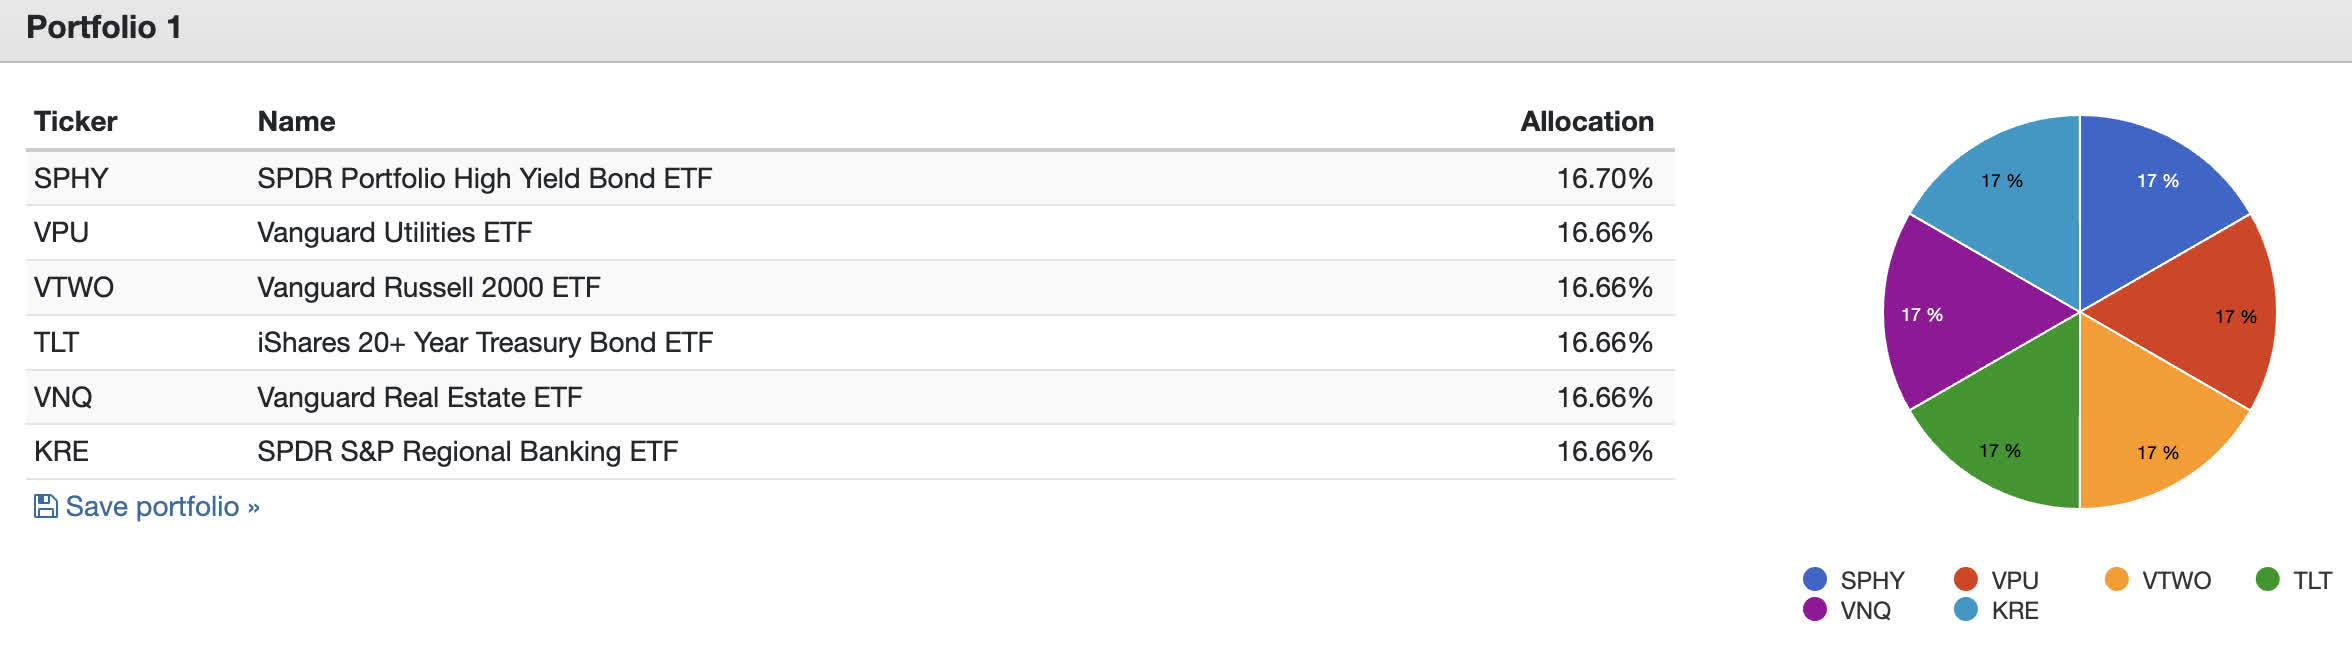
A model equal weighting of the six pics would be allocating about $1,670 to each individual ETF.
2023 versus the market
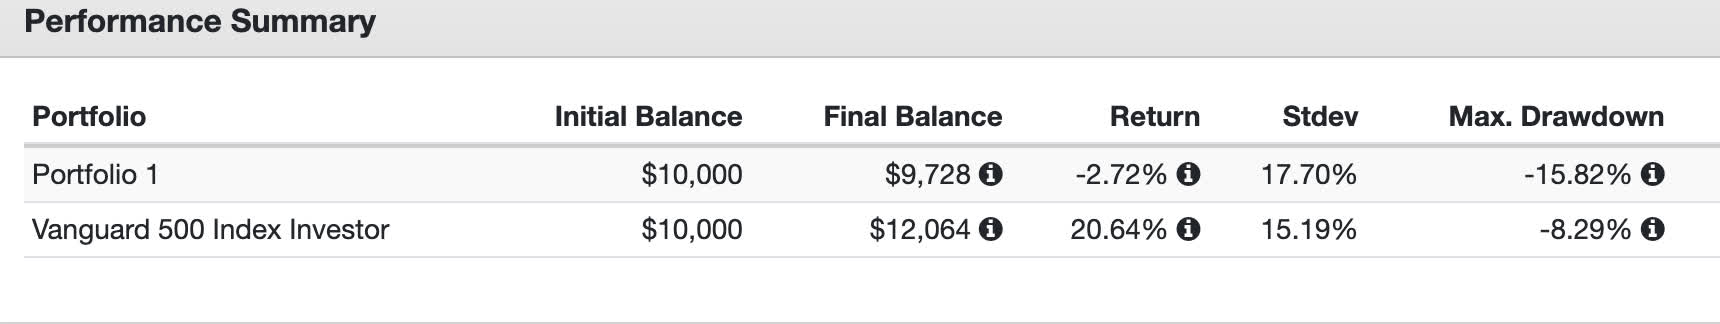
It was a great year for the S&P 500 ( SPY )( VOO ), backtesting this portfolio for 2023 resulted in a -2.72% return before 2023 year-end versus a 20.64% return for the index led by the Magnificent 7. As most of the ultra mega caps are well over a trillion in market capitalization at this time, many fund themes are finding market exposure excluding or limiting those 7 stocks. Don't get me wrong, I own a good amount of the 7 but am not looking for them to outperform the market again this coming year.
Risks
Everything in this portfolio is extremely sensitive to the probability of rate cuts happening. I am fairly convinced cuts will happen, but not 100%. Should rates stay relatively flat in 2024, the convexity of the bond slice should be mute. REITs may also be flat should that happen, although I believe we've hit a bottom in the sector outside of office REITs and MREITs.
The regional banking sector is the most sensitive to banking crises as capital outflows can force them to sell assets before maturity. If rate cuts happen, the values of those assets have less paper losses, if rates go up again, then this portfolio will surely underperform the market in that scenario.
Betting what didn't work, works in 2024
This is how I operate. I am a buy-and-hold investor who focuses on values within beaten-down sectors on an annual basis. Although more than half of my investments are held in broad-based index funds, mostly geared towards the S&P 500, the rest is invested in ideas of anti-bubble hatred on sale. This portfolio should satisfy the needs of any sector rotator looking to lower exposure to ultra-mega cap tech, lower their holding's overall P/E ratio, and take advantage of a rate cut catalyst environment in 2024.
| Fundamental | VTWO | Benchmark |
|---|---|---|
| Number of stocks | ||
| 1983 | ||
| 1967 | ||
| Median market cap | ||
| $2.6 B | ||
| $2.6 B | ||
| Earnings growth rate | ||
| 15.2% | ||
| 15.2% | ||
| Short-term reserves | ||
| - | ||
| - | ||
| P/E ratio | ||
| 13.3x | ||
| 13.3x | ||
| P/B ratio | ||
| 1.8x | ||
| 1.8x | ||
| Turnover rate (Fiscal Year-end 08/31/2023) | ||
| 14.7% | ||
| - | ||
| Return on equity | ||
| 7.9% | ||
| 7.9% |
For further details see:
6 ETFs For A High Yield Dividend Portfolio In 2024