AGNCM - 9% Dividend Yields Or Higher At Big Discounts
2023-05-17 17:59:47 ET
Summary
- Most of these picks are starting at dividend yields around 9%. A few are set to increase significantly.
- The company doesn't get to simply decide on a lower dividend rate. The floating rates are set by the market.
- The shares could be called, but that would be a huge capital gain. Hardly something to cry about.
- I'm including a few of our latest trades.
Get ready for charts, images, and tables because they are better than words. The ratings and outlooks we highlight here come after Scott Kennedy's weekly updates in the REIT Forum. Your continued feedback is greatly appreciated, so please leave a comment with suggestions.
We closed our position in AGNCP about two weeks ago so we could buy AGNCM, then we took the gains on AGNCM and redeployed. That redeployment included buying AGNCP again. We wrote 3 articles covering the trades:
Here's a quick timeline:
4/27/2023: AGNCP was cheaper than AGNCM. AGNCP was $20.28 and AGNCM was $21.66. That was a spread of $1.38. That favors AGNP.
5/2/2023: The situation changed. AGNCM was down much harder than AGNCP. We sold AGNCP at $19.912 (dipped $.368) to buy AGNCM at $20.382 (dipped $1.278). We were paying an extra $.47 per share to get AGNCM, but we figured it would rally better.
5/10/2023: We saw AGNCM outperform and we provided an update to tell investors it was playing out as expected.
5/15/2023: We sold our AGNCM at a weighted-average price of $21.2445. We used part of the proceeds to buy AGNCP at $19.95197. That's a spread of $1.29. Since we only paid a spread of $.47 per share, that was pretty good.
While AGNCP only rallied a few pennies, AGNCM delivered a total return of just over $4,761 on our 5,519 shares. If had stayed in AGNCP, we would've been up about $282.50 over the same period. Following the significant difference in performance, we're in AGNCP again.
AGNCP's dividend yield is only 7.76%, so it doesn't really fit the article title today. However, if the share price remains flat and we see no change in short-term interest rates (just theoretically), the yield would jump to about 12.6% two years from today. Of course, short-term rates may fall. However, they could fall quite a ways before this yield would become unattractive. Share prices might rise, but that's part of the point. Whose going to say the idea is bad because the share price might go up?
Now we're going to move on to the other two shares. We also bought some DX-C and RC-E. I think these are great deals today. DX-C is $21.25 and RC-E is $18.18. They fill different roles in the portfolio.
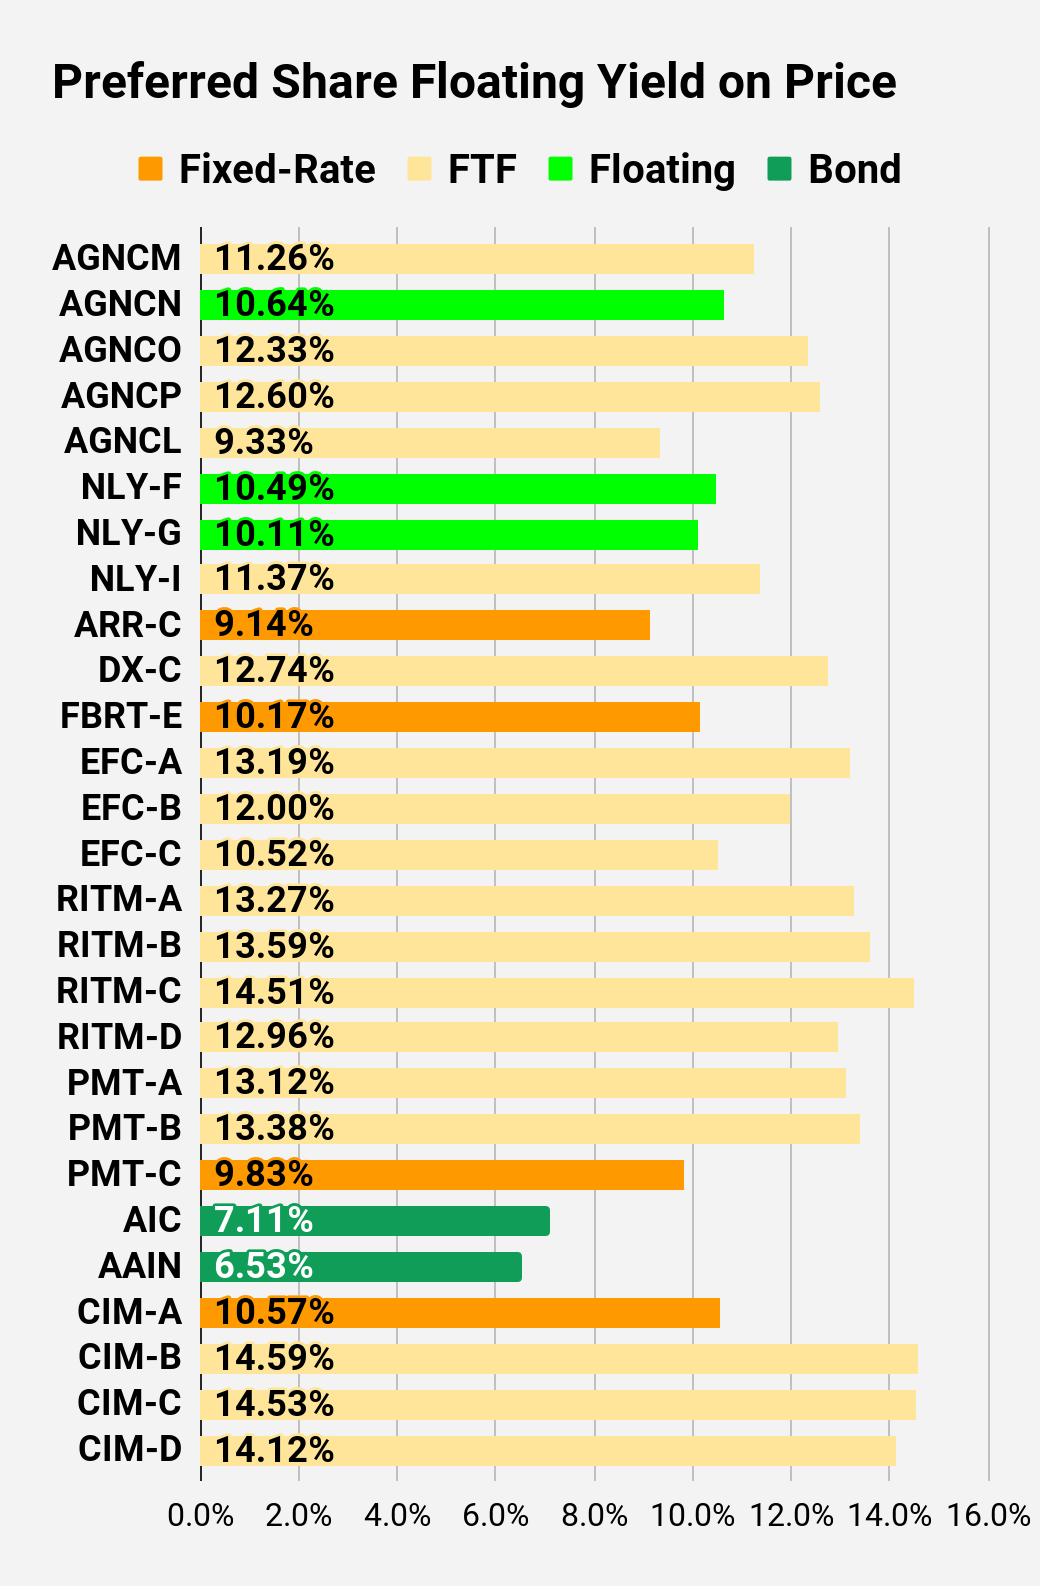
DX-C is another fixed-to-floating share. The floating rate doesn't kick in until 4/15/2025 (a year later than AGNCM), but the floating spread of 5.461% is quite a bit bigger than AGNCM's spread of 4.332%. As it happens, AGNCM had a pretty good day today also. Shares of AGNCM are about $.24 above DX-C right now. If DX-C were floating today, the yield would be 12.74%. That's outstanding for the risk level in those shares.
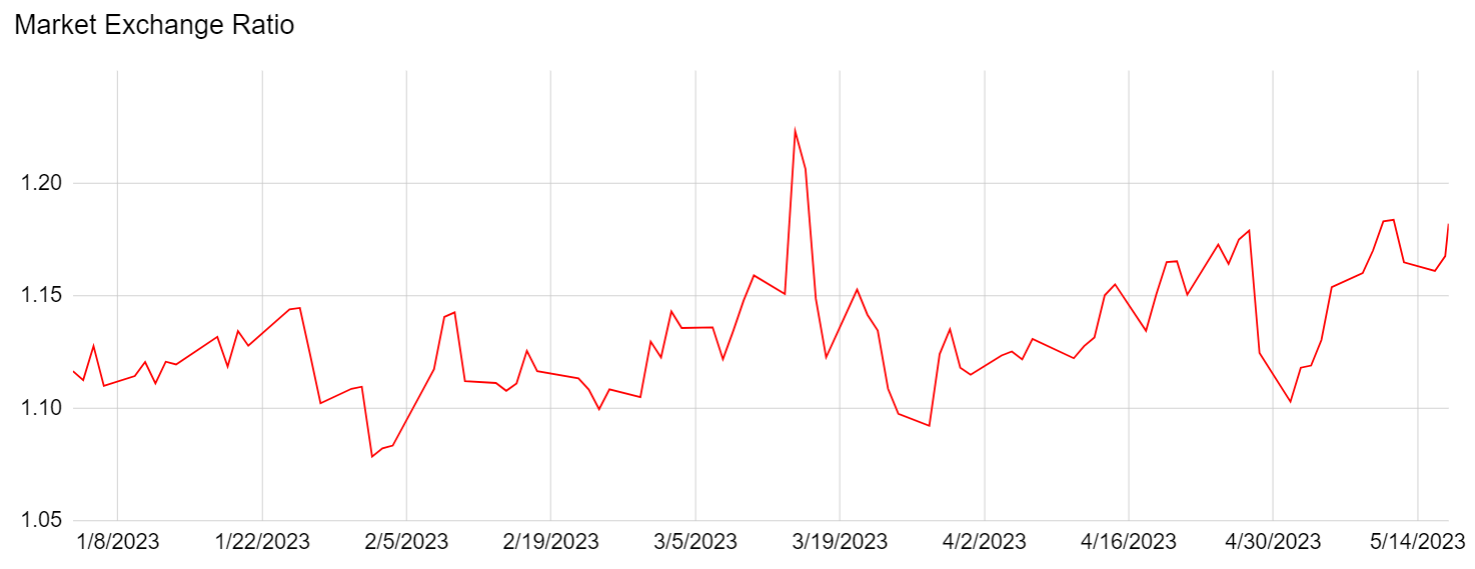
RC-E is a fixed-rate share. Have interest rates been rising rapidly? No, that's not it. Yet investors swapping from AGNCM to RC-E can get far more shares of RC-E today than they could previously.
Is it any wonder we picked AGNCM in early May and didn't pick RC-E? The exchange ratio dropped down to about 1.11. However, today it is back up to 1.18.
Would I rather have 1,110 shares of RC-E or 1,000 shares of AGNCM? I would give the edge to AGNCM.
Would I rather have 1,180 shares of RC-E or 1,000 shares of AGNCM? Well, in that case, I think RC-E is the better choice.
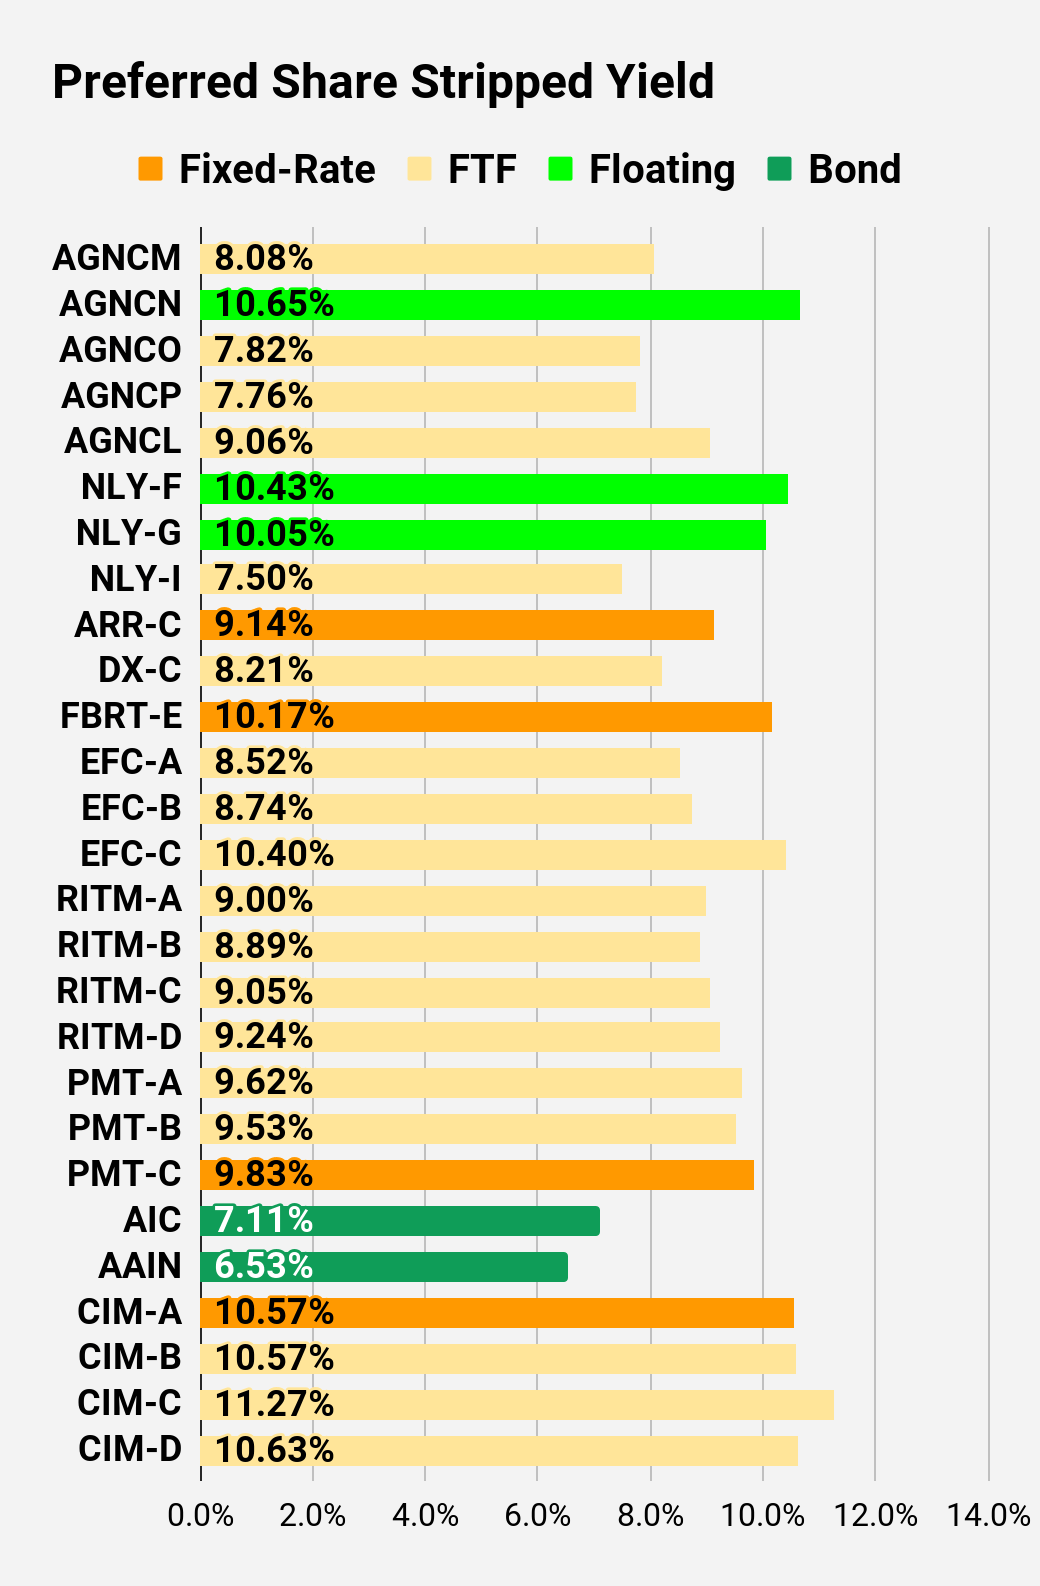
The fixed-rate dividend offers an attractive yield. The stripped yield is 9.05%. This provides some protection against rates declining. Lower rates are coming, it's simply a matter of when it happens. I think the Federal Reserve will hold rates longer than they should, but the argument for higher rates is crumbling. The goal is not to create deflation, contrary to a few of the comments. The goal is simply to bring inflation back down to about a 2% annualized rate. The main factor holding inflation above that level is the year-over-year comparisons and the use of lagged data for housing.
Consequently, I want a mix of fixed-to-floating and fixed-rate shares for my preferred share allocation.
Want a few more picks that are already around 9%? RITM-C and RITM-D are at 8.98% and 9.12% stripped yields, respectively. RITM-C is a fixed-to-floating share that would be yielding 14.39% if it were floating today. Shares begin floating 2/15/2025. RITM-D doesn't exactly float. Instead, it will reset the dividend rate based on the 5-year Treasury rate plus 6.223%. Currently, the 5-year Treasury rate is significantly lower than the 3-month rate. That's pretty unusual historically, but it distorts the comparison a bit. If RITM-D reset today, the stripped yield would jump to 12.79%. That would be a huge increase. However, RITM-D's reset date doesn't actually hit until 11/15/2026.
Since RITM-D's spread is set at 6.223% and the initial coupon rate was 7.00%, the reset will result in a higher dividend so long as the 5-year Treasury rate is greater than 0.78%. If the 5-year Treasury yield is below 0.78%, there probably won't be all too many opportunities for yield.
I'll toss in one more idea. We also bought EFC-A recently. At $20.03, I think that's a good deal. The yield is only about 8.5% today, but the floating rate begins 10/30/2024. At current prices and interest rates, the stripped yield would be 13.19%. That's another good idea.
If you had a hard time keeping track of any of those yields, the preferred share tables later in the article should handle it for you.
A Few Closing Notes
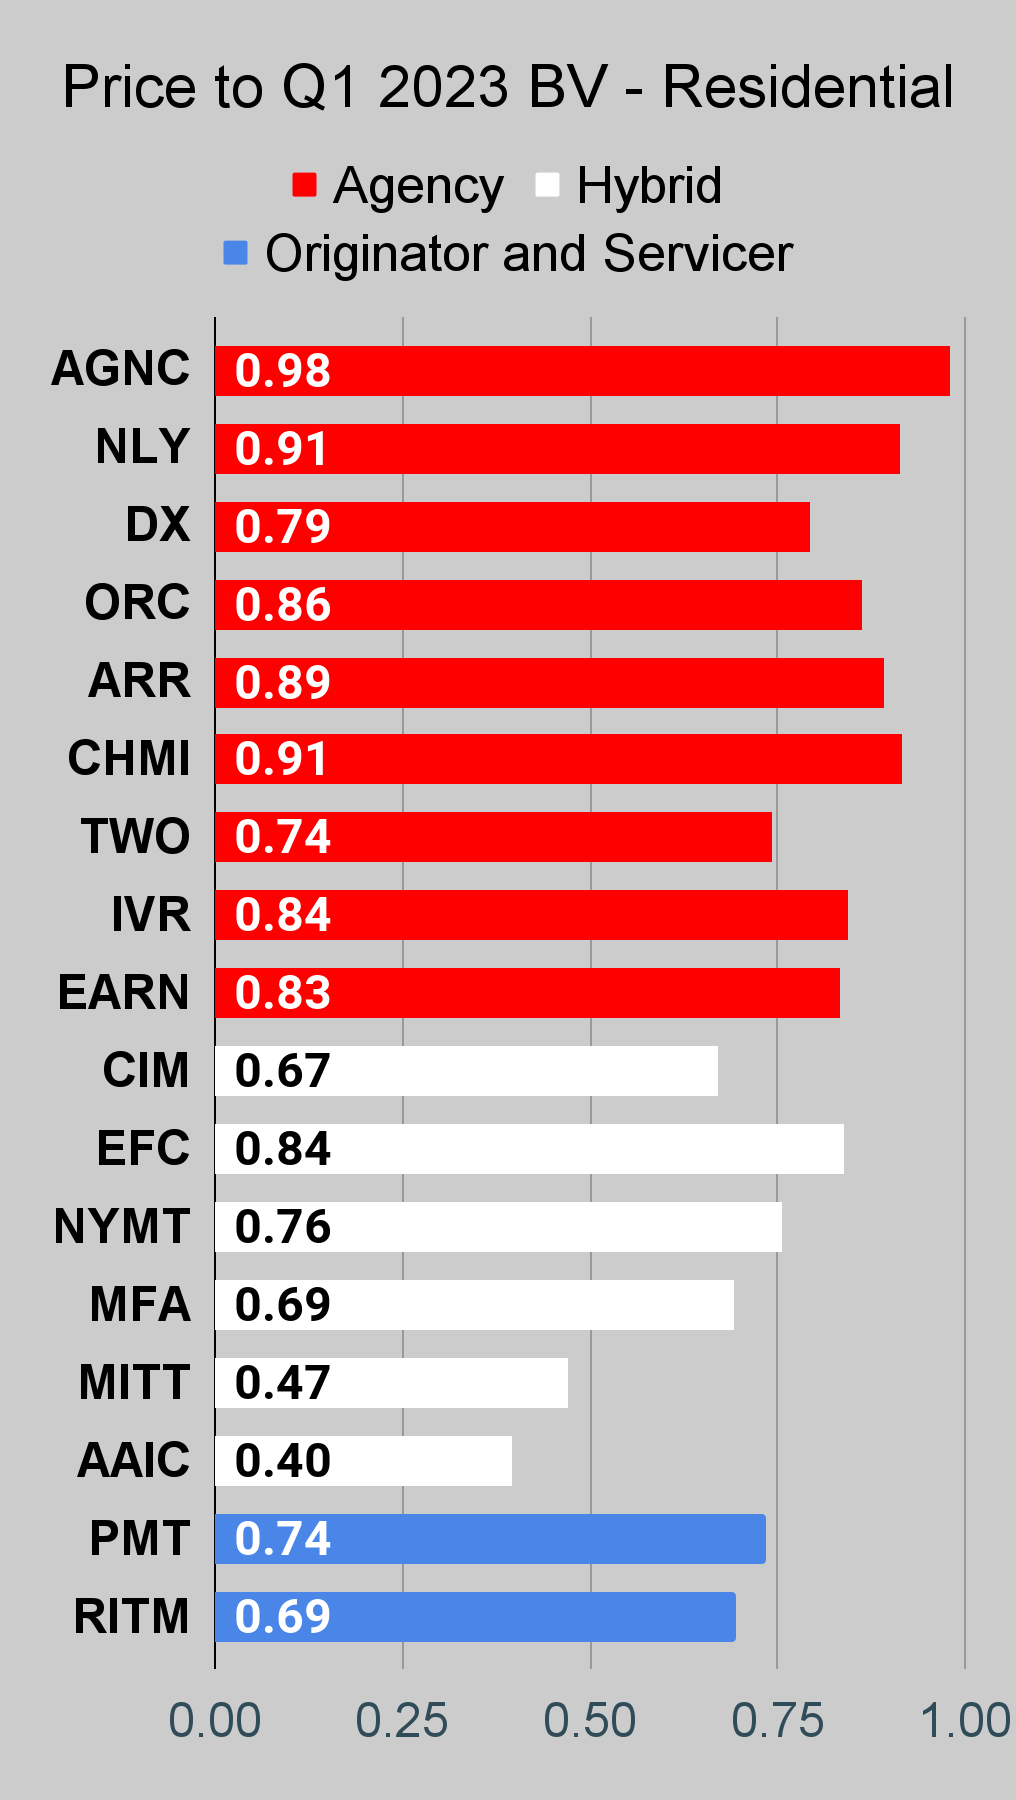
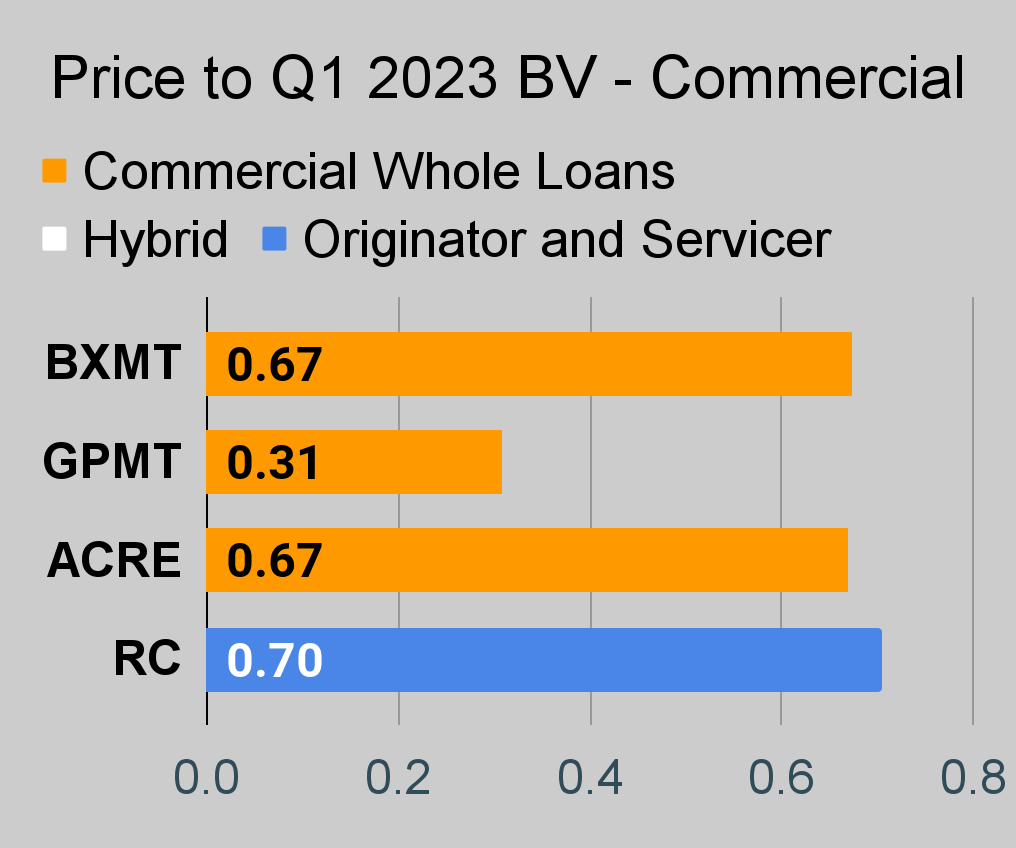
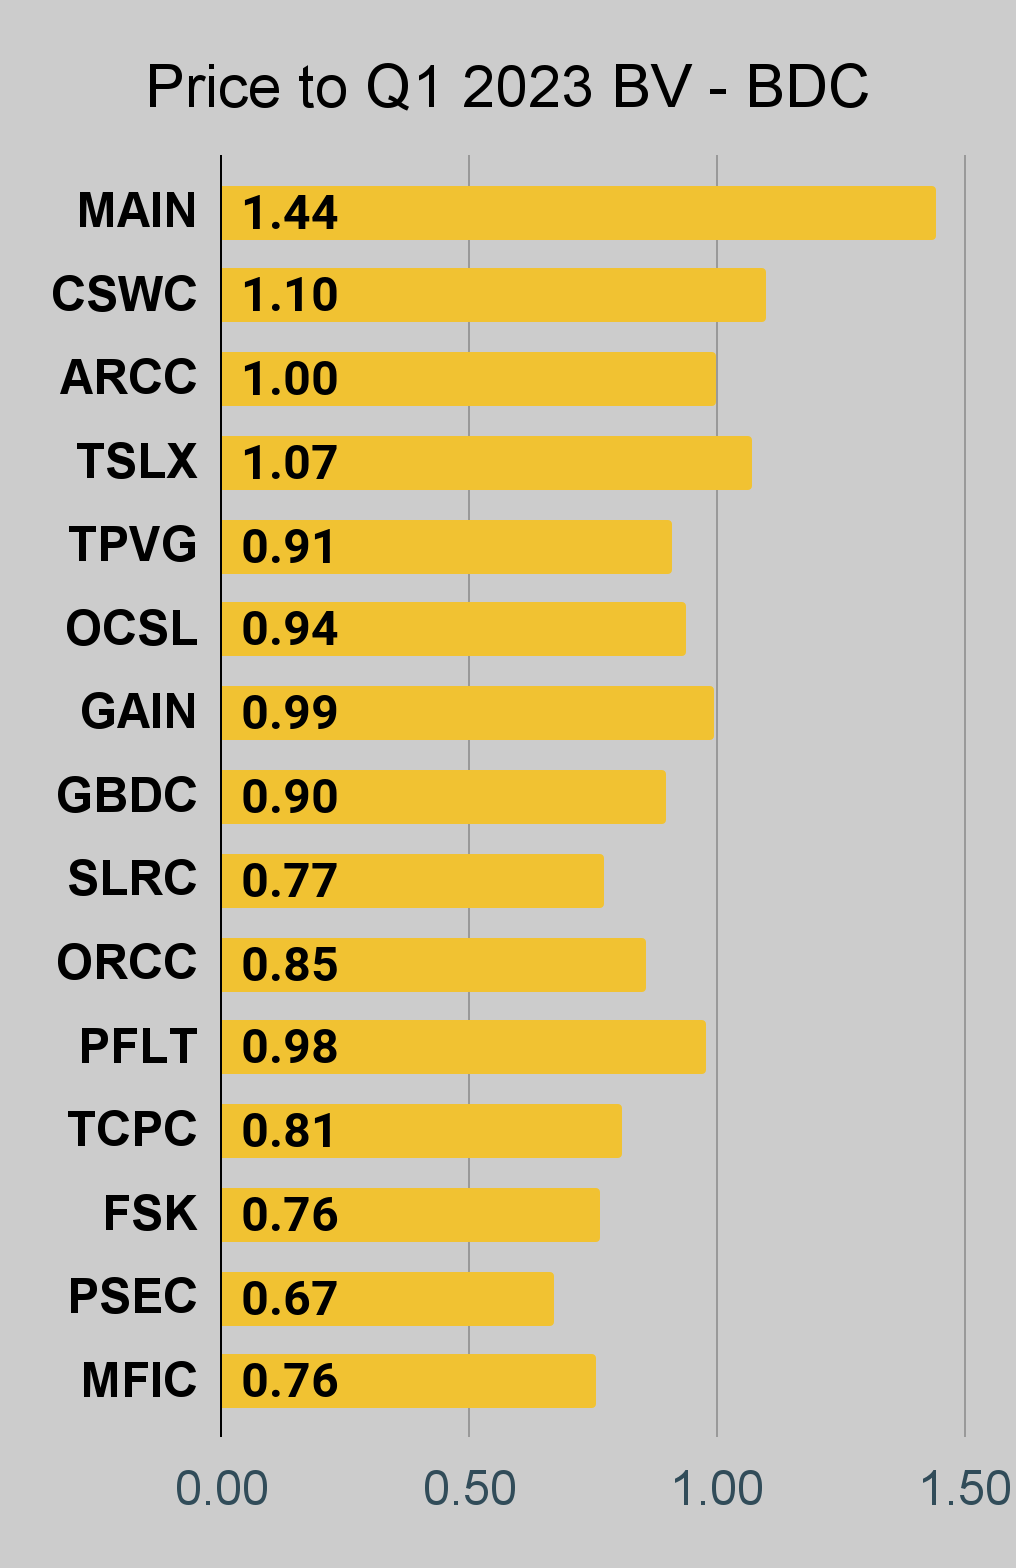
The charts for book values have been updated to use Q1 2023 book values for discounts.
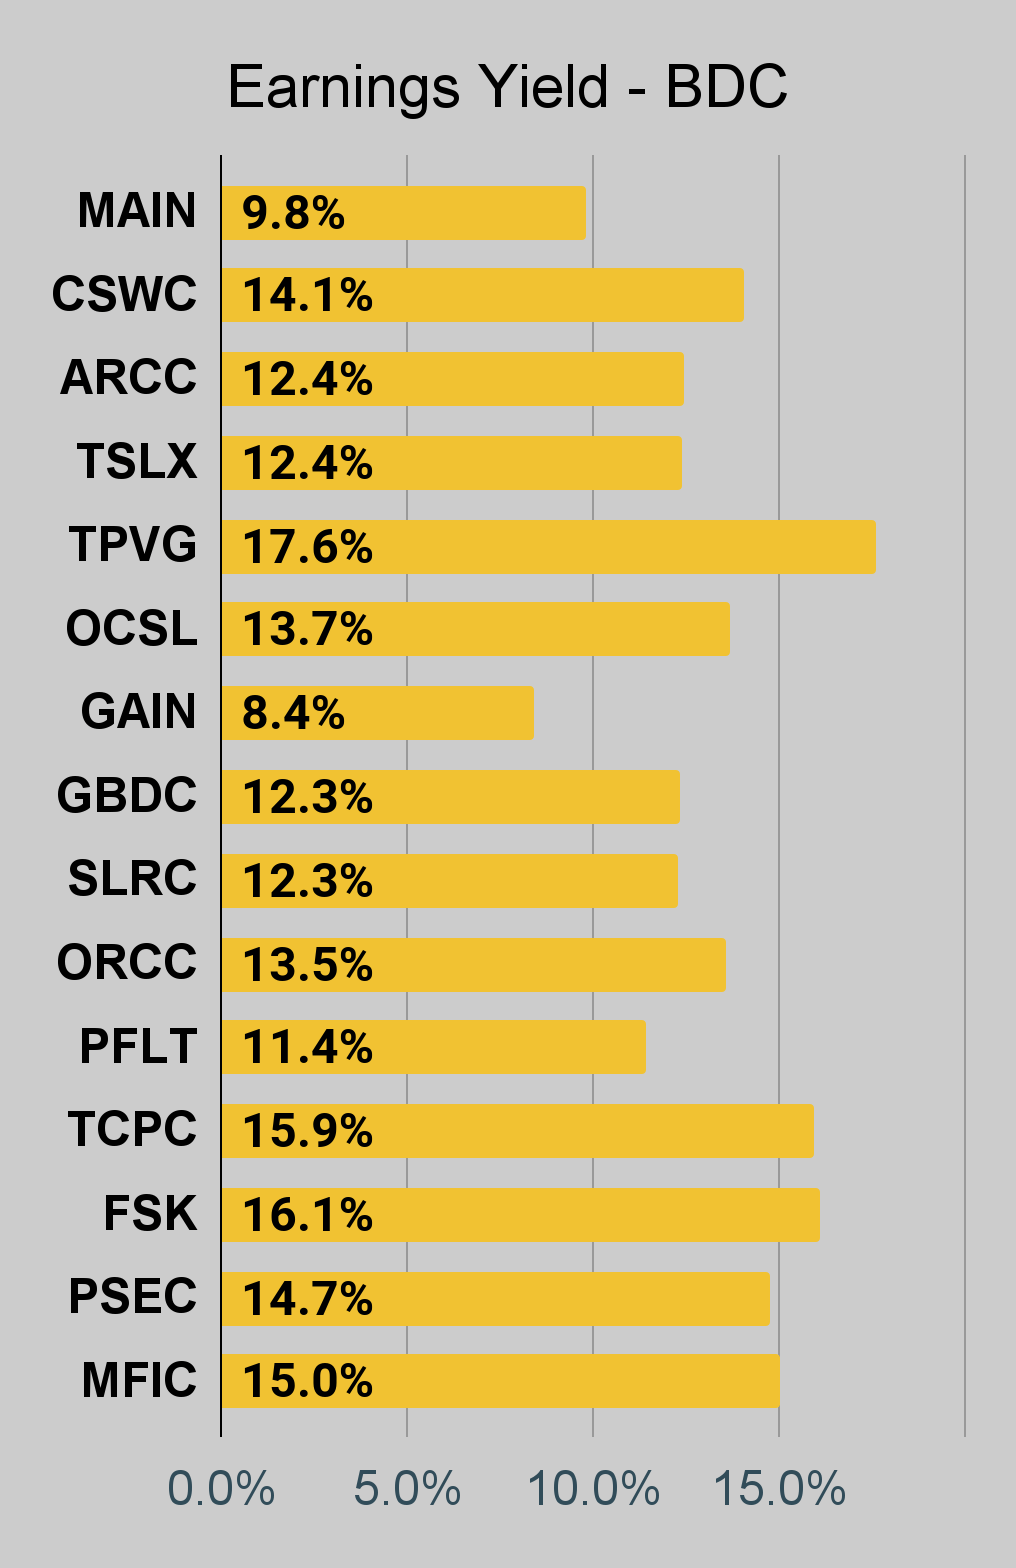
ORC's "Earnings Yield" suddenly disappeared as the consensus analyst estimates disappeared. The Q1 2023 earnings for ORC were pretty wild and some analysts who are bad at creating estimates for earnings may have been exposed.
There might be one guy who wants to claim that we didn't really catch the dip on AGNCM for 5,581 shares. I won't even blame that guy. People should always be skeptical. Especially when they see someone writing:
"I'm really good at money guys. Look at my smart trades. You should follow my brilliant ideas! Guys!"
You see that, even if it looks really professional, and you should request the evidence. If they are real, they should have the evidence ready for you. So here is the execution from our trades going into AGNCM on 05/02/2023 (also includes purchases of EFC-A):
Charles Schwab Charles Schwab Charles Schwab Charles Schwab Fidelity
Thanks for reading.
Stock Table
We will close out the rest of the article with the tables and charts we provide for readers to help them track the sector for both common shares and preferred shares.
We're including a quick table for the common shares that will be shown in our tables:
| Type of REIT or BDC |
| Residential Agency |
| Residential Hybrid |
| Residential Originator and Servicer |
| Commercial |
| BDC |
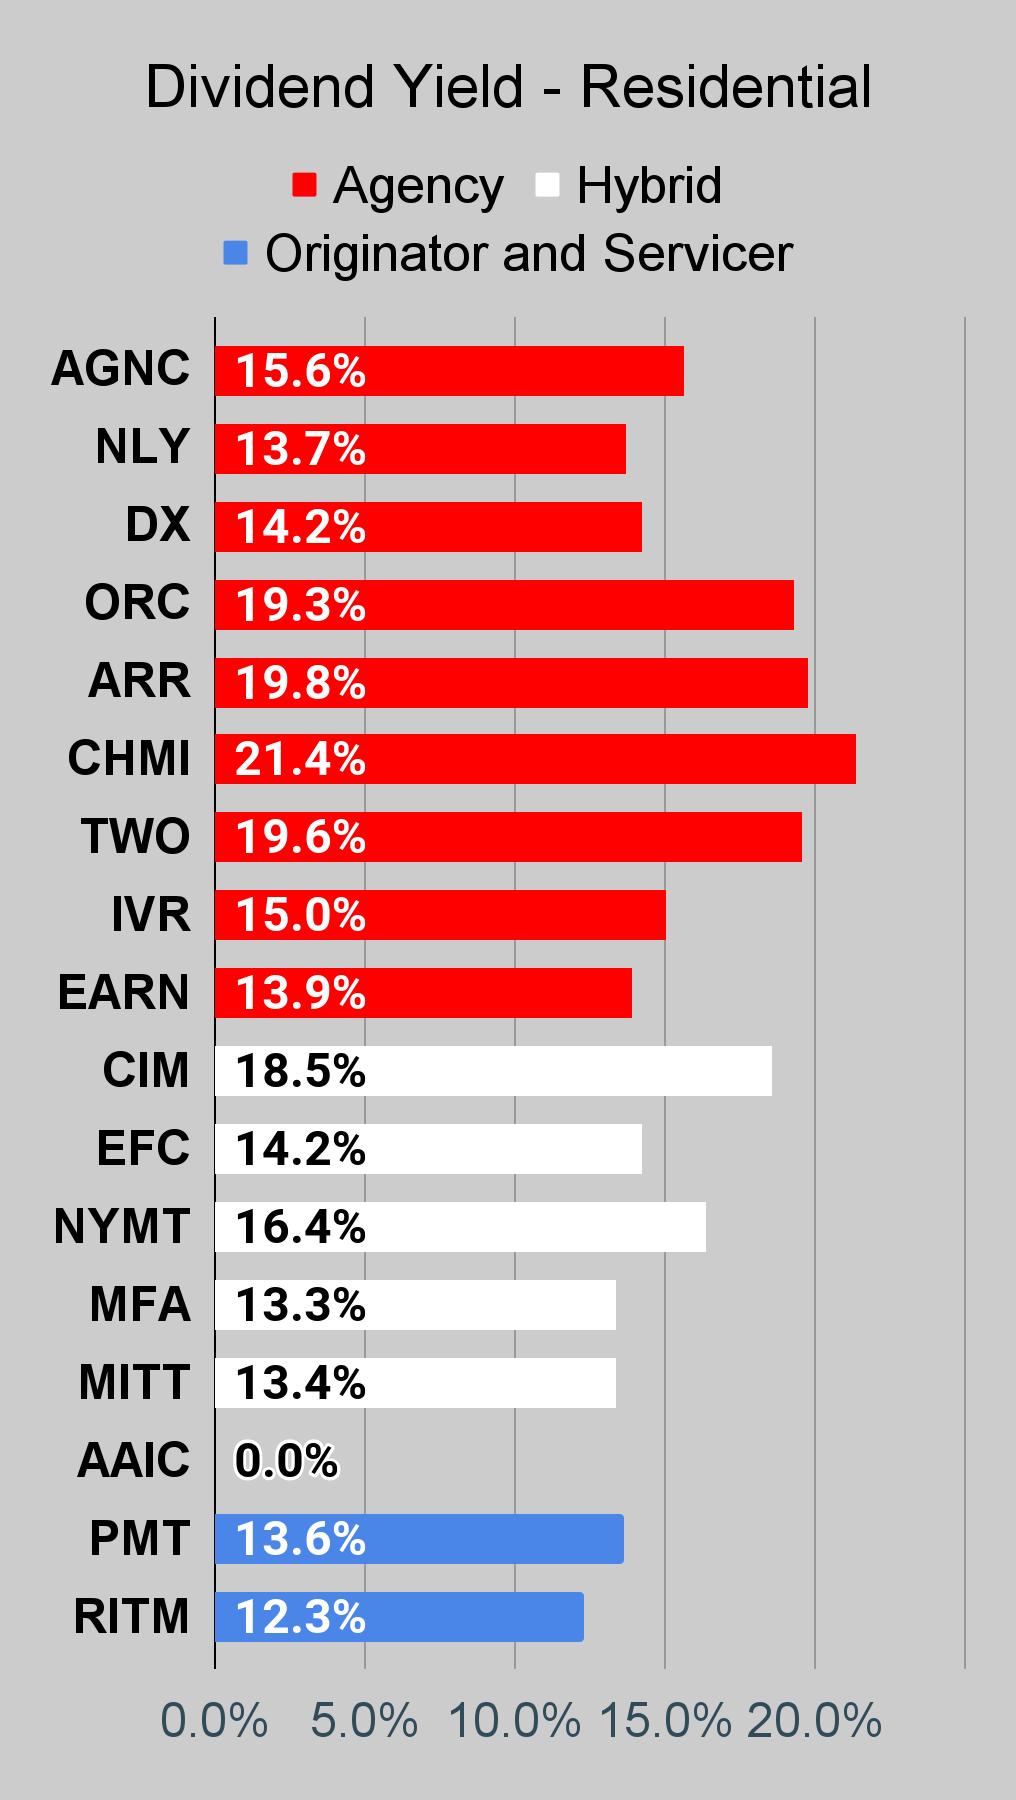
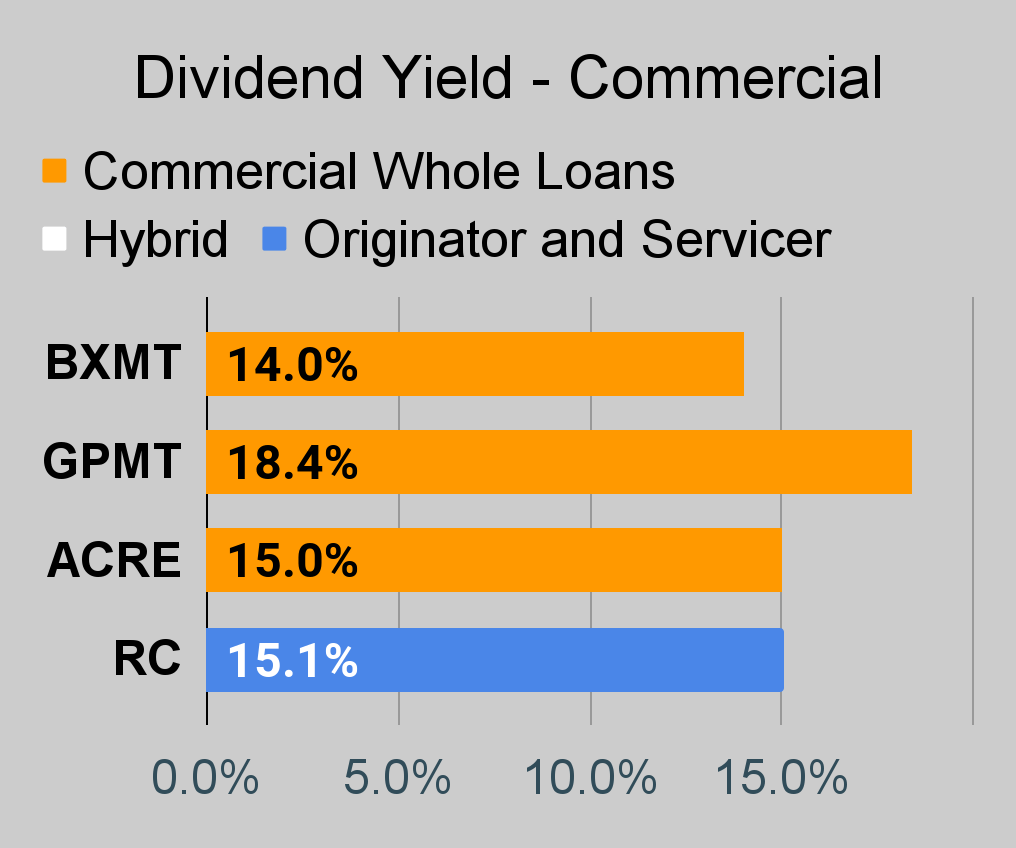
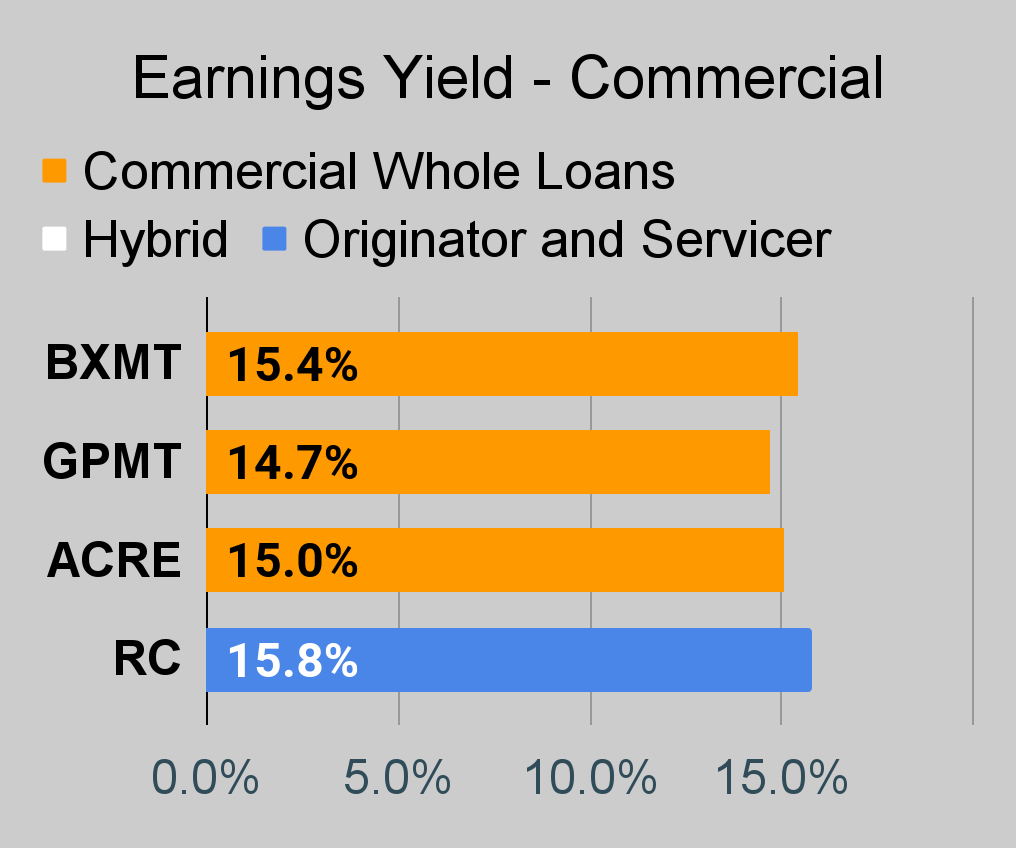
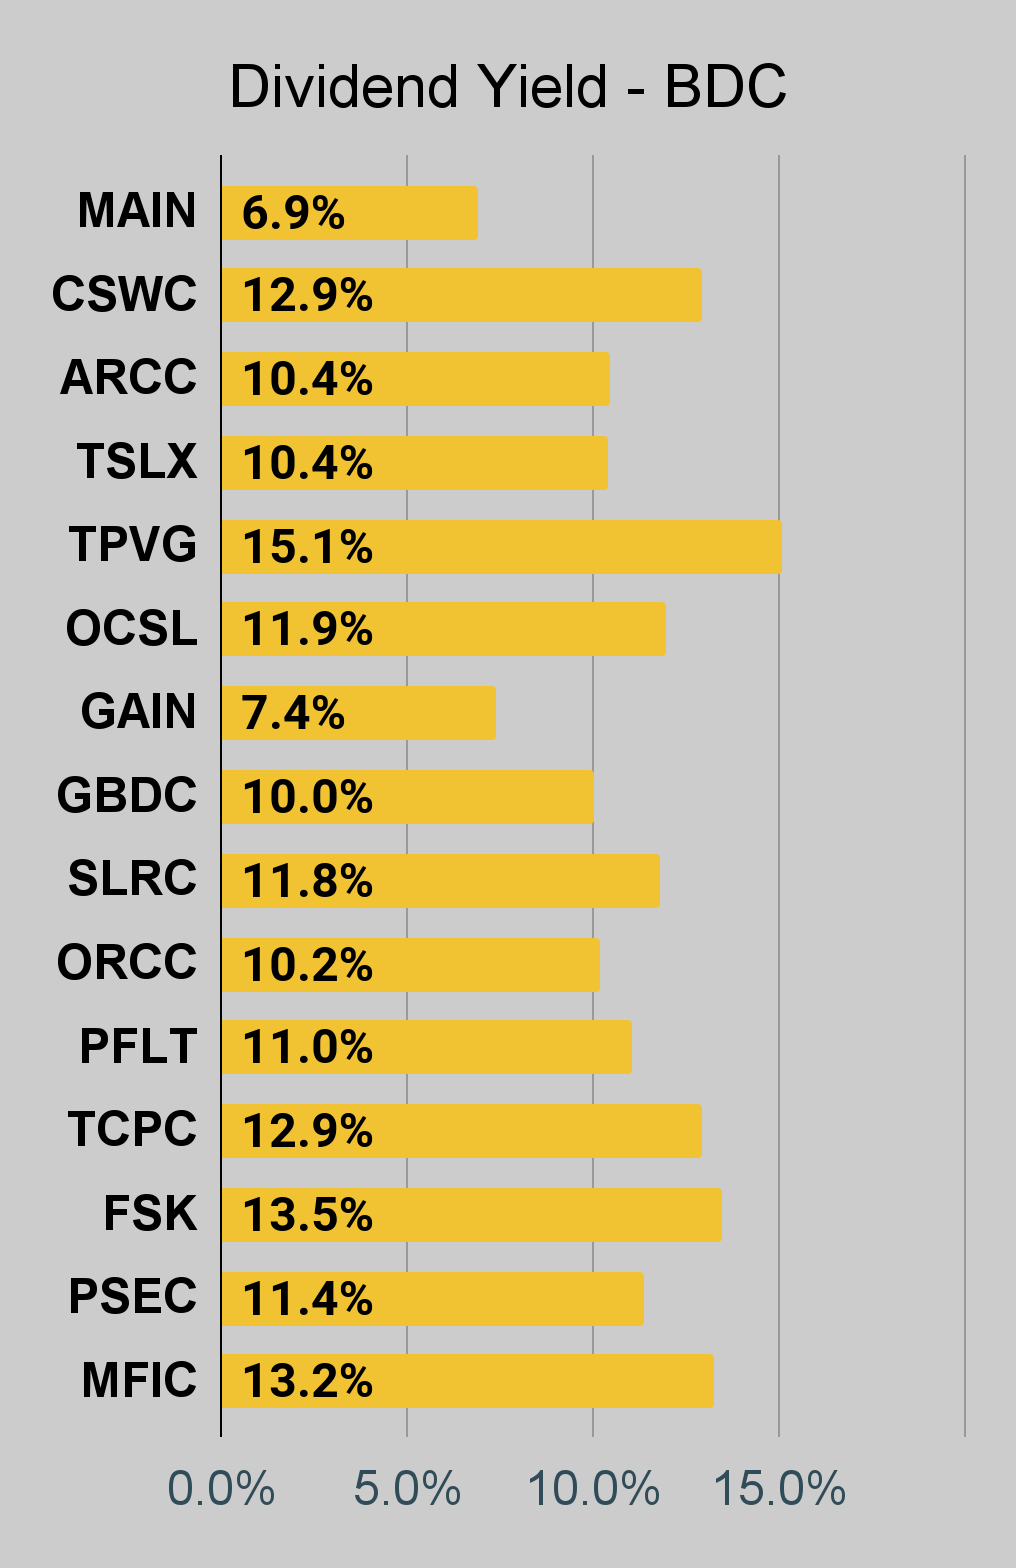
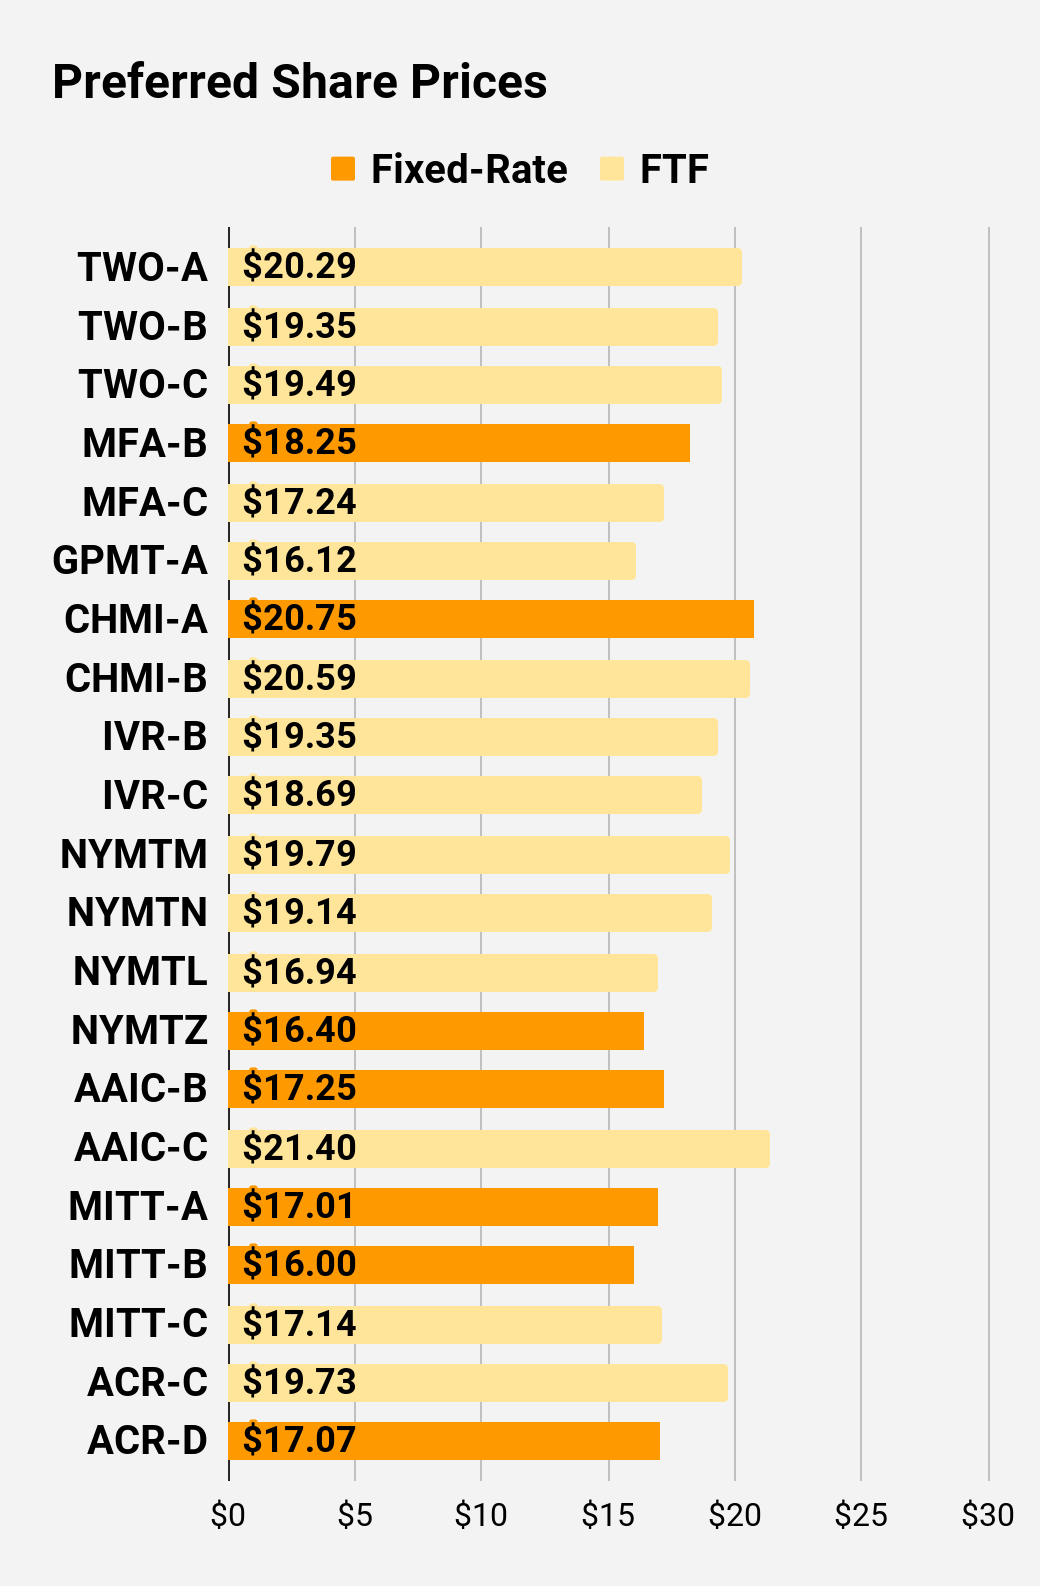
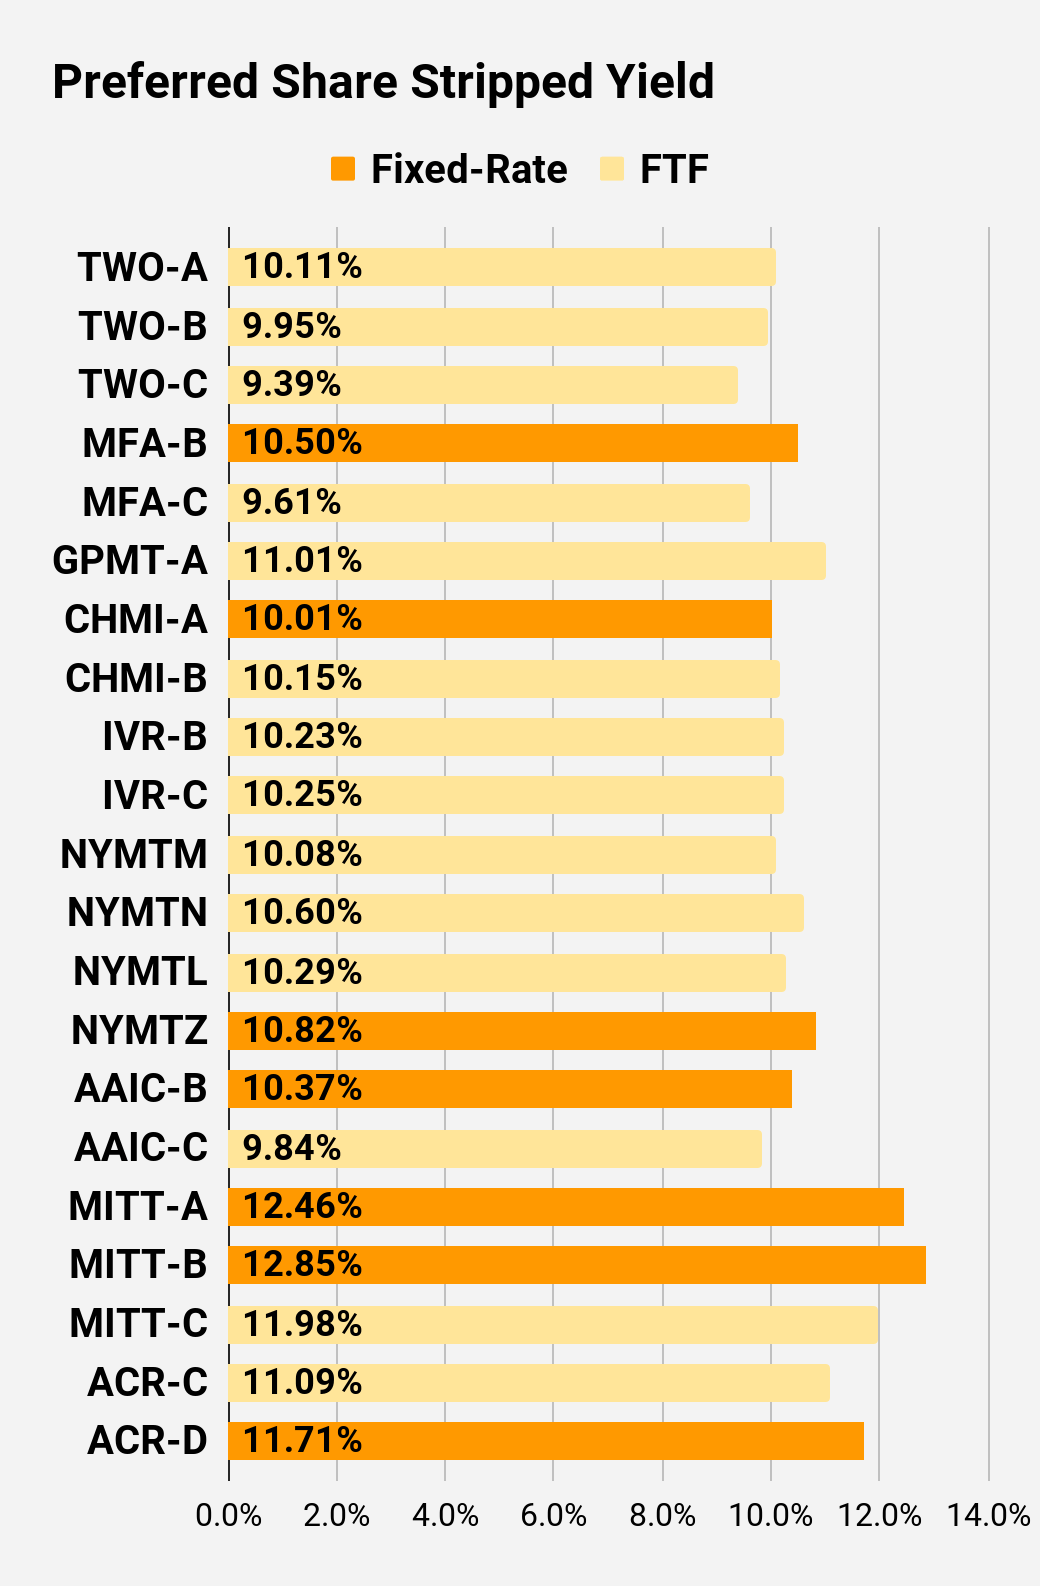
If you're looking for a stock and I haven't mentioned it yet, you'll still find it in the charts below. The charts contain comparisons based on price-to-book value, dividend yields, and earnings yield. You won't find these tables anywhere else.
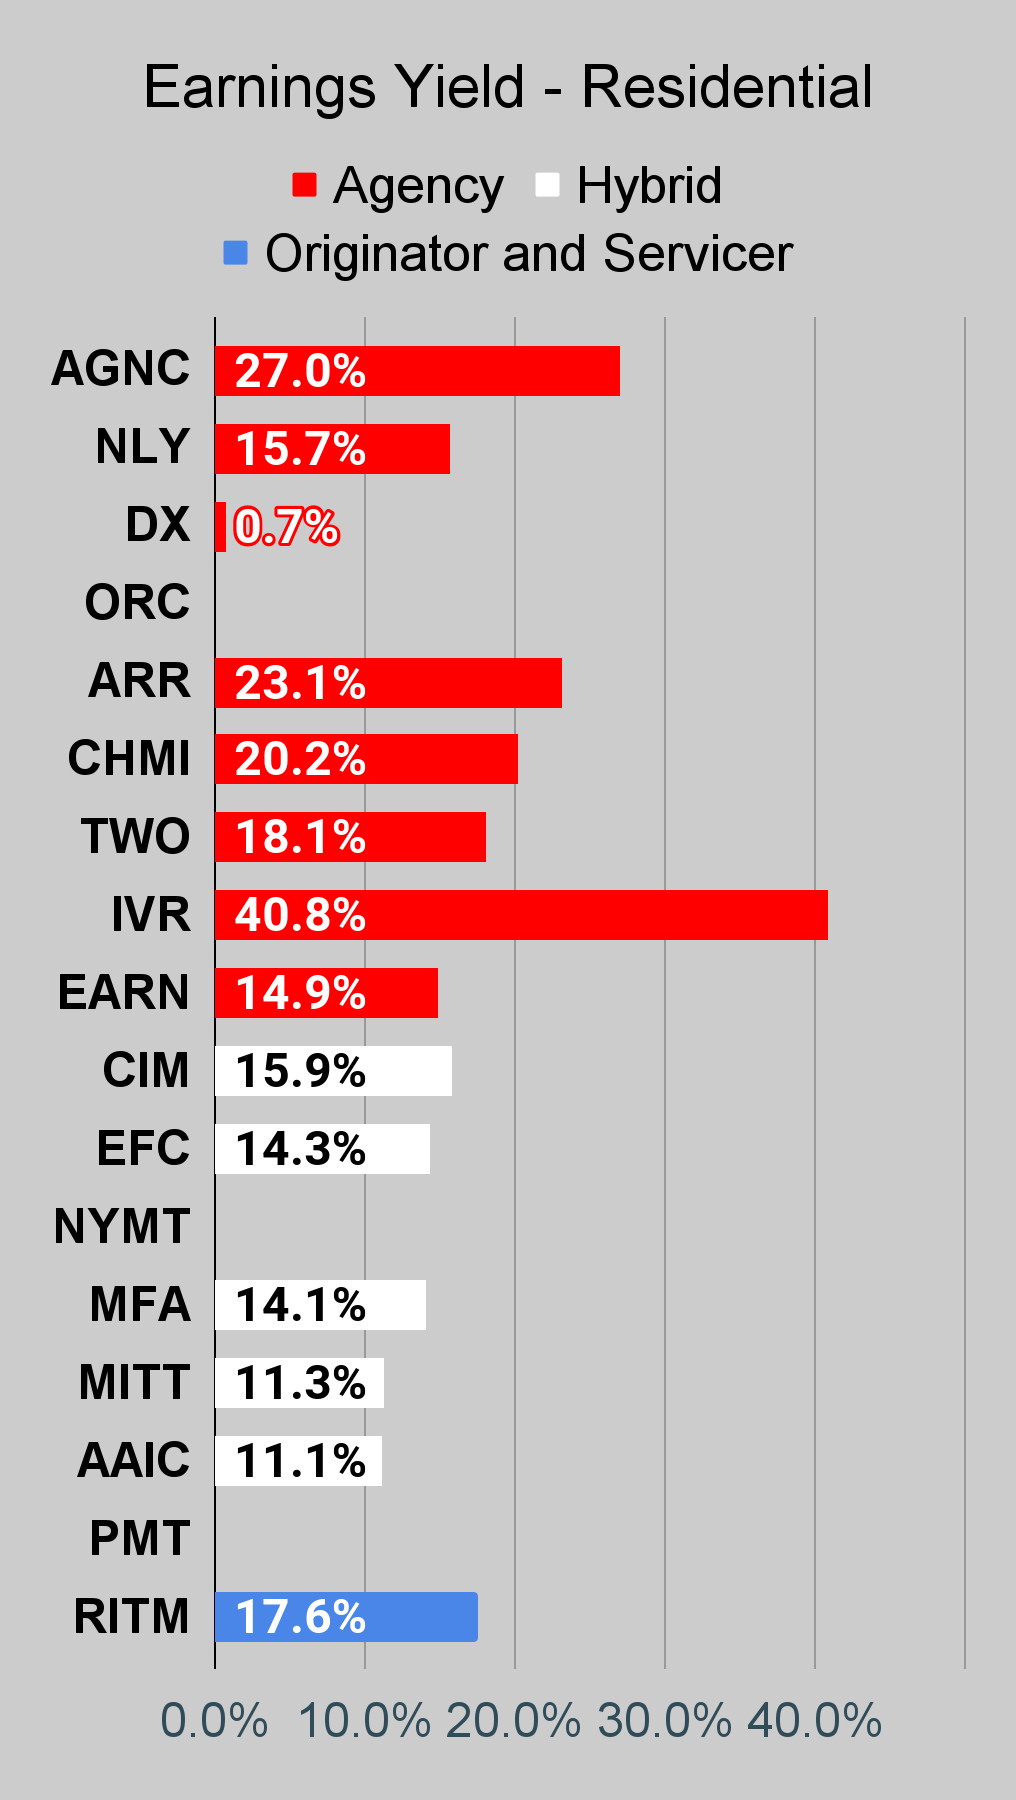
For mortgage REITs, please look at the charts for AGNC, NLY, DX, ORC, ARR, CHMI, TWO, IVR, EARN, CIM, EFC, NYMT, MFA, MITT, AAIC, PMT, RITM, BXMT, GPMT, WMC, and RC.
For BDCs, please look at the charts for MAIN, CSWC, ARCC, TSLX, TPVG, OCSL, GAIN, GBDC, SLRC, ORCC, PFLT, TCPC, FSK, PSEC, and MFIC.
This series is the easiest place to find charts providing up-to-date comparisons across the sector.
Residential Mortgage REIT Charts
Note: The chart for our public articles uses the book value per share from the latest earnings release. Current estimated book value per share is used in reaching our targets and trading decisions. It is available in our service, but those estimates are not included in the charts below. PMT and NYMT are not showing an earnings yield metric as neither REIT provides a quarterly "Core EPS" metric.
Second Note: Due to the way historical amortized cost and hedging are factored into the earnings metrics, it's possible for two mortgage REITs with similar portfolios to post materially different metrics for earnings. I would be very cautious about putting much emphasis on the consensus analyst estimate (which is used to determine the earnings yield). In particular, throughout late 2022 the earnings metric became less comparable for many REITs.
Commercial Mortgage REIT Charts
BDC Charts
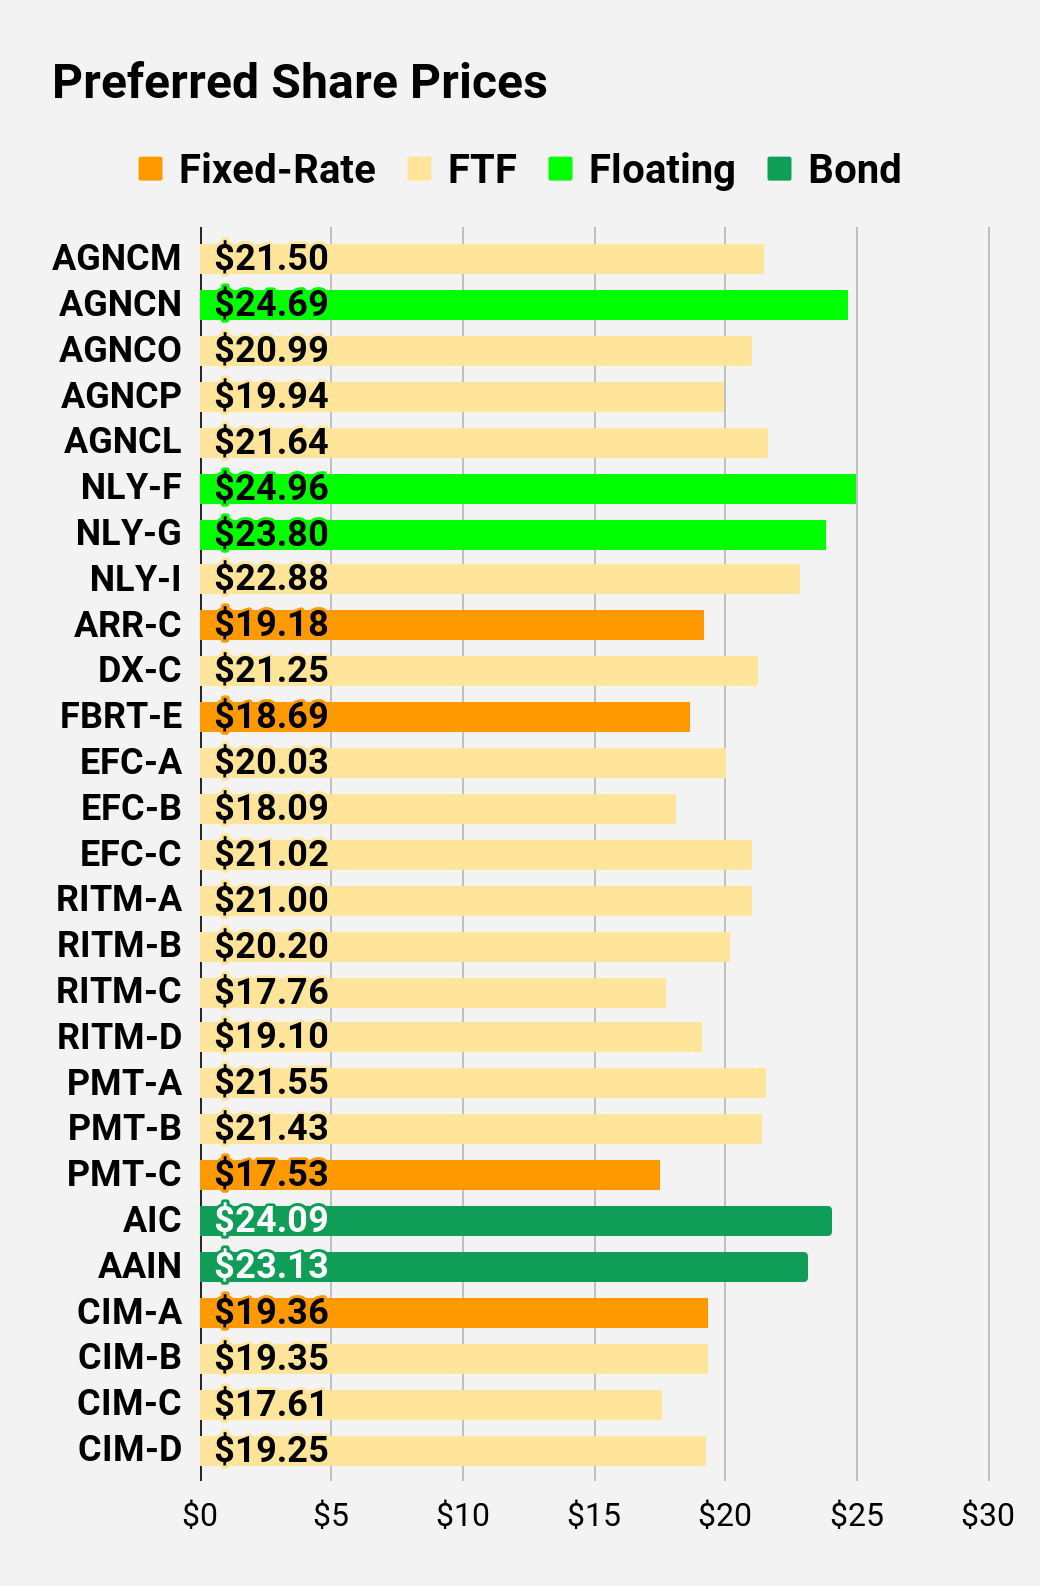
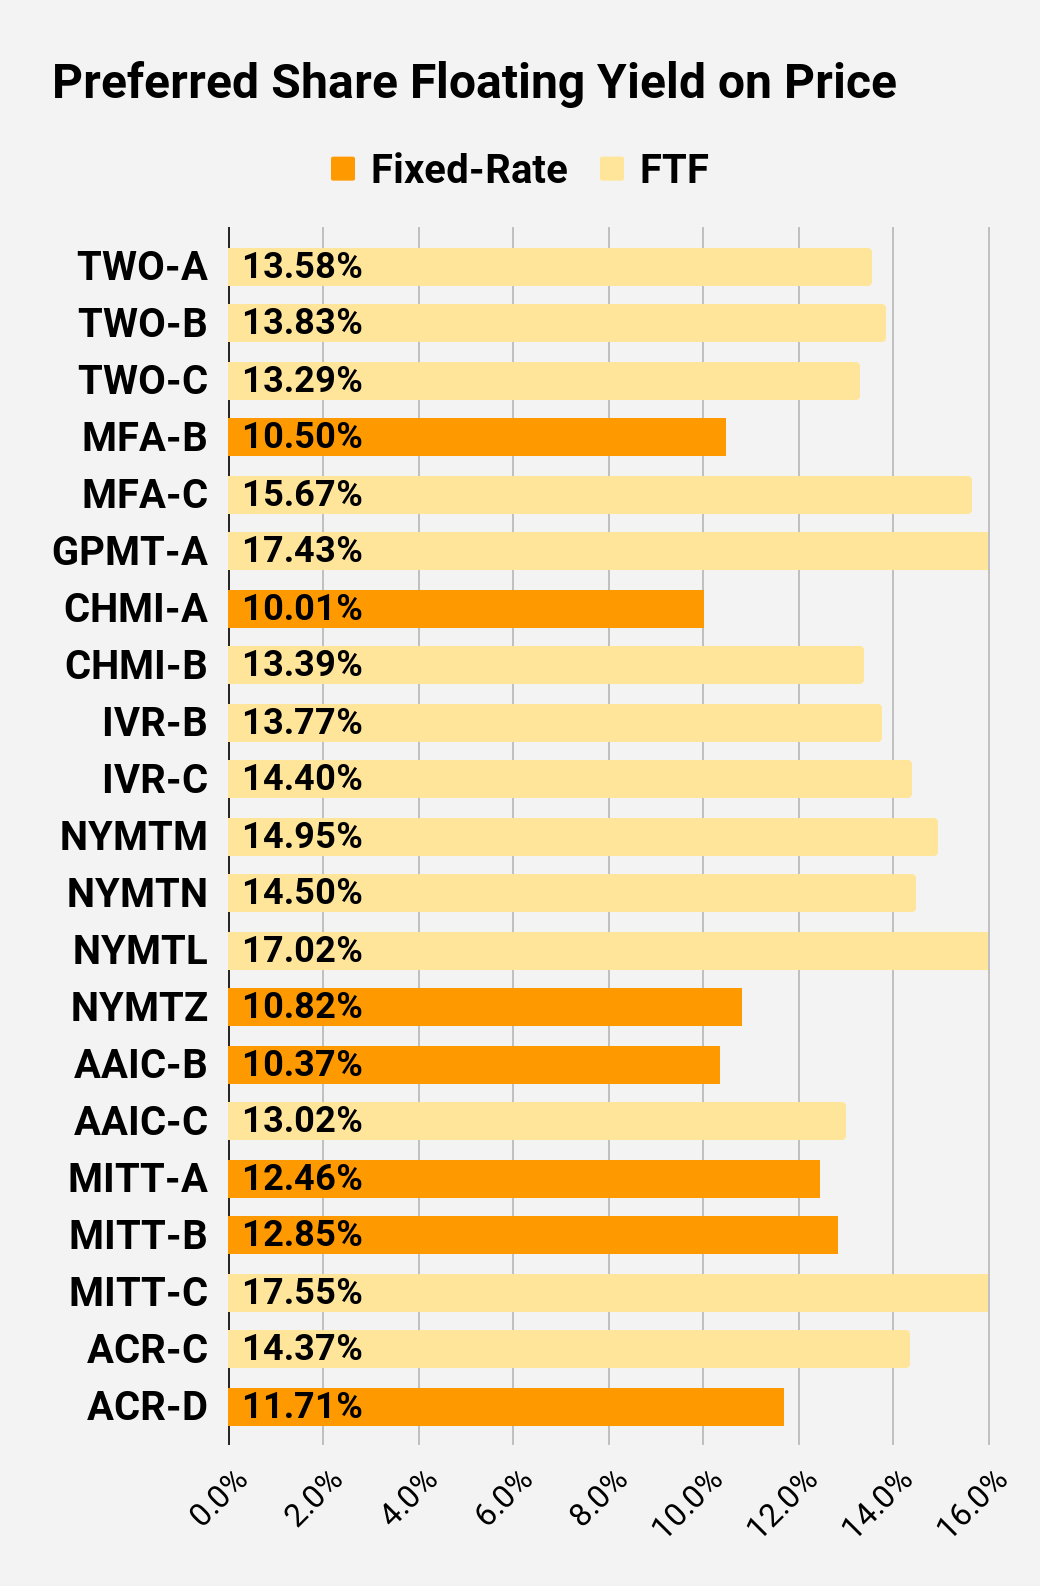
Preferred Share Charts
I changed the coloring a bit. We needed to adjust to include that the first fixed-to-floating shares have transitioned over to floating rates. When a share is already floating, the stripped yield may be different from the "Floating Yield on Price" due to changes in interest rates. For instance, NLY-F already has a floating rate. However, the rate is only reset once per three months. The stripped yield is calculated using the upcoming projected dividend payment and the "Floating Yield on Price" is based on where the dividend would be if the rate reset today. In my opinion, for these shares the "Floating Yield on Price" is clearly the more important metric.
Preferred Share Data
Beyond the charts, we're also providing our readers with access to several other metrics for the preferred shares.
After testing out a series on preferred shares, we decided to try merging it into the series on common shares. After all, we're still talking about positions in mortgage REITs. We don't have any desire to cover preferred shares without cumulative dividends, so any preferred shares you see in our column will have cumulative dividends. You can verify that by using Quantum Online. We've included the links in the table below.
To better organize the table, we needed to abbreviate column names as follows:
- Price = Recent Share Price - Shown in Charts.
- BoF = Bond or FTF (Fixed-to-Floating).
- S-Yield = Stripped Yield - Shown in Charts.
- Coupon = Initial Fixed-Rate Coupon.
- FYoP = Floating Yield on Price - Shown in Charts.
- NCD = Next Call Date (the soonest shares could be called).
- Note: For all FTF issues, the floating rate would start on NCD.
- WCC = Worst Cash to Call (lowest net cash return possible from a call).
- QO Link = Link to Quantum Online Page.
| Ticker |
| Price |
| BoF |
| S-Yield |
| Coupon |
| FYoP |
| NCD |
| WCC |
| QO Link |
| P-Link |
| $21.50 |
| FTF |
| 8.08% |
| 6.88% |
| 11.26% |
| 4/15/2024 |
| $5.23 |
| $24.69 |
| Floating |
| 10.65% |
| 10.37% |
| 10.64% |
| 6/16/2023 |
| $0.76 |
| $20.99 |
| FTF |
| 7.82% |
| 6.50% |
| 12.33% |
| 10/15/2024 |
| $6.46 |
| $19.94 |
| FTF |
| 7.76% |
| 6.13% |
| 12.60% |
| 4/15/2025 |
| $8.13 |
| $21.64 |
| FTF |
| 9.06% |
| 7.75% |
| 9.33% |
| 10/15/2027 |
| $12.09 |
| $24.96 |
| Floating |
| 10.43% |
| 10.18% |
| 10.49% |
| 6/16/2023 |
| $0.59 |
| $23.80 |
| Floating |
| 10.05% |
| 9.36% |
| 10.11% |
| 6/16/2023 |
| $1.70 |
| $22.88 |
| FTF |
| 7.50% |
| 6.75% |
| 11.37% |
| 6/30/2024 |
| $4.24 |
| $19.18 |
| 9.14% |
| 7.00% |
| 9.14% |
| 1/28/2025 |
| $8.75 |
| $21.25 |
| FTF |
| 8.21% |
| 6.90% |
| 12.74% |
| 4/15/2025 |
| $7.20 |
| $18.69 |
| 10.17% |
| 7.50% |
| 10.17% |
| 6/16/2023 |
| $6.63 |
| $20.03 |
| FTF |
| 8.52% |
| 6.75% |
| 13.19% |
| 10/30/2024 |
| $7.51 |
| $18.09 |
| FTF |
| 8.74% |
| 6.25% |
| 12.00% |
| 1/30/2027 |
| $12.78 |
| $21.02 |
| FTF |
| 10.40% |
| 8.63% |
| 10.52% |
| 4/30/2028 |
| $14.78 |
| $21.00 |
| FTF |
| 9.00% |
| 7.50% |
| 13.27% |
| 8/15/2024 |
| $6.36 |
| $20.20 |
| FTF |
| 8.89% |
| 7.13% |
| 13.59% |
| 8/15/2024 |
| $7.05 |
| $17.76 |
| FTF |
| 9.05% |
| 6.38% |
| 14.51% |
| 2/15/2025 |
| $10.05 |
| $19.10 |
| FTF |
| 9.24% |
| 7.00% |
| 12.96% |
| 11/15/2026 |
| $12.05 |
| $21.55 |
| FTF |
| 9.62% |
| 8.13% |
| 13.12% |
| 3/15/2024 |
| $5.49 |
| $21.43 |
| FTF |
| 9.53% |
| 8.00% |
| 13.38% |
| 6/15/2024 |
| $6.08 |
| $17.53 |
| 9.83% |
| 6.75% |
| 9.83% |
| 8/24/2026 |
| $13.29 |
| $24.09 |
| Bond |
| 7.11% |
| 6.75% |
| 7.11% |
| 6/16/2023 |
| $1.33 |
| $23.13 |
| Bond |
| 6.53% |
| 6.00% |
| 6.53% |
| 8/1/2023 |
| $2.24 |
| $19.36 |
| 10.57% |
| 8.00% |
| 10.57% |
| 6/16/2023 |
| $6.15 |
| $19.35 |
| FTF |
| 10.57% |
| 8.00% |
| 14.59% |
| 3/30/2024 |
| $7.74 |
| $17.61 |
| FTF |
| 11.27% |
| 7.75% |
| 14.53% |
| 9/30/2025 |
| $12.33 |
| $19.25 |
| FTF |
| 10.63% |
| 8.00% |
| 14.12% |
| 03/30/2024 |
| $7.84 |
Second Batch:
| Ticker |
| Price |
| BoF |
| S-Yield |
| Coupon |
| FYoP |
| NCD |
| WCC |
| QO Link |
| P-Link |
| $20.29 |
| FTF |
| 10.11% |
| 8.13% |
| 13.58% |
| 04/27/2027 |
| $12.84 |
| $19.35 |
| FTF |
| 9.95% |
| 7.63% |
| 13.83% |
| 07/27/2027 |
| $13.75 |
| $19.49 |
| FTF |
| 9.39% |
| 7.25% |
| 13.29% |
| 1/27/2025 |
| $8.69 |
| $18.25 |
| 10.50% |
| 7.50% |
| 10.50% |
| 6/16/2023 |
| $7.15 |
| $17.24 |
| FTF |
| 9.61% |
| 6.50% |
| 15.67% |
| 3/31/2025 |
| $11.02 |
| $16.12 |
| FTF |
| 11.01% |
| 7.00% |
| 17.43% |
| 11/30/2026 |
| $15.22 |
| $20.75 |
| 10.01% |
| 8.20% |
| 10.01% |
| 6/16/2023 |
| $4.52 |
| $20.59 |
| FTF |
| 10.15% |
| 8.25% |
| 13.39% |
| 4/15/2024 |
| $6.40 |
| $19.35 |
| FTF |
| 10.23% |
| 7.75% |
| 13.77% |
| 12/27/2024 |
| $9.07 |
| $18.69 |
| FTF |
| 10.25% |
| 7.50% |
| 14.40% |
| 9/27/2027 |
| $14.78 |
| $19.79 |
| FTF |
| 10.08% |
| 7.88% |
| 14.95% |
| 1/15/2025 |
| $8.66 |
| $19.14 |
| FTF |
| 10.60% |
| 8.00% |
| 14.50% |
| 10/15/2027 |
| $14.87 |
| $16.94 |
| FTF |
| 10.29% |
| 6.88% |
| 17.02% |
| 10/15/2026 |
| $14.08 |
| $16.40 |
| 10.82% |
| 7.00% |
| 10.82% |
| 1/15/2027 |
| $15.17 |
| $17.25 |
| 10.37% |
| 7.00% |
| 10.37% |
| 6/16/2023 |
| $8.13 |
| $21.40 |
| FTF |
| 9.84% |
| 8.25% |
| 13.02% |
| 3/30/2024 |
| $5.67 |
| $17.01 |
| 12.46% |
| 8.25% |
| 12.46% |
| 6/16/2023 |
| $8.47 |
| $16.00 |
| 12.85% |
| 8.00% |
| 12.85% |
| 6/16/2023 |
| $9.46 |
| $17.14 |
| FTF |
| 11.98% |
| 8.00% |
| 17.55% |
| 9/17/2024 |
| $10.84 |
| $19.73 |
| FTF |
| 11.09% |
| 8.63% |
| 14.37% |
| 7/30/2024 |
| $7.97 |
| $17.07 |
| 11.71% |
| 7.88% |
| 11.71% |
| 5/21/2026 |
| $13.96 |
Strategy
Our goal is to maximize total returns . We achieve those most effectively by including "trading" strategies. We regularly trade positions in the mortgage REIT common shares and BDCs because:
- Prices are inefficient.
- Long-term, share prices generally revolve around book value.
- Short-term, price-to-book ratios can deviate materially.
- Book value isn't the only step in the analysis, but it's the cornerstone.
We also allocate to preferred shares and equity REITs. We encourage buy-and-hold investors to consider using more preferred shares and equity REITs.
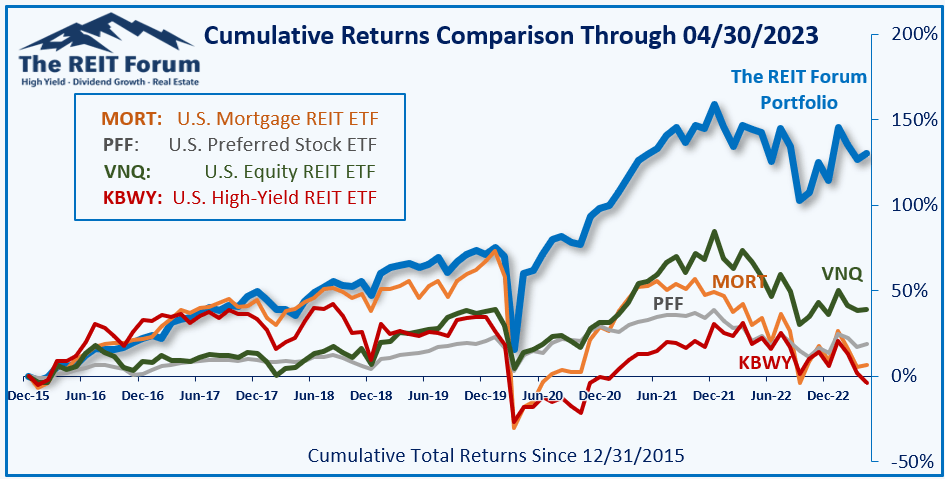
Performance
We compare our performance against four ETFs that investors might use for exposure to our sectors:
The four ETFs we use for comparison are:
| Ticker |
| Exposure |
| One of the largest mortgage REIT ETFs |
| One of the largest preferred share ETFs |
| Largest equity REIT ETF |
| The high-yield equity REIT ETF. Yes, it has been dreadful. |
When investors think it isn't possible to earn solid returns in preferred shares or mortgage REITs, we politely disagree. The sector has plenty of opportunities, but investors still need to be wary of the risks. We can't simply reach for yield and hope for the best. When it comes to common shares, we need to be even more vigilant to protect our principal by regularly watching prices and updating estimates for book value and price targets.
Ratings: Bullish on AGNCP, RC-E, DX-C, RITM-C, RITM-D, EFC-A
As usual, we will change our positions and outlooks as share prices change. We are particularly interested in relative prices, as evidenced by moving back and forth between AGNCM and AGNCP.
For further details see:
9% Dividend Yields Or Higher At Big Discounts