VWO - A Bull Case For Emerging Markets
Summary
- The 2023 US outlook is grim but not cause for panic.
- In times of uncertainty, let's turn to the data.
- The US may look to decrease its current account deficit.
- Emerging markets would benefit from this.
Intro
Inflation is always and everywhere a monetary phenomenon in the sense that it is and can be produced only by a more rapid increase in the quantity of money than in output.
Investors had a tough year in 2022. From an all-time high in January, markets came to the swift realization that inflation was a problem (and not a transitory one). The Fed has begun the fastest rate hike cycle in history, which led to one of the worst years in history for the traditional 60/40 stock/bond asset allocation. Diversification is a strength in any portfolio, but sensible diversification in global equities will be important to protect against tail risks in the US and may present a good opportunity to leverage global trade mechanisms for positive investment returns. An emerging markets investment is a good tool for diversification and can help combat home-country bias . iShares Core MSCI Emerging Markets ETF ( IEMG ) is a strong option considering its low expense ratio , solid diversification in its top holdings (among the top 10 there are companies from China, India, Taiwan, South Korea, and Brazil), and tech exposure.
Setting the Stage
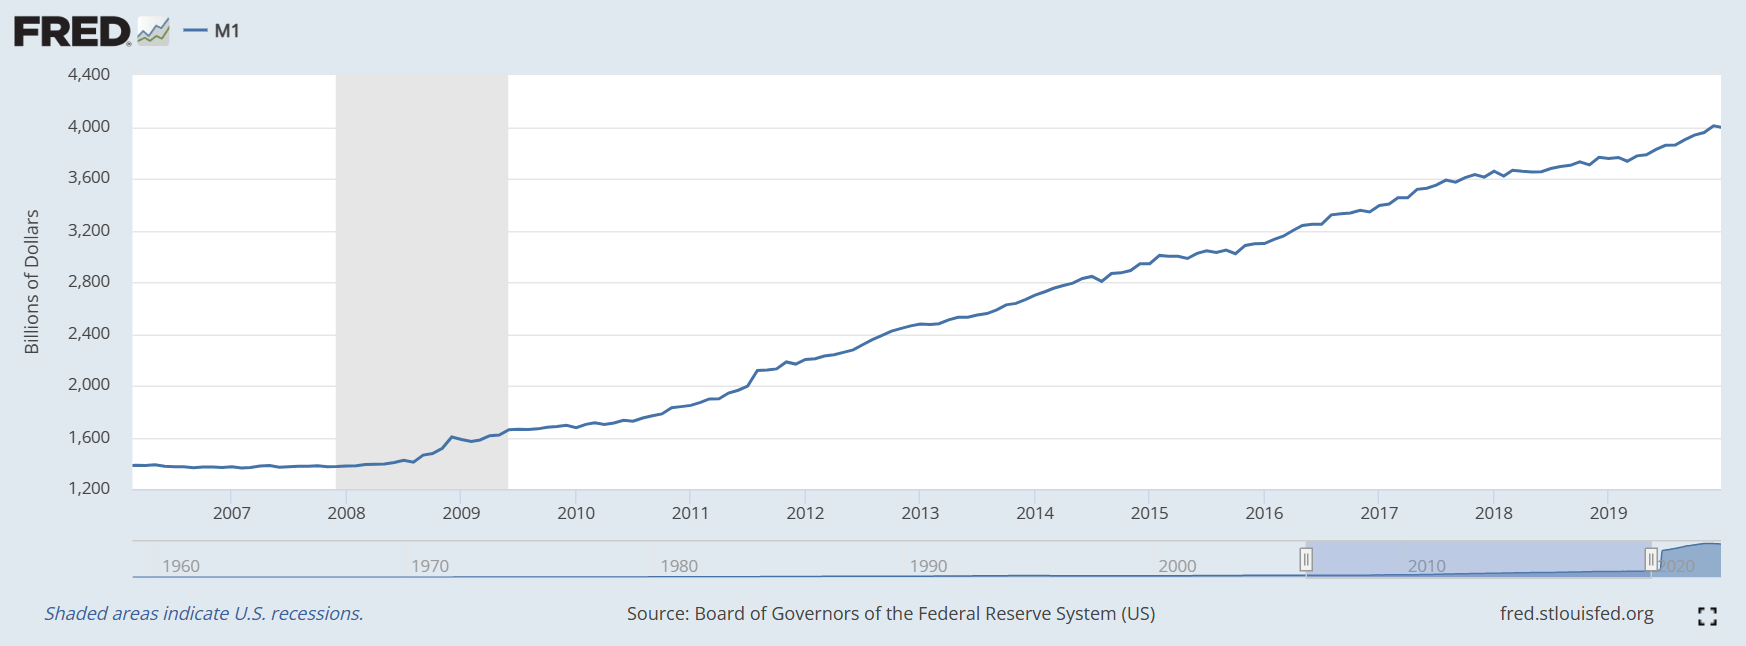
Remember the experimental concept of QE that was used to (practically save) the US financial system in 2008, and bolster the economy amidst the headwinds after the fact?
M1 Money Supply 2007-2019 (Federal Reserve Economic Data)
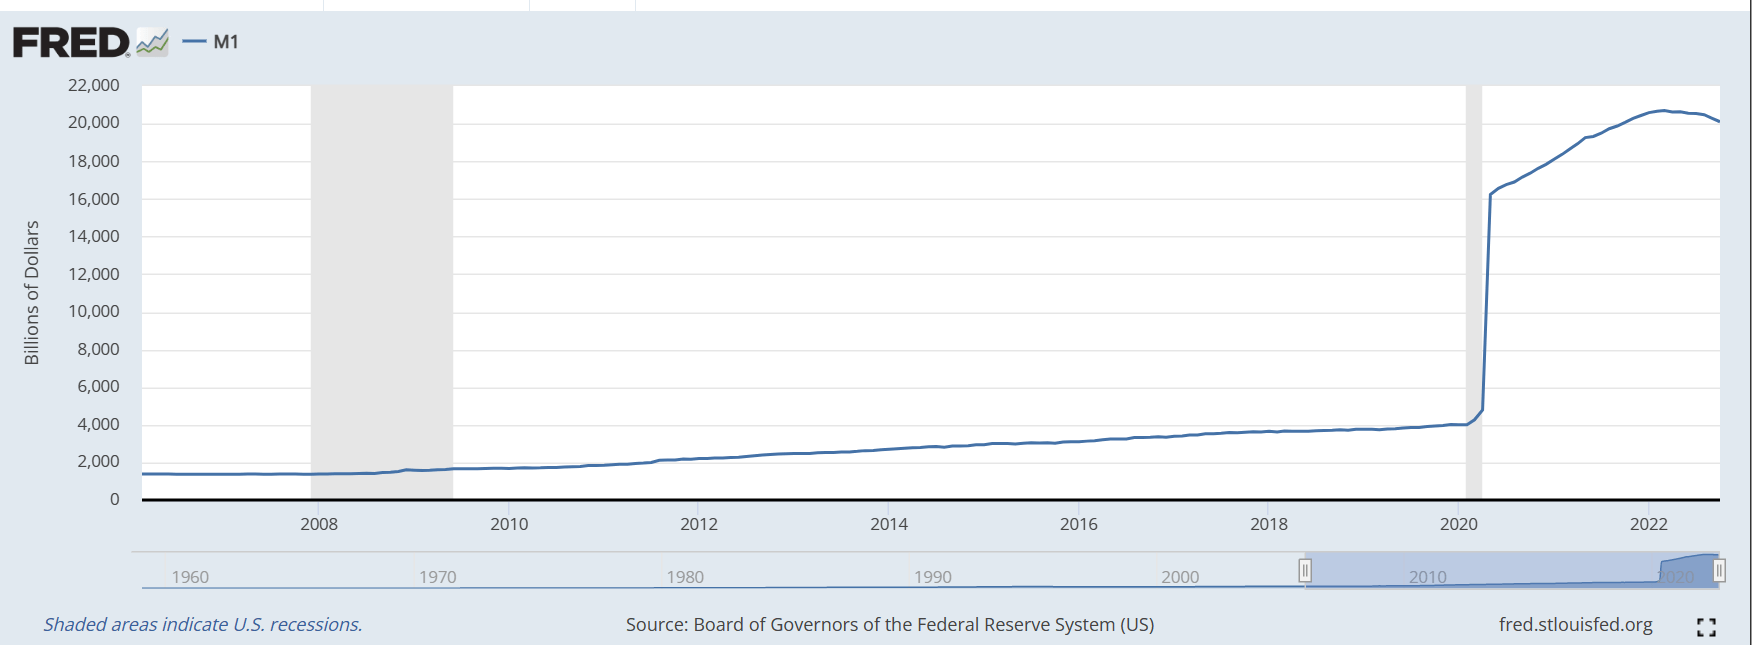
Well, that historic increase in money supply looks like this now:
M1 Money Supply 2007-2022 (Federal Reserve Economic Data)
It's not about whether or not that was the right decision. We had a once-in-a-century exogenous shock that caused a swift and severe recession and needed a dramatic response to help the economy. That response was easy money and seemingly infinite liquidity, with the hope of stimulating economic activity. The hope was realized, and as these policies rippled throughout the economy we became frenzied. Quite predictably (in hindsight), the market hit all-time highs in January 2022 after digesting the economic fervor of the second half of 2021. The economy and markets were drunk on liquidity and easy money, and the bulls were rampaging in US equities. Economic fundamentals eventually caught up to markets - and you know the rest. Inflation rang through the economy, our eyes opened up and the hangover began.
A 40-year high in inflation is expected to ripple pretty seriously throughout the economy. The Fed flooded the economic pipes with liquidity and easy money, and the pipes started gushing with forced output. Composite PMI was high from mid-to-late 2021 with expectations that inflation was transitory and that the markets had priced in inflation risk. Toward mid-2022, the Fed began turning the liquidity and easy money knobs the opposite way in response to lingering inflation.
The 2023 picture is grim - and there aren't many places you can look to feel a sense of relief. Perhaps the most relieving thought is that it's impossible to predict the economy, and these recession fears may pass for some reasons that aren't clear now but will seem obvious in hindsight. Many investors are desperately clinging to the hope for a pivot to signal the bottom. However, the Fed has solidified its Hawkish stance:
A number of participants emphasized that it would be important to clearly communicate that a slowing in the pace of rate increases was not an indication of any weakening of the Committee's resolve to achieve its price-stability goal or a judgment that inflation was already on a persistent downward path.
It's unlikely we see a pivot on the interest rate hike cycle in the first quarter of 2023. If inflation is persistently high and not showing a strong enough downward trend, the Fed may remain Hawkish for much longer than most investors are hoping for, and the bottom will not be so easily determined.
Data Discussions
To develop expectations about future economic performance, we first need a solid view of the current state of the economy. I'll be focused on a few different discussion points that are impactful on both the domestic and international stages. These points will be inflation & interest rates, interest rates & international dollar strength, international dollar strength & the balance of trade, the balance of trade & international debt, and finally a prediction of who might benefit most from these relationships.
Inflation and Interest Rates
The concept of inflation fuels uncertainty. If I expect inflation to be 5%, should I buy a computer today for $1,000 or wait until next year? Most people would recommend buying it now, instead of waiting and spending $1,050 next year. If most people make the decision to buy now, this will drive inflation. So let's say the real inflation rate was 7% instead. Now, that computer costs $1,070 and some people are priced out of the market. As demand falls, the company struggles to sell this computer, and they decrease prices. The rate of inflation now is -5% and the computer costs $1,016.50. People who are now in the market for this computer will recognize the deflation and may elect to wait until next year in the hope of further deflation. This vicious cycle in consumer behavior details quite concisely why inflation is preferred to deflation, but at a modest rate.
Inflationary and deflationary cycles are caused by consumer behavior and expectations. If inflation is high and expected to remain elevated, people will request higher wages to compensate for their loss of purchasing power. To offset the cost of higher wages, firms will increase prices (increasing inflation) or reduce headcount (increasing unemployment), either way weakening demand. Increased interest rates decrease the rate of lending as fewer consumers and corporations demand these higher-priced loans. In a fractional reserve banking system in which lending is an engine for growth in the money supply, slowing the rate of lending can help decrease the money supply. The most common monetary tool for managing inflation is interest rates. The Fed, or other central banks, can increase the benchmark rate to increase the cost of borrowing money. This increase will weaken demand and decrease currency in circulation, easing inflation.
Interest Rates and International Dollar Strength
Interest rates have more impact than just weakening demand and decreasing the money supply. Since the benchmark rate represents the "risk-free" rate in bond markets, international demand for the currency increases as the interest rate increases. As more international investors buy a domestic currency, the price increases. In other words, the currency appreciates against other international currencies. In accounting terms, the domestic country's capital account is increasing through transactions in financial assets. The US is increasing financial asset exports by increasing rates and attracting more investors while importing currency in exchange for those assets, which increases our capital account surplus. Currency appreciation increases demand for imports as it makes foreign goods comparatively cheaper. This increase in imports increases the current account deficit which offsets the capital account surplus.
From this standpoint, we have a very clear resemblance to the Volcker Era. Namely, high rates and a contracting money supply to combat inflation. The key difference between then and now is globalization and the status of the United States on a global scale. Until about 1980 the United States was a creditor nation, running a current account surplus and capital account deficit. From 1980 to the present day, the United States has transformed into the largest debtor nation globally. This brings me to my next point of comparing dollar strength and the balance of trade.
Dollar Strength and the Balance of Trade
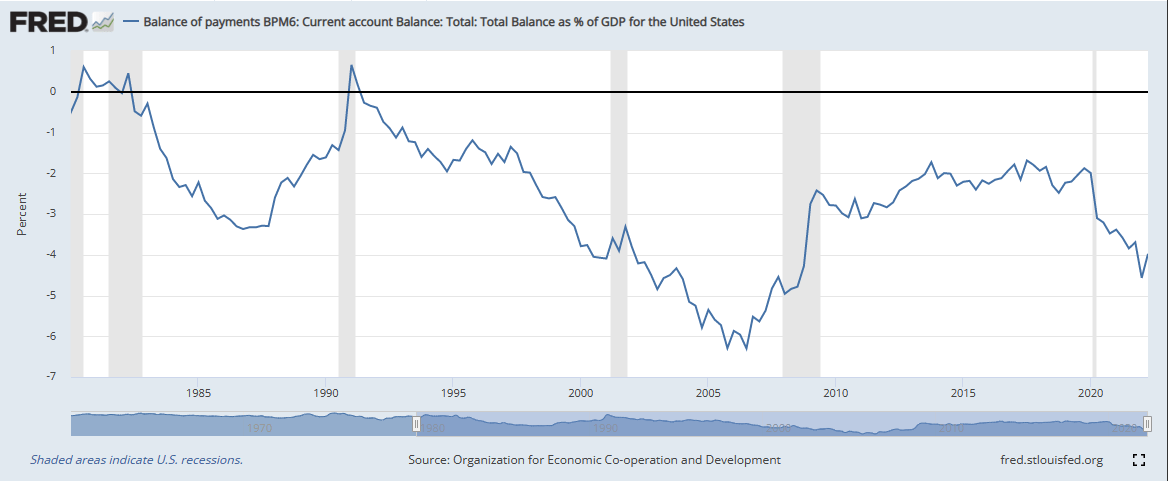
For the past 40 years, the United States has been the largest debtor nation in the world. In his 2008 book The Ascent of Money, Niall Ferguson even goes so far as to call China the bank of America and merges the names as 'Chimerica', which he says has been the engine for world growth. When interest rates are increased and the dollar appreciates, foreign goods become much cheaper. This is an underlying mechanic of a trade deficit. To peel back another layer, we can take a look at the current account balance as a percentage of GDP, which shows the magnitude of our deficit relative to productivity. A value underneath the black line is a deficit:
Balance of payments in current account 1984-present (Federal Reserve Economic Data)
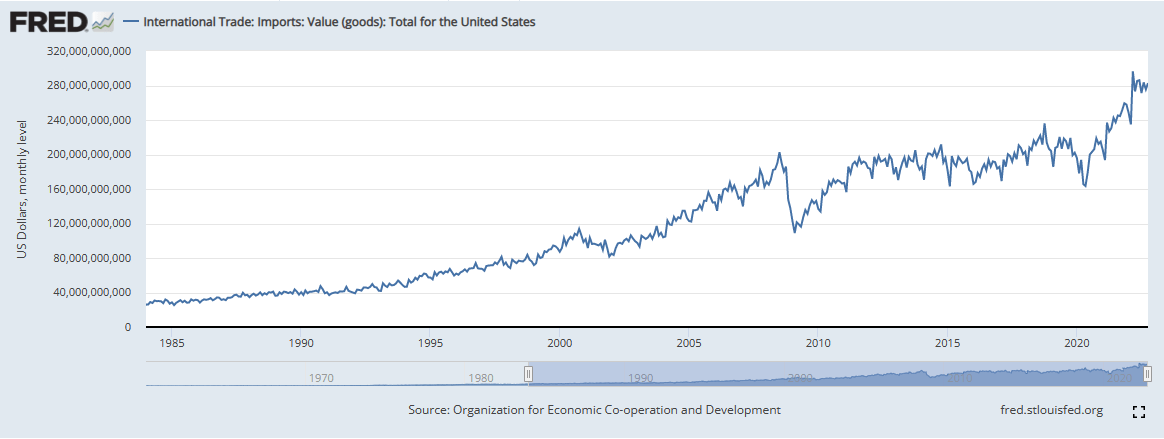
A trade deficit relative to GDP isn't necessarily an issue. For example, we may elect to import goods for cheaper than we can produce them at home:
Total value of goods imports (Federal Reserve Economic Data)
This can be a net benefit if we shift more resources toward nascent and growing industries. However, there is concern that dollar strength and the US capital account surplus are draining capital from higher-growth international markets. The capital account represents transactions in financial assets, so our surplus means we are a net exporter of financial assets. Included in these financial assets is government debt, in the form of bonds.
Balance of Trade and US International Debt
Another mechanic of international trade is the accumulation of foreign exchange reserves. Since the dollar is the global standard, foreign companies are likely to accept payment in the dollar or their domestic currency (traditionally, the buyer pays with the foreign currency that he exchanged for his domestic currency). This has led to major accumulations of the dollar in reserves :
| Rank |
| Country |
| Billion USD |
| Data as of |
| 1 |
| China |
| 3,289 |
| November 2022 |
| 2 |
| Japan |
| 1,226 |
| November 2022 |
| 3 |
| Switzerland |
| 885.05 |
| November 2022 |
| 4 |
| Russia |
| 581.7 |
| December 2022 |
| 5 |
| India |
| 562.85 |
| December 2022 |
Additionally, many countries peg their currency exchange rate against the dollar. China is the foremost example, pegging the Yuan to trade within a range of roughly 6-7 Yuan per dollar. Many countries in the global economy have a vested interest in the success of the US economy, despite a growing narrative that BRICS is a material threat to US global dominance. Global growth is not a zero-sum game. There are mutually beneficial mechanisms underlying many international economic decisions. A destabilization of the dollar would cause a precipitous decline in American markets and a protracted US recession that would certainly wreak mayhem on the global economy. Some people believe the rapid growth in M1, coupled with the increasing burden of debt payments, will be enough to destabilize the dollar. This assumes our economy has been growing as a result of money printing, not productivity growth and re-investment. As with our federal deficit, if we are utilizing debt to increase our future productive capacity, then our massive current account deficit may not be an issue. The competent allocation of assets is a core element of both investment management and macroeconomics. However, if you are one who believes the dollar is at risk of destabilization, Bitcoin and precious metals are almost a no-brainer from a diversification perspective. In terms of equities, I think emerging markets will be a winner over the next decade.
Now what?
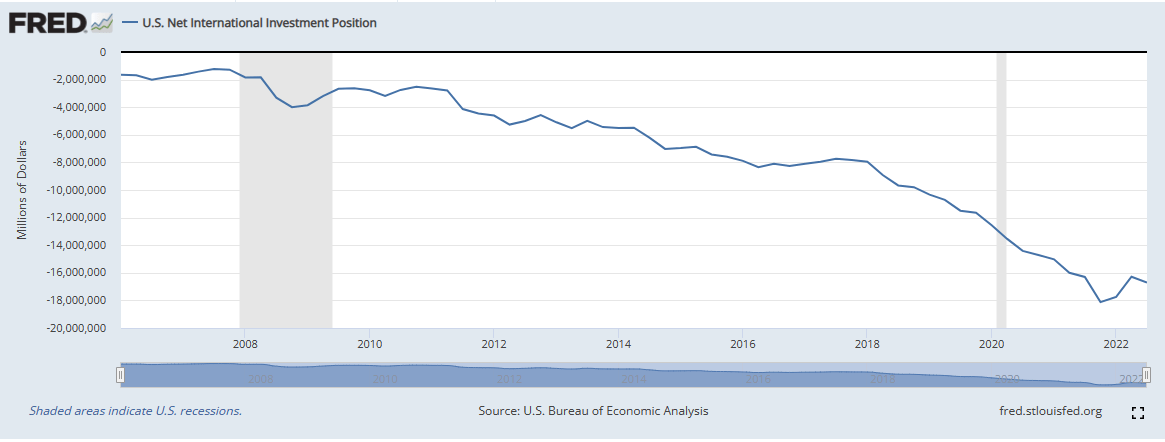
The US may look to reduce the current account deficit. Increasing exports can stimulate domestic growth. The important thing is to begin trending toward a surplus. We are in a deep deficit that won't be reversed overnight, so the trend is the important aspect. The US has been running a large capital account surplus to offset our current account deficit. If we begin to reduce our current account deficit, we'll see a corresponding reduction in the capital account surplus. In other words, we'll need financial asset debits on the T-account. This means we need to buy back the financial assets we've been selling globally since the 1980s. This will reduce international debt and may put upward pressure on the dollar. A strong dollar helps the US international debt since most of our debt is denominated in USD (if you pay the debt off in foreign currency and your domestic currency is appreciating, you effectively have a lower debt burden). Another way to influence our capital account surplus is to become a net buyer of international financial assets. Net international investment in the US has been negative and trending down for the past 15 years, but looks like it could be reversing course from a 2021 bottom. Have a look at our net international investment since 2006:
US Net International Investment 2006-2022 (Federal Reserve Economic Data)
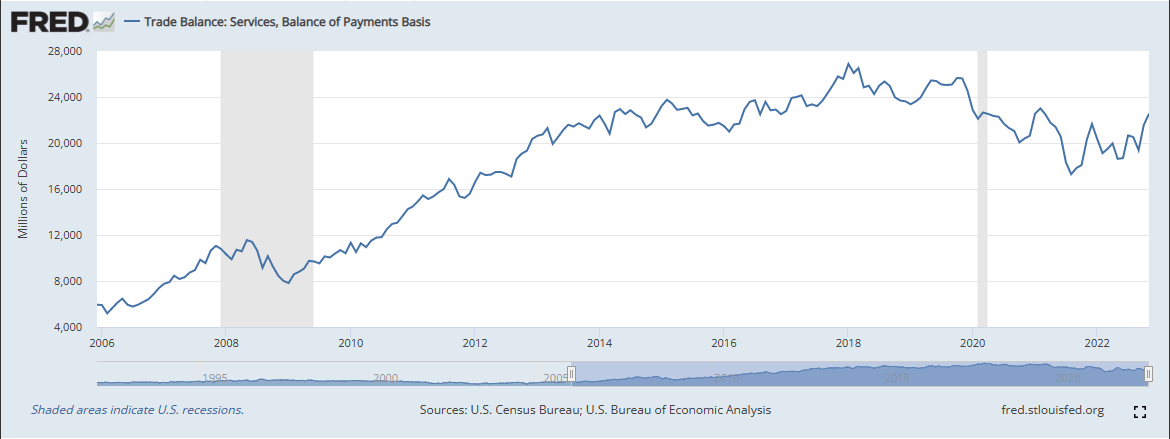
If my diagnosis and theory about the path forward are correct, then net international investment may increase over the next decade. If US net international investment increases, there will be upward price pressure in emerging markets. The US can achieve this through further service exports. Service exports are accounted for as credits on the current account and as debits (imports of financial capital) on the capital account. This will further decrease the magnitude of the current account deficit, and correspondingly the capital account surplus, which can help emerging markets.
US Services balance of trade, 2006-2022 (Federal Reserve Economic Data)
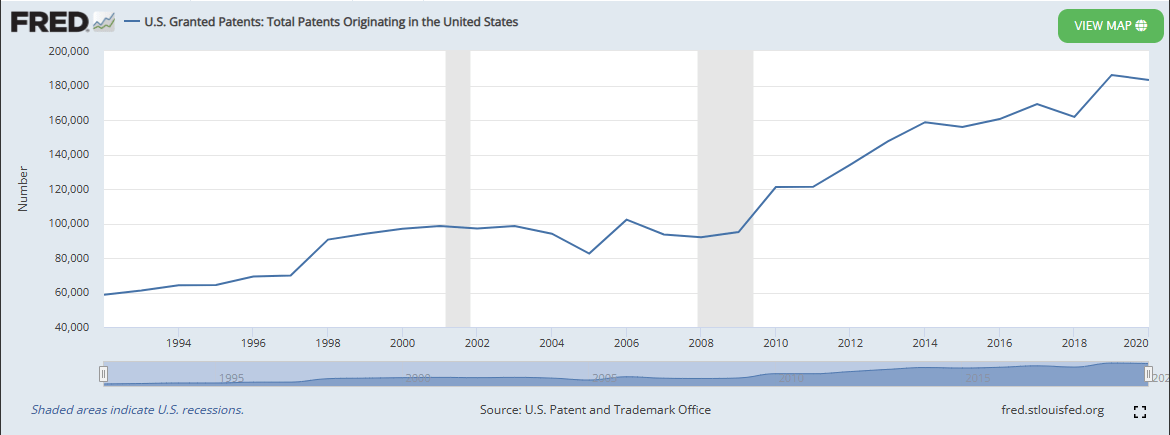
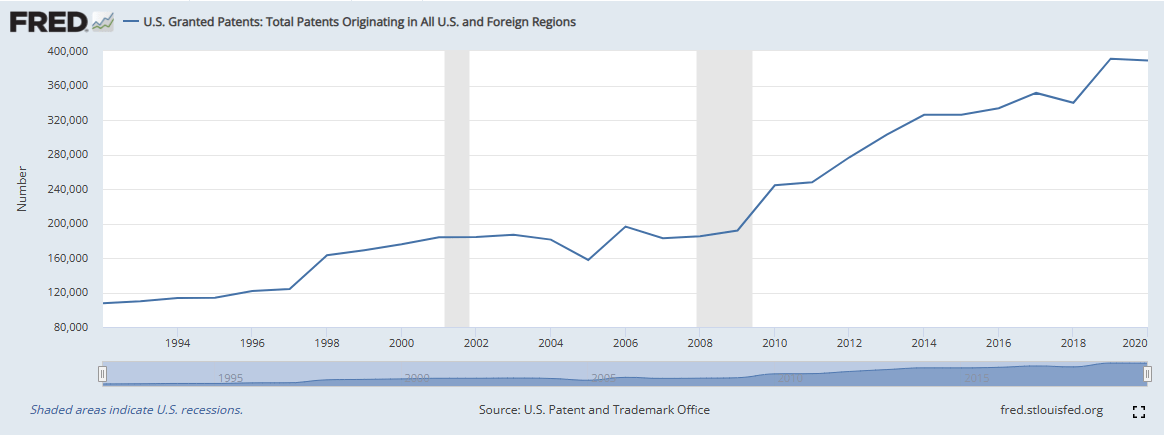
Services trade includes things like construction, insurance, financial services, and charges for the use of intellectual property. Charges for use of intellectual property can be a big engine for service export growth as more developing economies continue to modernize and set ambitious growth goals. These economies will likely utilize cutting-edge US technology to help meet their goals. The below graph is patent originations attributed to the US, and the next graph is total patent originations, US and foreign. The US is the clear leader and has been consistently originating nearly half of all new patents:
Patents originating in the US 1992-2020 (Federal Reserve Economic Data) All patent origination 1992-2020 (Federal Reserve Economic Data)
With such dominant control over the market for patents, the US is in a good position to continue growing service exports. Specifically, we are well-positioned to enjoy rapid growth in charges for use of intellectual property. As foreign countries invest in their own economic growth they will likely lean further on US-patented technology, trading financial assets for US services.
What to buy?
Picking individual stocks within the emerging markets space presents too much risk for me. For that reason, I'm looking further into emerging markets ETFs. The 5 largest funds by assets under management are:
| VWO | |||||
| Vanguard FTSE Emerging Markets ETF | |||||
| 71.10B | |||||
| 0.08% | |||||
| -16.58% | |||||
| 3.89% | |||||
| 2005-03-04 | |||||
| IEMG | |||||
| iShares Core MSCI Emerging Markets ETF | |||||
| 66.68B | |||||
| 0.10% | |||||
| -17.12% | |||||
| 2.55% | |||||
| 2012-10-18 | |||||
| EEM | |||||
| iShares MSCI Emerging Markets ETF | |||||
| 24.02B | |||||
| 0.69% | |||||
| -17.43% | |||||
| 2.41% | |||||
| 2003-04-07 | |||||
| SCHE | |||||
| Schwab Emerging Markets ETF | |||||
| 8.65B | |||||
| 0.11% | |||||
| -15.32% | |||||
| 2.71% | |||||
| 2010-01-14 | |||||
| EEMV | |||||
| iShares Edge MSCI Min. Vol. Emerging Markets ETF | |||||
| 8.36B | |||||
| 0.25% | |||||
| -12.39% | |||||
| 1.86% | |||||
| 2011-10-18 | |||||
| Ticker | Fund Name | Assets under management | Expense Ratio | 1Y Perf | Dividend Yield |
|---|---|---|---|---|---|
| Inception Date |
VWO, IEMG, SCHE, and EEM are all very similar. They share the same top 2 holdings, as well as 6 common holdings across their top 10. All have nearly 40% allocation to the financial and tech sectors. EEMV is a bit different with more telecom exposure and smaller names in the top 10 holdings. For a buy-and-hold investor, I'm comfortable eliminating both EEM and EEMV from the decision here because of the higher expense ratios. VWO, IEMG, and SCHE are all very similar, but I'll refine our decision down to VWO and IEMG based on assets under management.
VWO offers a quarterly dividend with a yield of 3.89%, compared to IEMG's semi-annual dividend with a yield of 2.55%. VWO has performed better than IEMG in terms of total return historically. Both of these ETFs are solid options. The reason I am picking IEMG over VWO is that IEMG has a slightly higher exposure to tech (18.37% vs VWO at 15.96%). I believe tech will present the strongest growth opportunities in the emerging markets space, so I'm recommending the ETF which provides more exposure to tech.
Conclusion
Despite underperforming US equities over the past decade, I feel the economic landscape shifted sufficiently in 2022 for investors to look at their asset allocation and consider more diversification strategies. Starting with the rapid increase in inflation and the resulting interest rate hike cycle, the investment landscape was precarious in 2022. The underlying risk might be priced in at this point, but risk considerations should still be at the forefront of all investment decisions. Composite PMI data points to a contraction in US economic activity in 2023. Investors will need to practice continued due diligence in their asset allocation to ensure they are sufficiently diversified and within their risk appetite. Emerging markets will provide great risk-weighted upside potential, and are a fantastic diversification tool for the foreseeable future.
For further details see:
A Bull Case For Emerging Markets