TWO - A High Yield Disaster
2023-05-11 18:15:48 ET
Summary
- The first company is off to a dreadful start to the year. Prices were finally wrecked hard enough to be slightly attractive for speculative positions.
- We also have a few alternatives for investors looking to get a higher yield without so much damage.
- The preferred shares are still being priced incorrectly, so investors can get a materially better deal by choosing carefully.
Get ready for charts, images, and tables because they are better than words. The ratings and outlooks we highlight here come after Scott Kennedy’s weekly updates in the REIT Forum. Your continued feedback is greatly appreciated, so please leave a comment with suggestions.
It is time to review a few high-yield shares again. Once again, we will cover each share quickly rather than doing deep dives.
Two Harbors ( TWO ) is the first REIT on the plate.
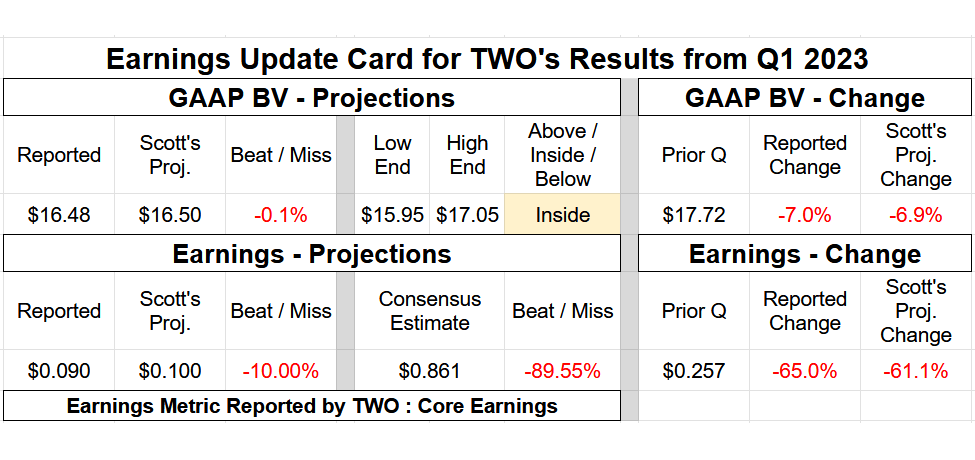
Scott Kennedy already provided a full review of TWO’s Q1 2023 earnings for members of The REIT Forum, including the card to summarize results:
The REIT Forum
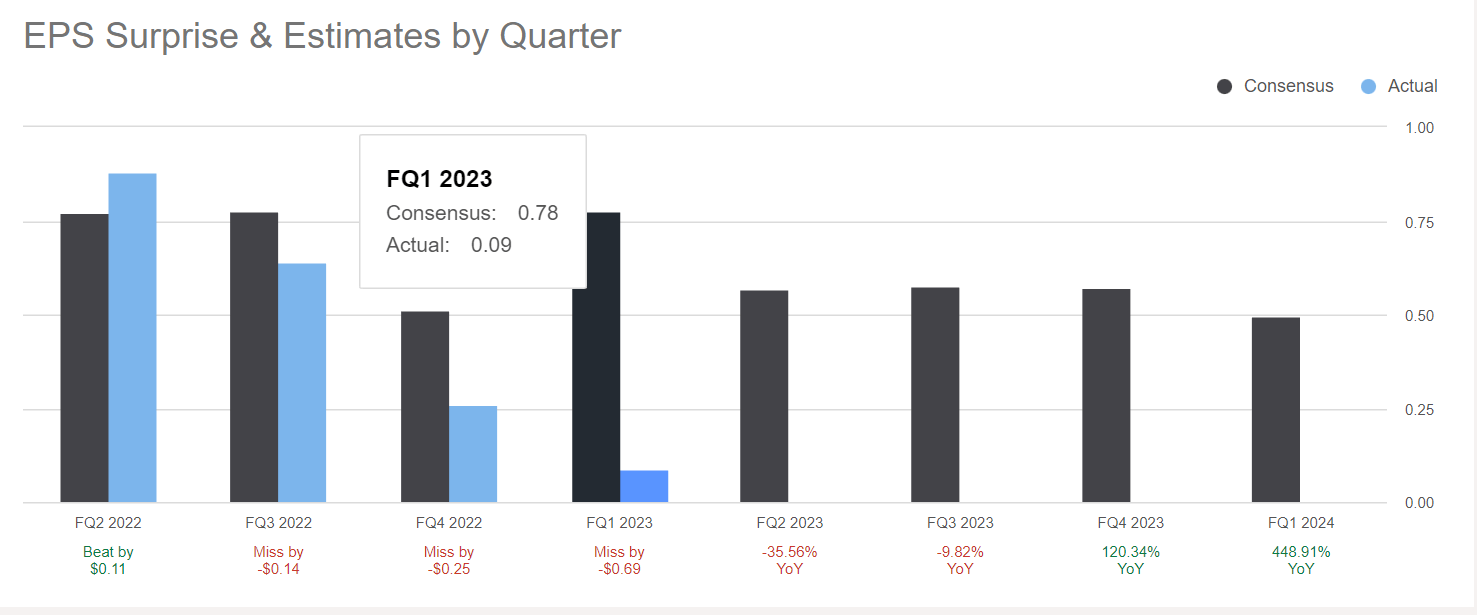
Earnings were very close to Scott’s estimate. Sure, it's a “10%” difference, but it was down massively from the prior quarter and even more from prior quarters. We use the consensus estimate as of the end of the prior quarter in these cards rather than letting the consensus estimate be updated up until the night before earnings come out. However, you can verify that it was a huge miss using this chart from Seeking Alpha:
Seeking Alpha
Terrible, right?
That wasn’t a trick question. It was bad. I could explain what happened, but Scott Kennedy already did:
As a reminder/refresher, TWO has previously been one of the rarer peers to utilize both interest rate payer and receiver swaps to hedge against the company’s agency MBS and MSR sub-portfolios back in 2022. Interest rate payer swaps were utilized to hedge TWO’s fixed-rate agency MBS sub-portfolio while interest rate receiver swaps were utilized to hedge the company’s MSR sub-portfolio. In a rapidly rising interest rate environment, it is advantageous to hold onto interest rate payer swaps (as LIBOR/SOFR/PRIME quickly rises) and it is disadvantageous to hold onto interest rate receiver swaps. During the third quarter of 2022, TWO’s management team decided to exit all of the company’s existing interest rate receiver swaps and interest rate payer swaps. While I stated, at the time, I 100% agreed regarding exiting TWO’s receiver swaps, I 100% disagreed with exiting all of the company’s payer swaps as well. These particular interest rate swaps were just coming “into the money” per se and would have led to a long-term string of current period hedging income over the foreseeable future (due to the recent rapid rise in LIBOR/SOFR/PRIME). As of 6/30/2022, TWO’s interest rate payer swaps had a notional value of ($8.0) billion, a weighted average fixed-pay rate of 1.90%, and a weighted average maturity of 7.0 years. In my professional opinion, TWO should not have “dumped” this side of the derivatives equation per se back then. This was a leading factor to the notable drop-off in current period hedging income.
This is one of the main reasons why TWO’s net adjusted spread income margin decreased from 2.70% during the second quarter of 2022 to just 0.52% during the first quarter of 2023. There simply was/is no swap “offset.” In other words, there was no offset to higher borrowing costs through an increase in current period hedging income. Both U.S. Treasury futures and Eurodollar futures are a different type of derivative instrument that do not have the same type of current period, cash interest/(expense) component. This was explained, in detail, in prior sub-sector earnings chat notes.
Notice that the futures contracts do not produce cash interest income or expense. That’s important when it comes to understanding earnings for a REIT. Wall Street messed that up and ended up with dramatically inaccurate earnings estimates. That mistake was common enough to drive the consensus earnings estimate. Futures contracts still function as a hedge, but they appear to confuse many investors and at least a handful of analysts.
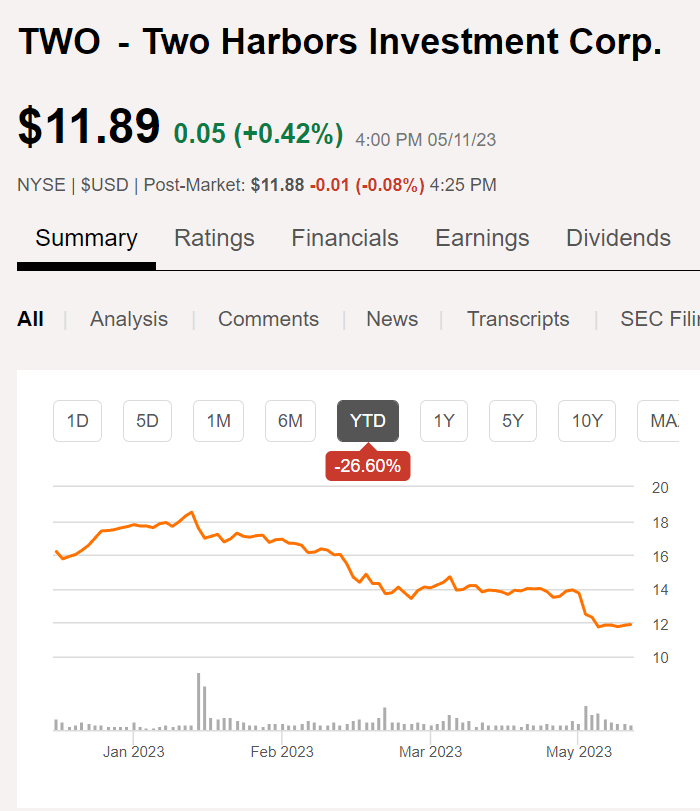
Regardless, TWO is having a dreadful year:
Seeking Alpha
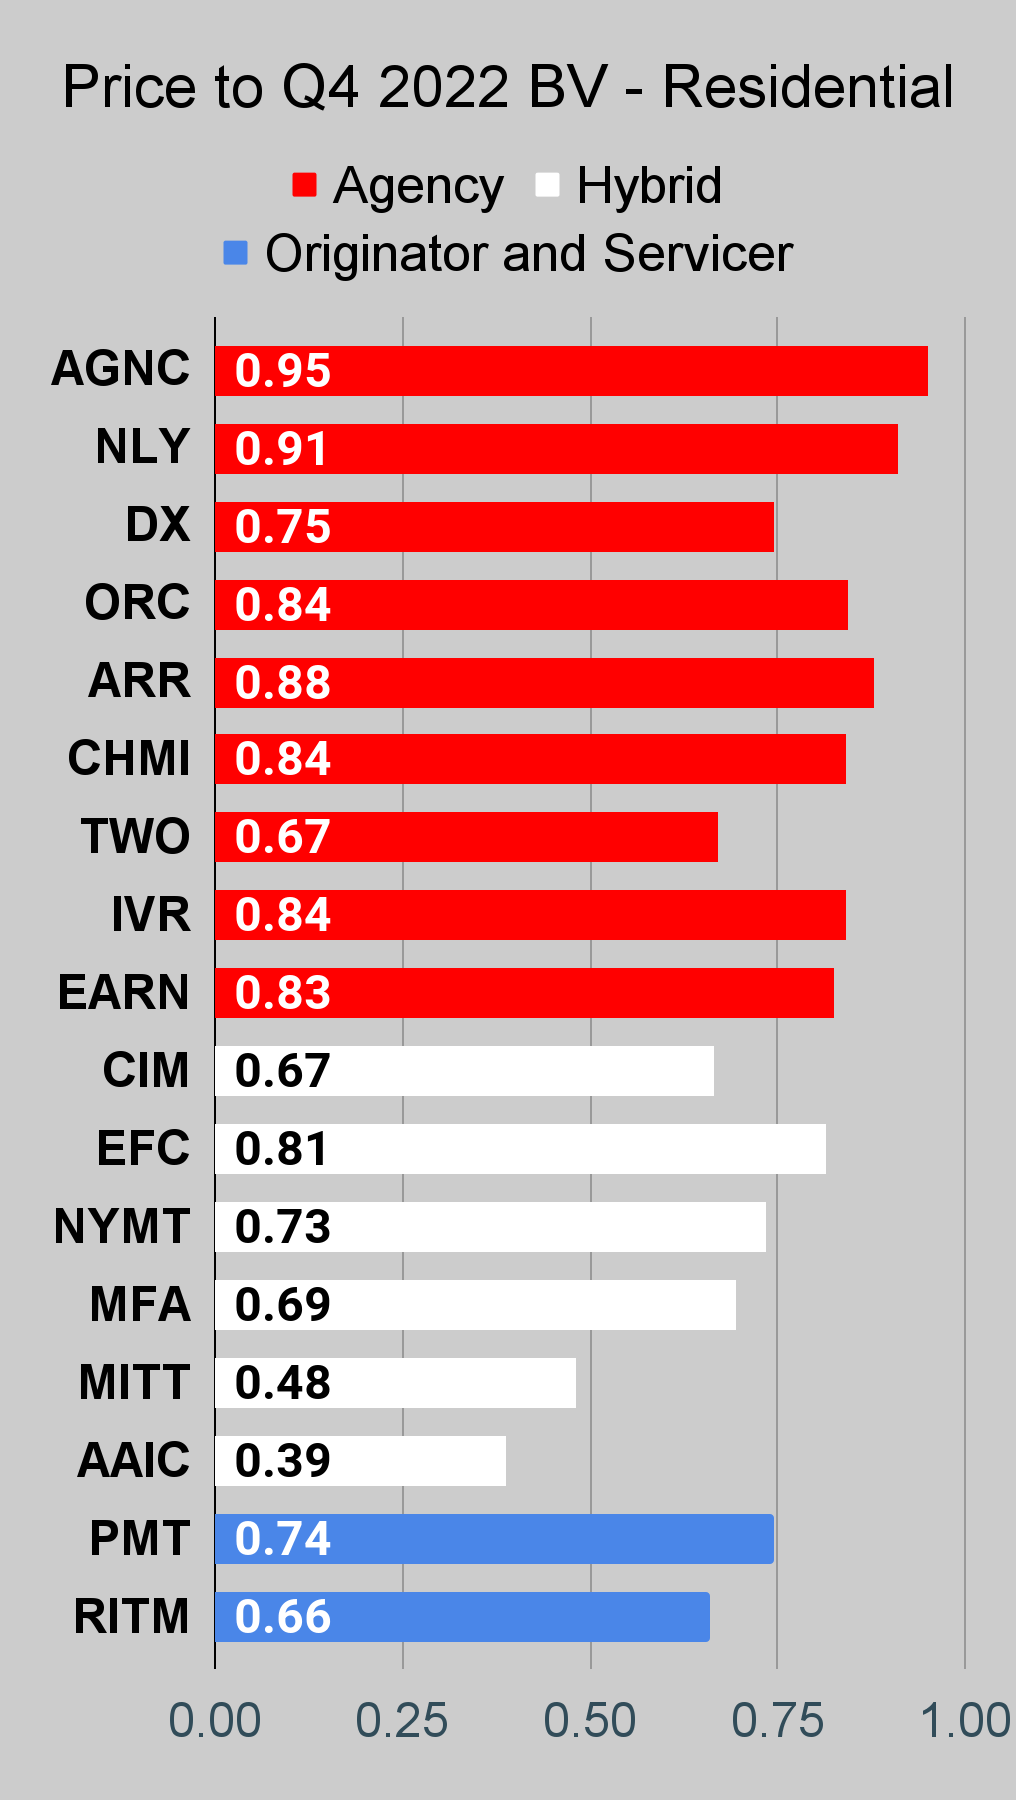
TWO actually got their behind beat bad enough to drop to .74 price-to-book ratio (using our estimates for BV as of last Friday and today's share price).
Moving on, NLY trades at about a 9% discount to our book value per share estimate. We suggested that may happen previously, but investors often don't want to hear those warnings. Oh well, you click my article to get my view.
Some Preferred Shares
Looking at some of the other shares that are attractive, how about any of the preferred shares from PMT? PMT-C has the biggest discount to call value. However, PMT-A and PMT-B would have higher floating yields when the floating rate kicks in. Relative values between PMT-A and PMT-B are pretty similar. Prices are about $.20 apart. PTM-A has a higher price and a modestly smaller floating spread, but it starts floating three months earlier. I’ll lean towards PMT-B at $21.23 over PMT-A at $21.43 , but either is a fine choice for investors looking for fixed-to-floating shares.
The market still messes up relative valuations on shares from the same REIT. How about RITM-A at $21.15 and RITM-B at $19.52? That’s a spread of $1.63 in the share price. RITM-A pays a higher dividend per share, but has a lower yield due to the difference in price.
When shares float, RITM-A’s spread of 5.802% is better than RITM-B’s spread of 5.64%. However, the difference is only worth $.0405 per share per year.
Based on fixed-rate dividends, RITM-A pays an extra $.0925 per share per year. That lasts a little over a year. Then the difference resets to $.0405 per year. Now how many years do you think it takes to recover $1.63? Too many. That’s absurd. RITM-B is the clear winner over RITM-A.
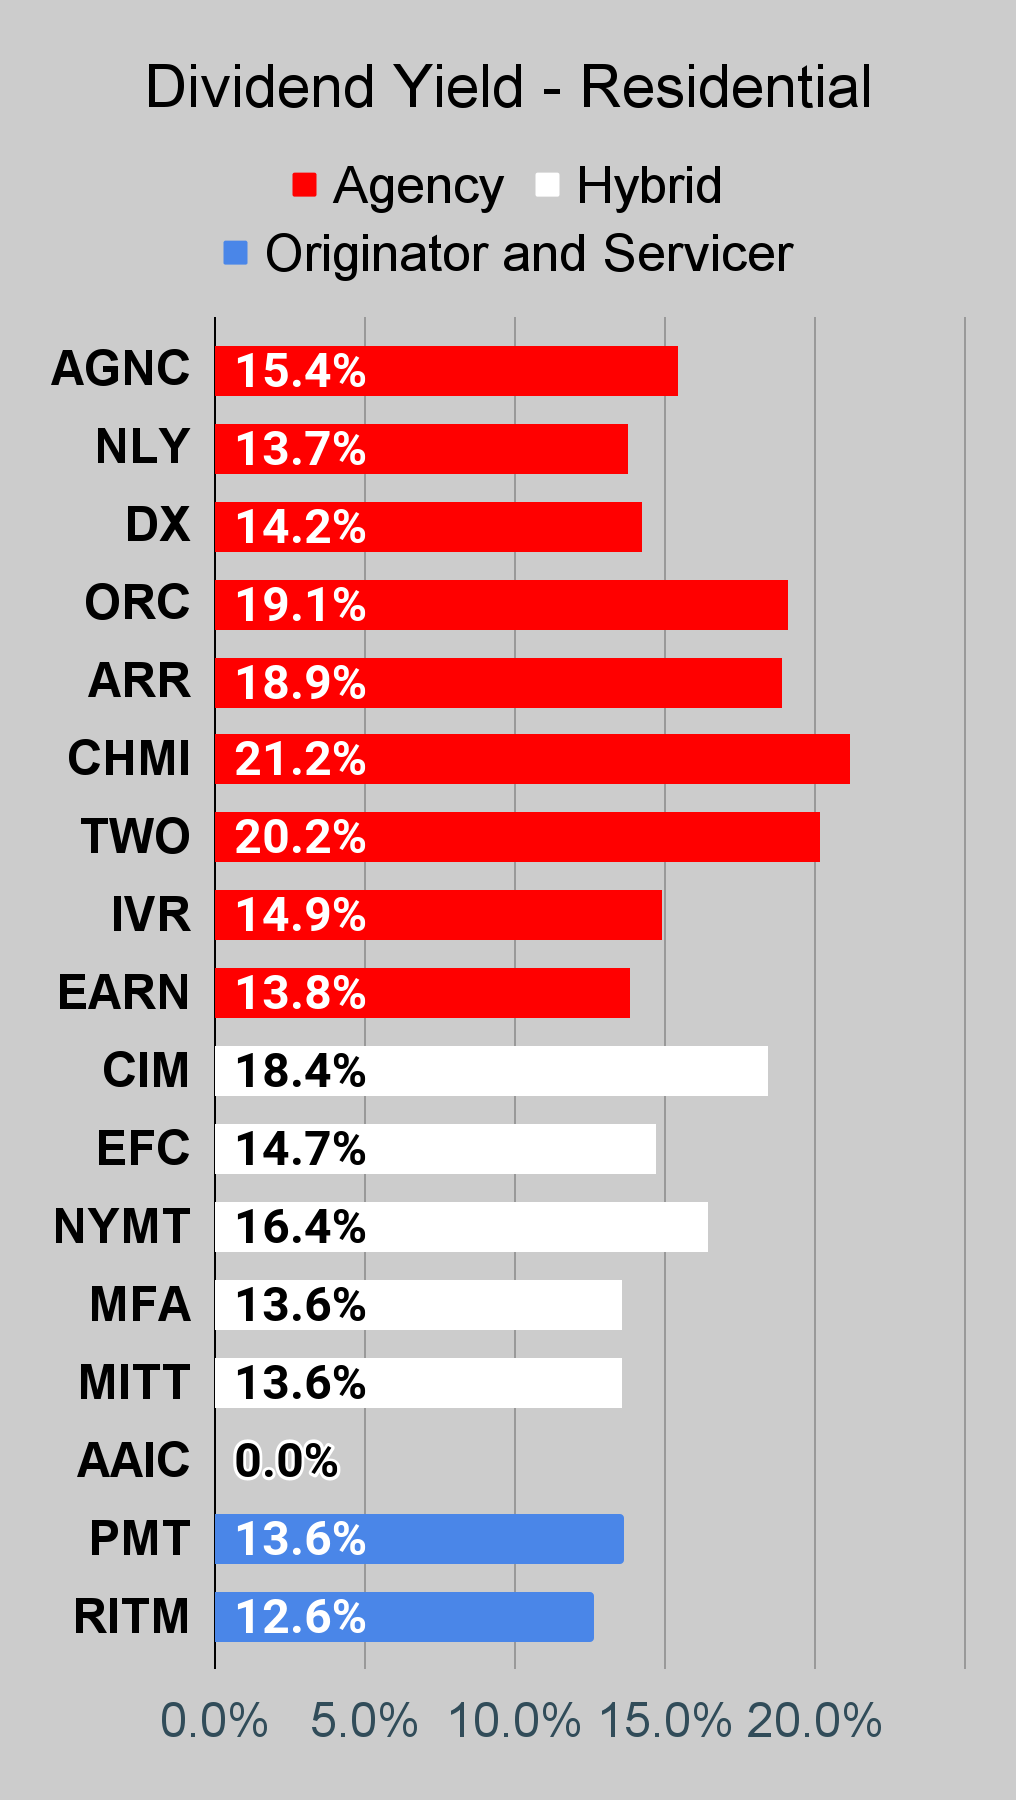
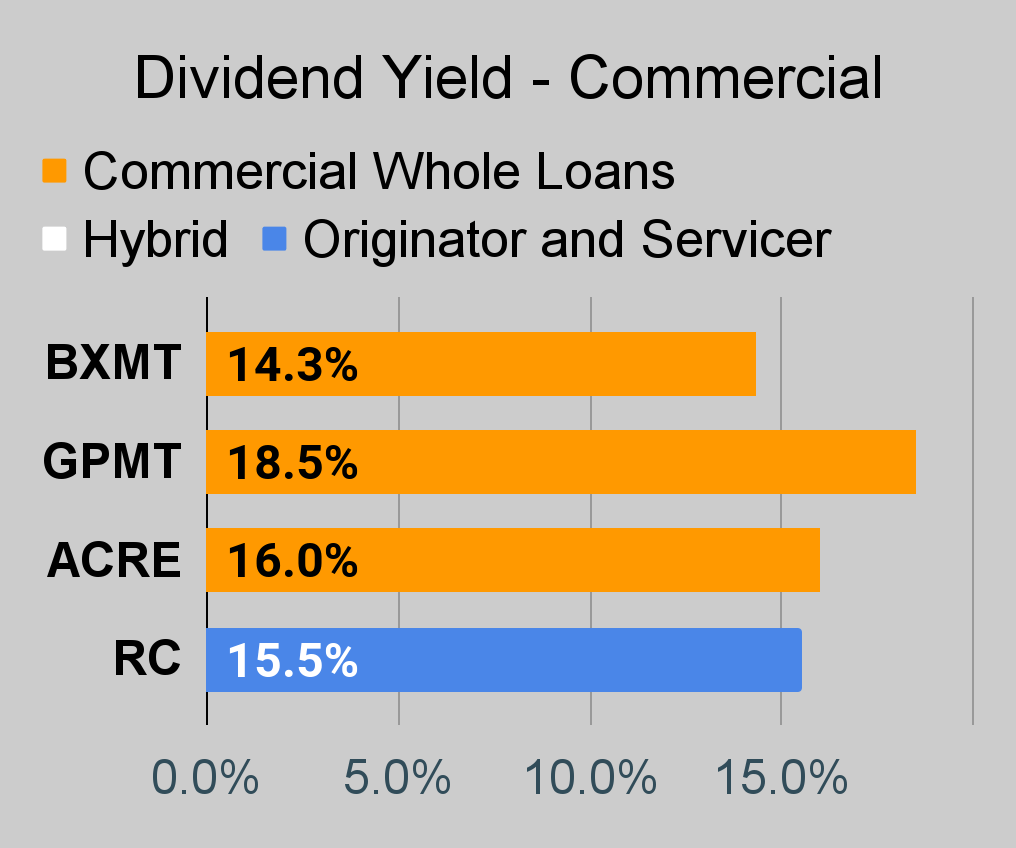
Want the dividend yields? See the charts below. I laid it out compared with all the other shares for the sector, so there's a reason to post it in the text.
Interest Rates
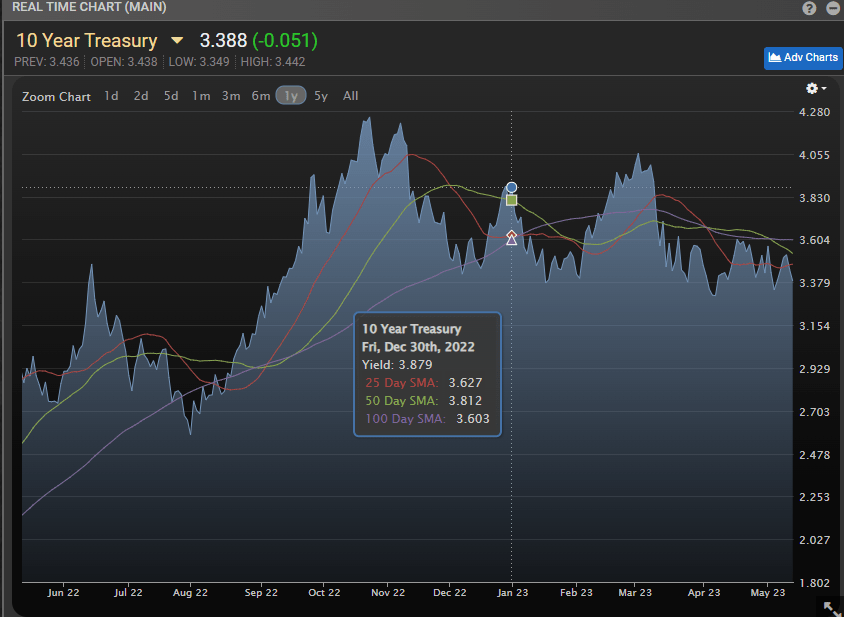
Mortgage REITs have been getting smacked around. Some investors will say it is because interest rates keep going up. However, that only applies to short-term rates. Long-term rates are actually down quite a bit year-to-date:
MBS Live
Rates dropped from 3.879% to 3.388% if we use the 10-year Treasury for measurement. However, the yield curve is quite inverted as investors believe the Federal Reserve will respond to the combination of falling inflation rates and an upcoming recession. This will be one of the most widely telegraphed recessions in our history.
Stock Table
We will close out the rest of the article with the tables and charts we provide for readers to help them track the sector for both common shares and preferred shares.
We’re including a quick table for the common shares that will be shown in our tables:
| Type of REIT or BDC |
| Residential Agency |
| Residential Hybrid |
| Residential Originator and Servicer |
| Commercial |
| BDC |
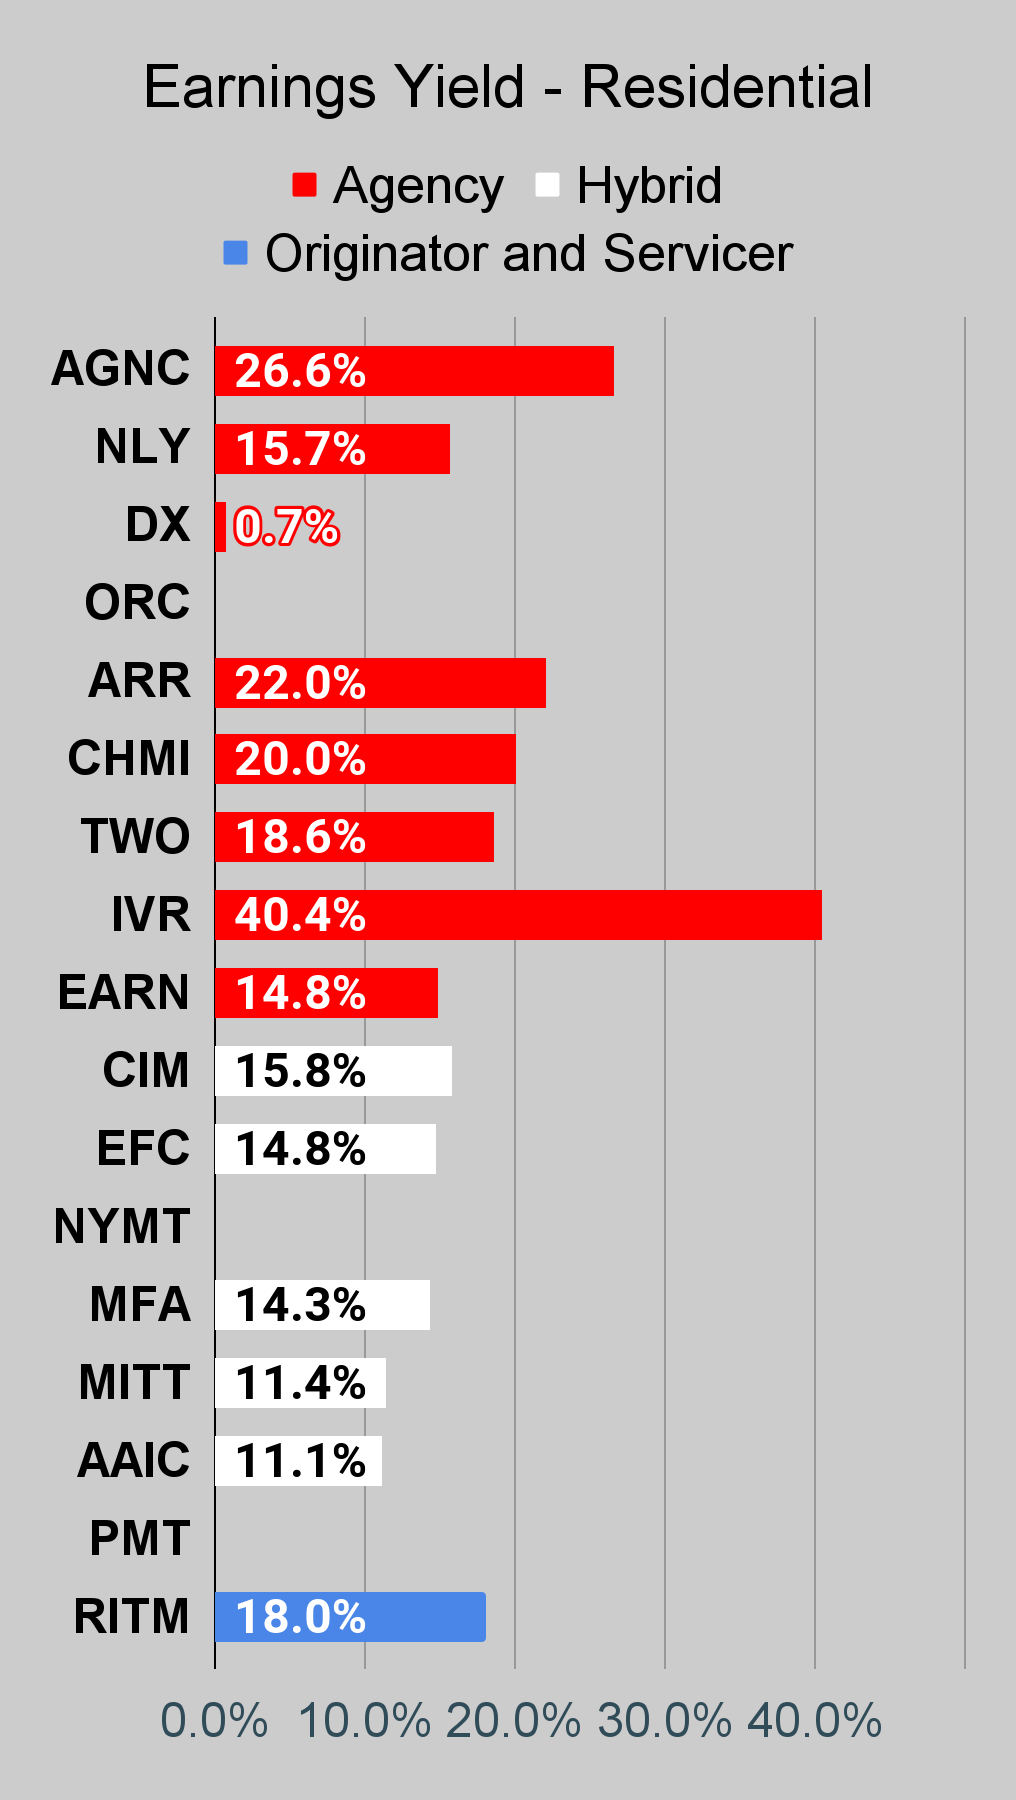
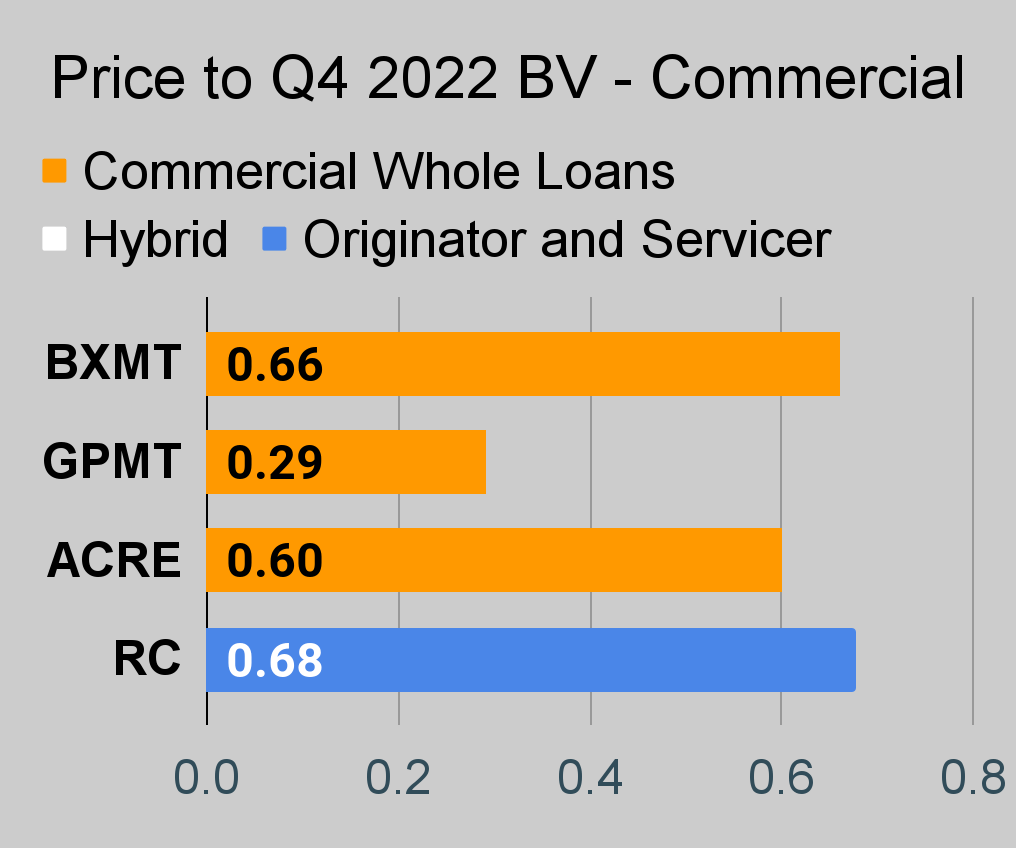
If you’re looking for a stock, and I haven’t mentioned it yet, you’ll still find it in the charts below. The charts contain comparisons based on price-to-book value, dividend yields, and earnings yield. You won’t find these tables anywhere else.
For mortgage REITs, please look at the charts for AGNC, NLY, DX, ORC, ARR, CHMI, TWO, IVR, EARN, CIM, EFC, NYMT, MFA, MITT, AAIC, PMT, RITM, BXMT, GPMT, WMC, and RC.
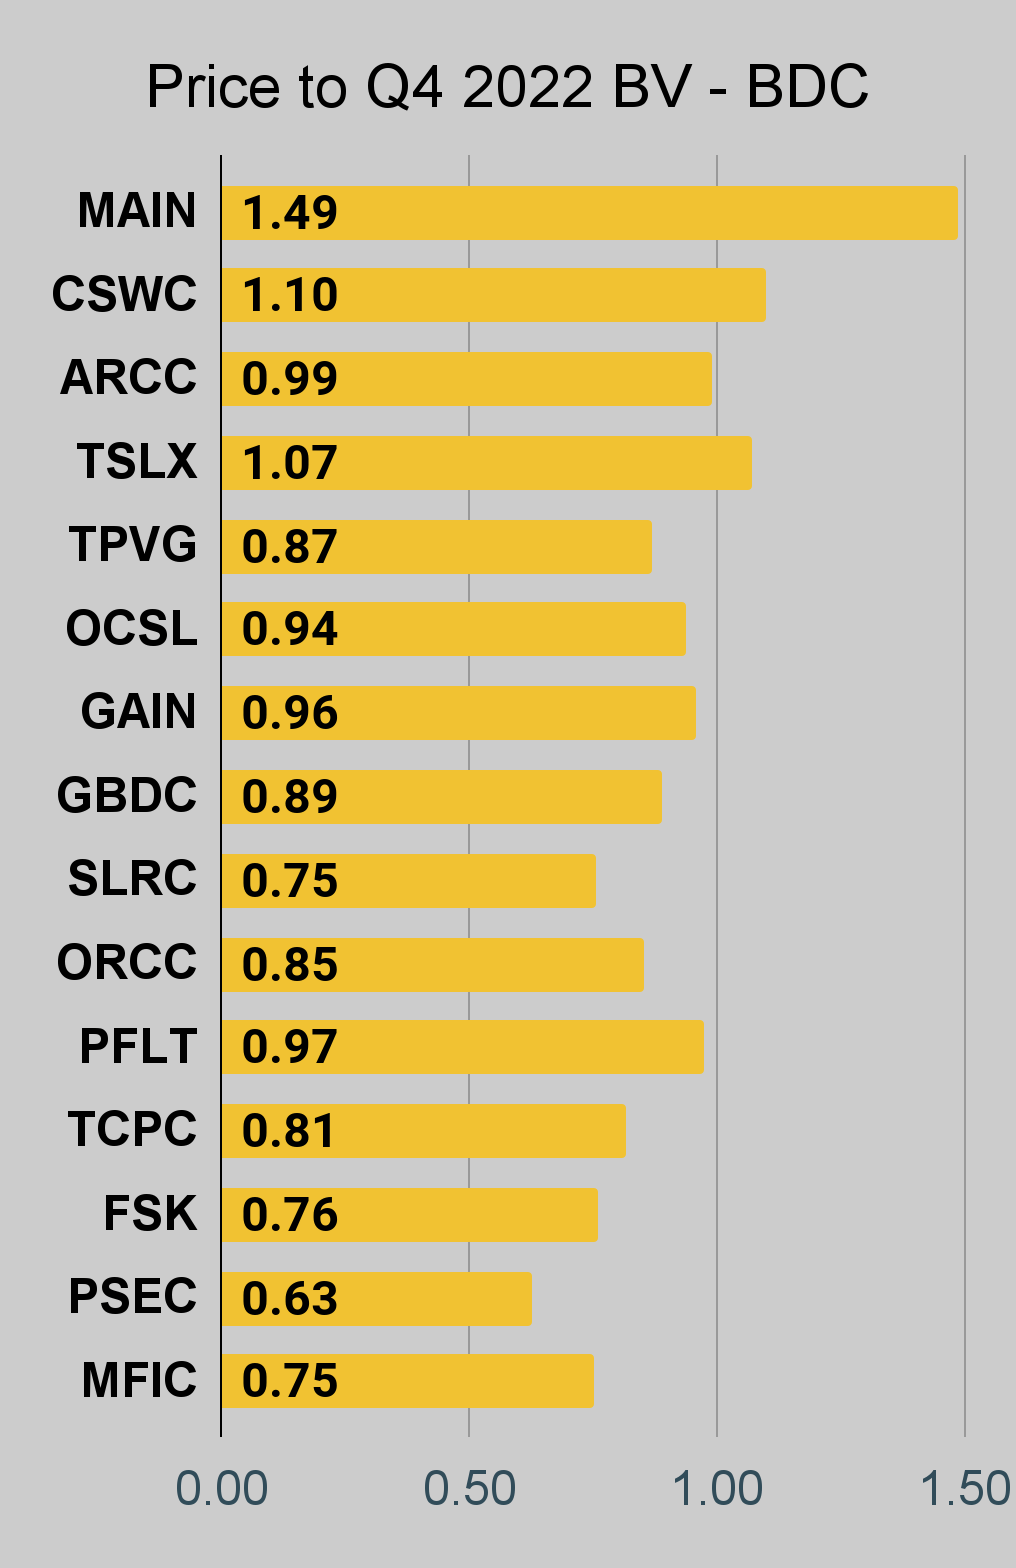
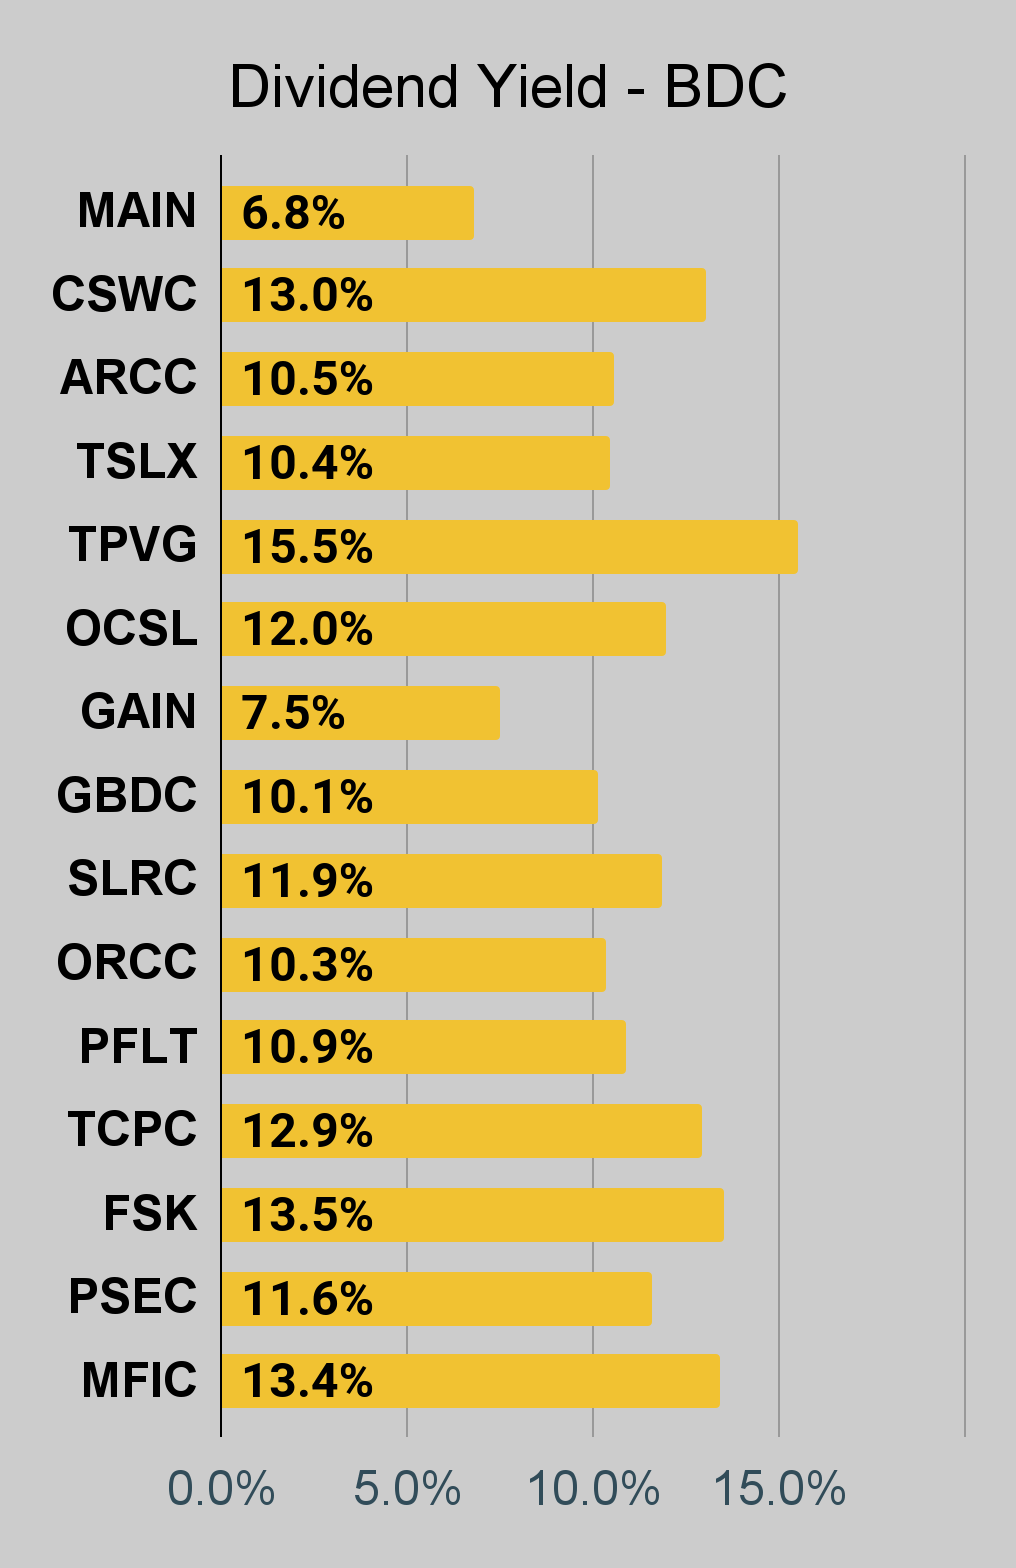
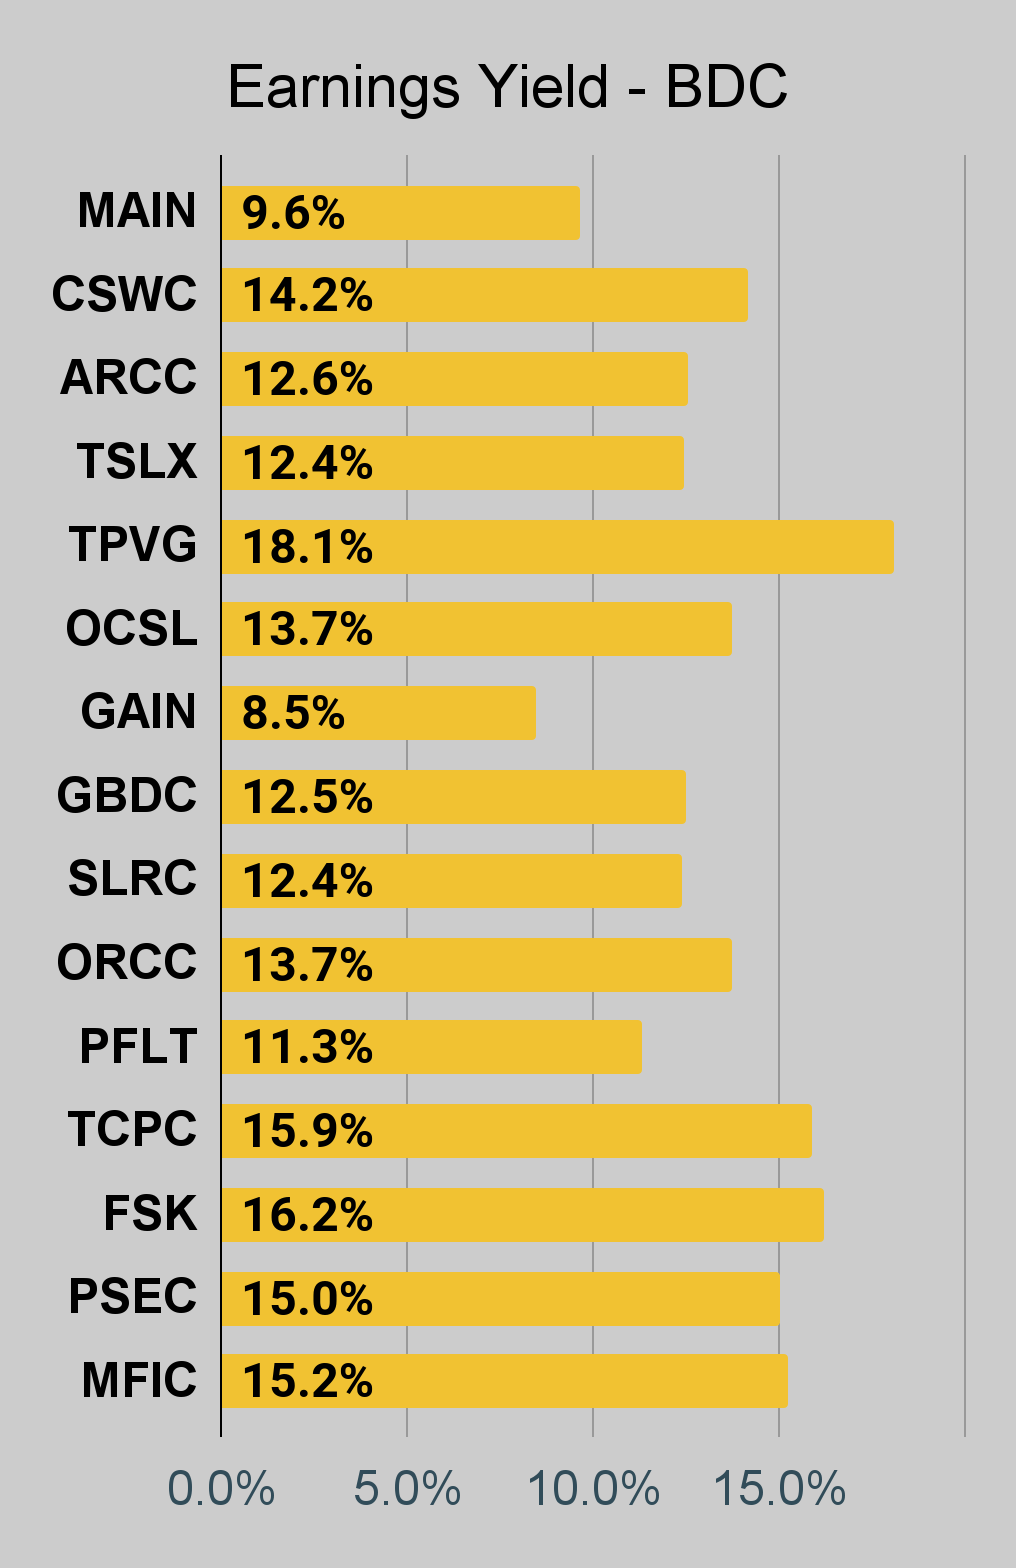
For BDCs, please look at the charts for MAIN, CSWC, ARCC, TSLX, TPVG, OCSL, GAIN, GBDC, SLRC, ORCC, PFLT, TCPC, FSK, PSEC, and MFIC.
This series is the easiest place to find charts providing up-to-date comparisons across the sector.
Residential Mortgage REIT Charts
Note: The chart for our public articles uses the book value per share from the latest earnings release. Current estimated book value per share is used in reaching our targets and trading decisions. It's available in our service, but those estimates are not included in the charts below. PMT and NYMT are not showing an earnings yield metric as neither REIT provides a quarterly “core EPS” metric.
Second Note: Due to the way historical amortized cost and hedging is factored into the earnings metrics, it's possible for two mortgage REITs with similar portfolios to post materially different metrics for earnings. I would be very cautious about putting much emphasis on the consensus analyst estimate (which is used to determine the earnings yield). In particular, throughout late 2022, the earnings metric became less comparable for many REITs.
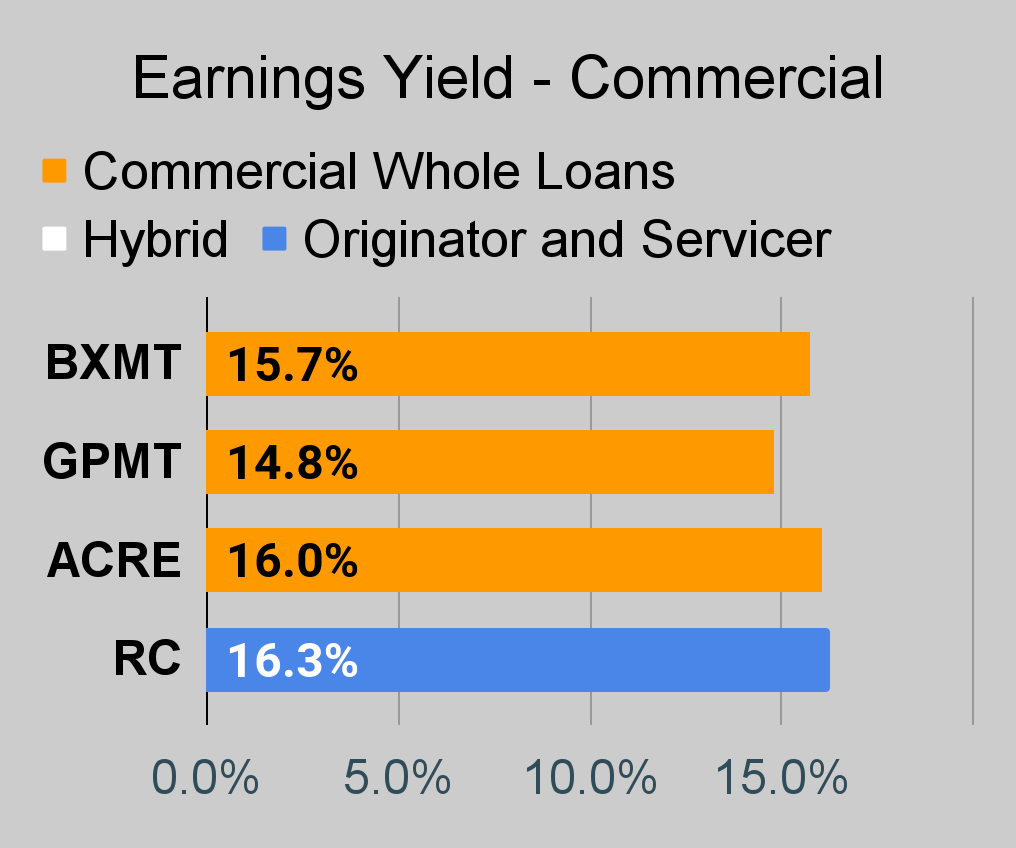
Commercial Mortgage REIT Charts
BDC Charts
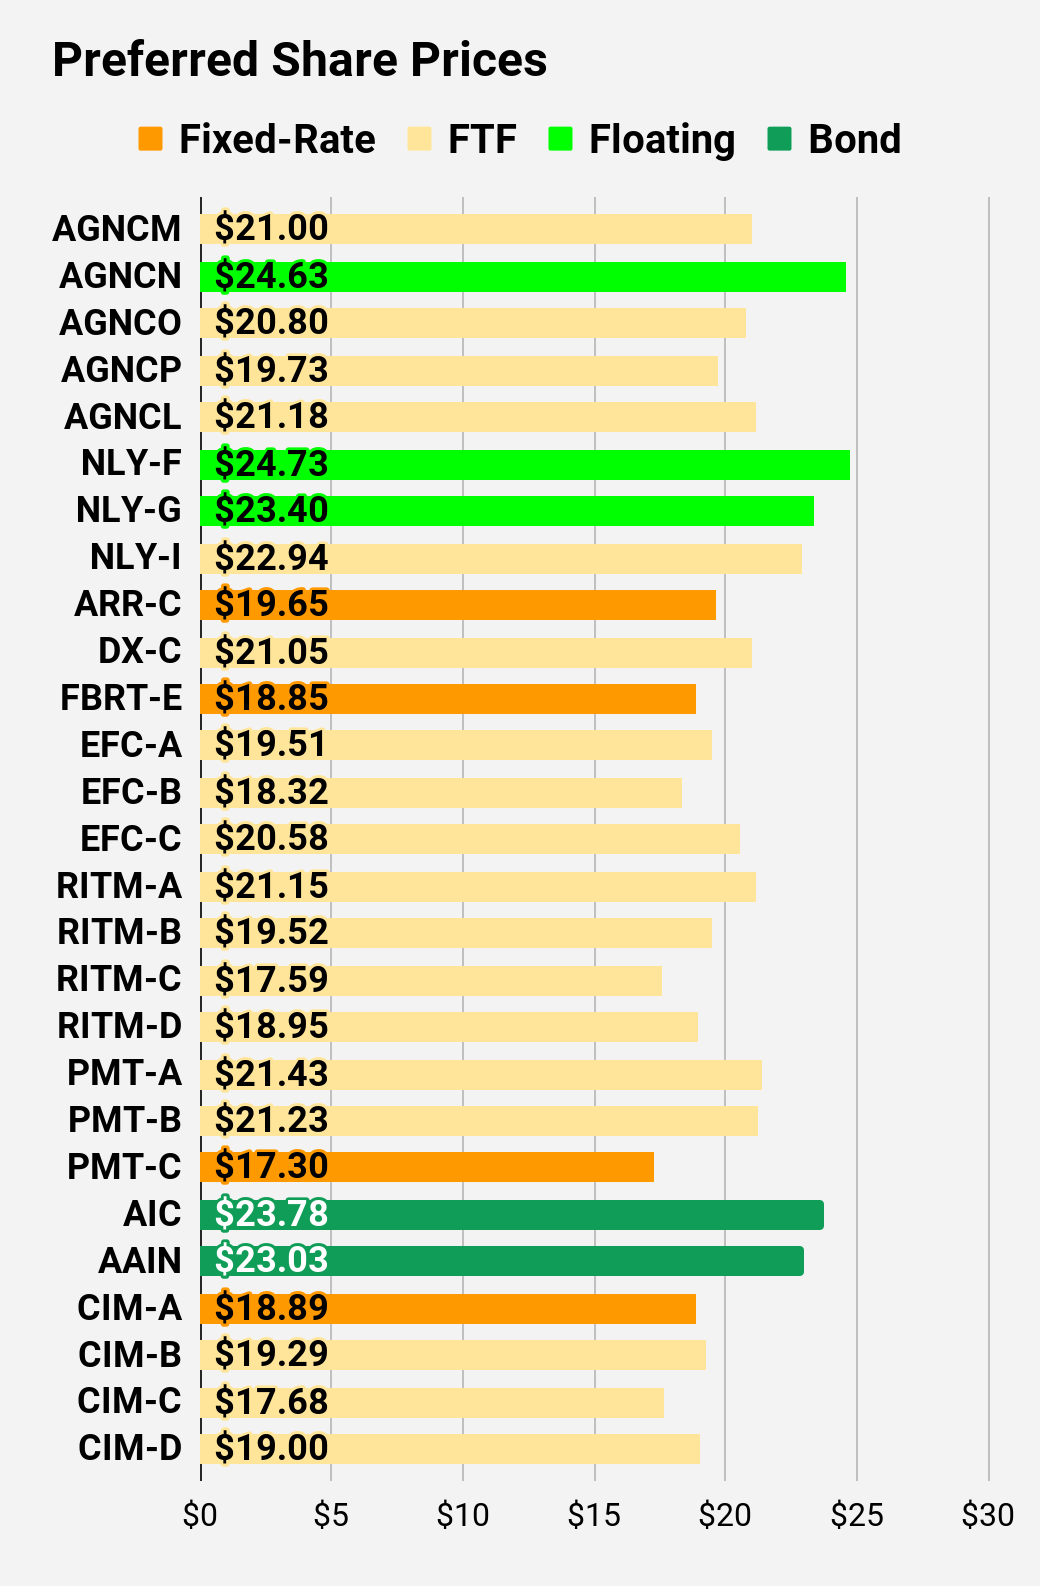
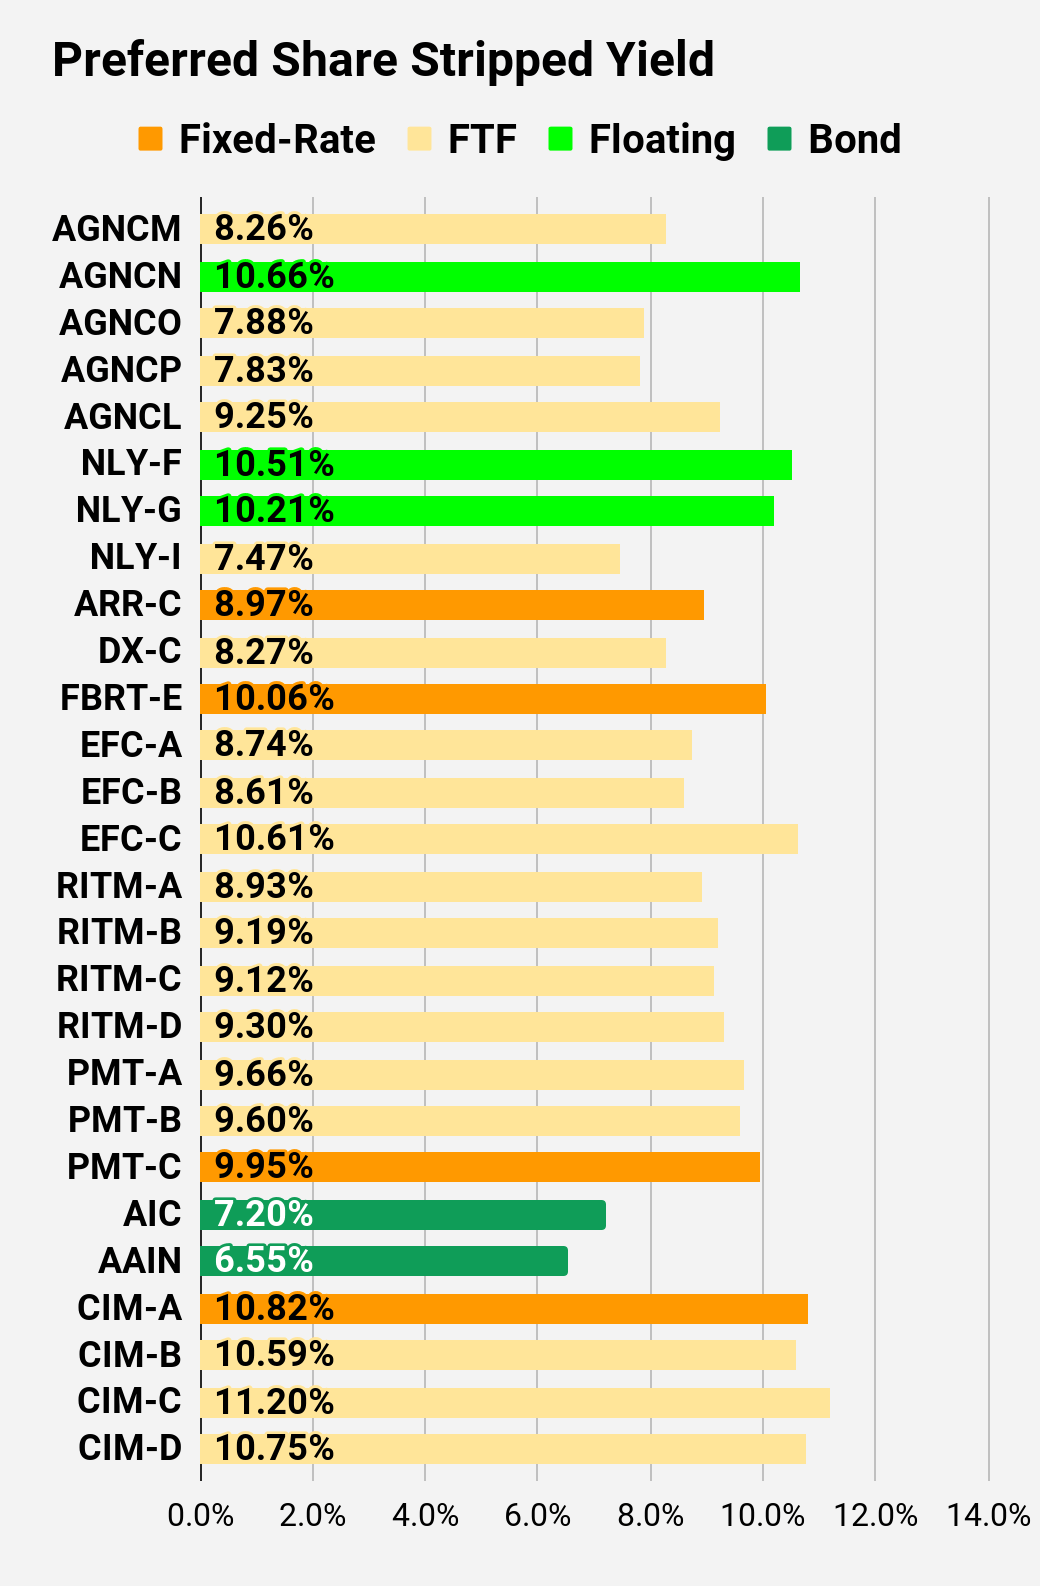
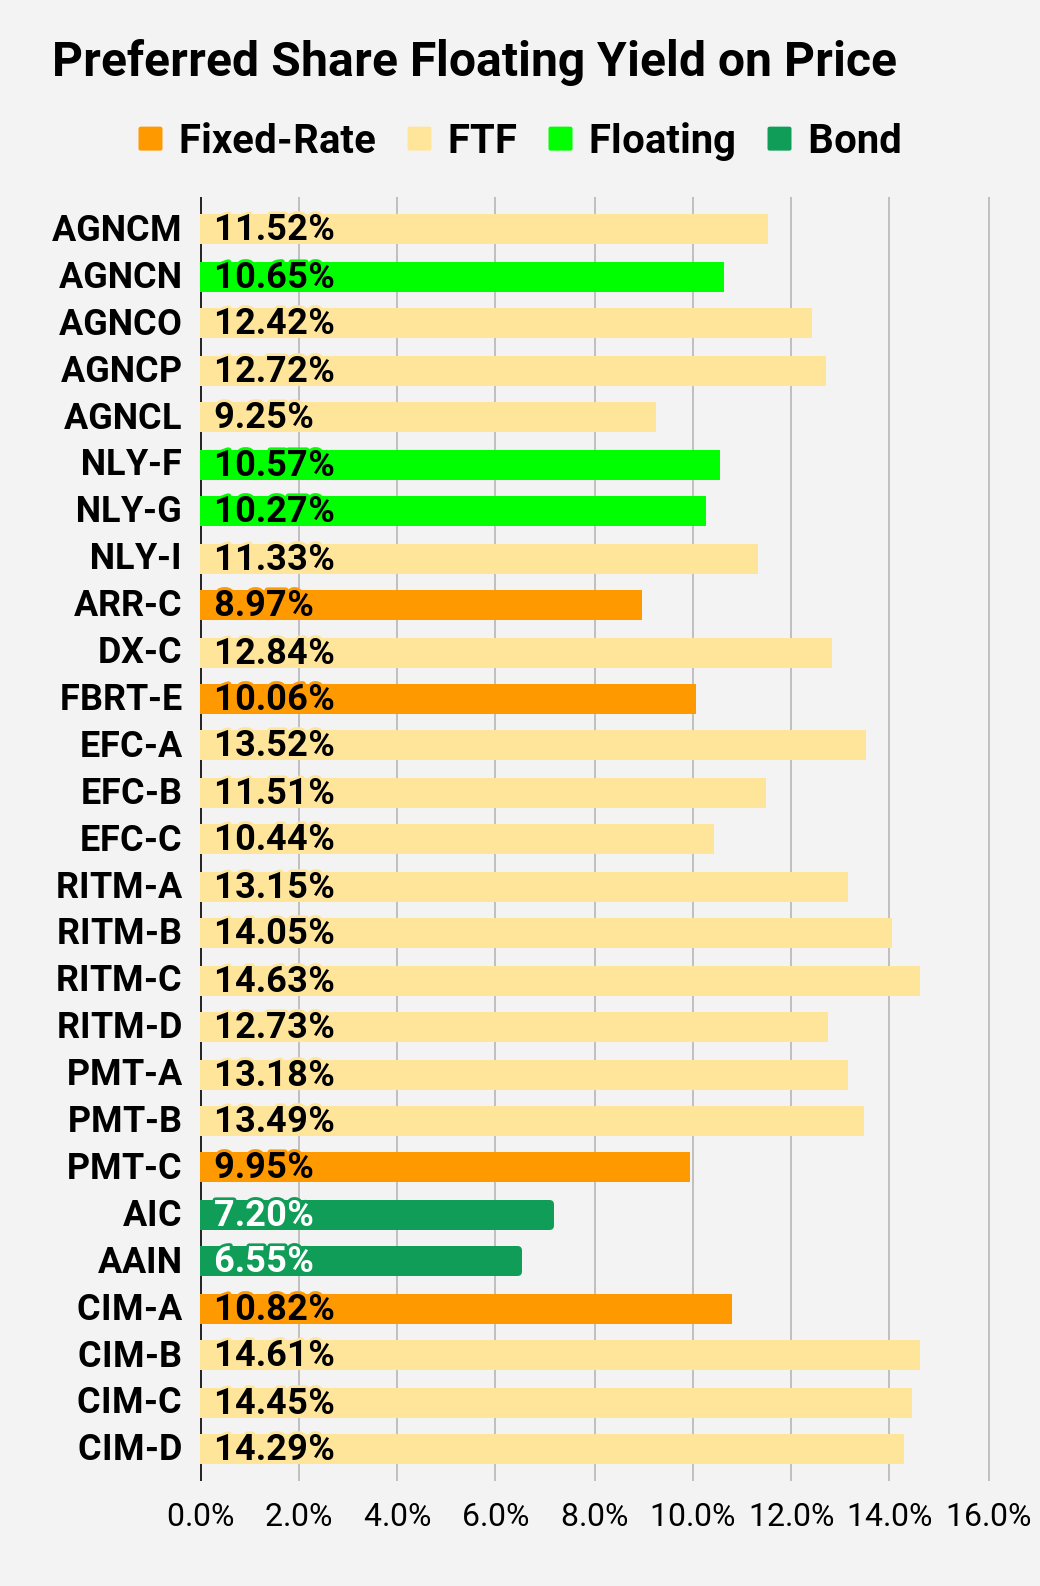
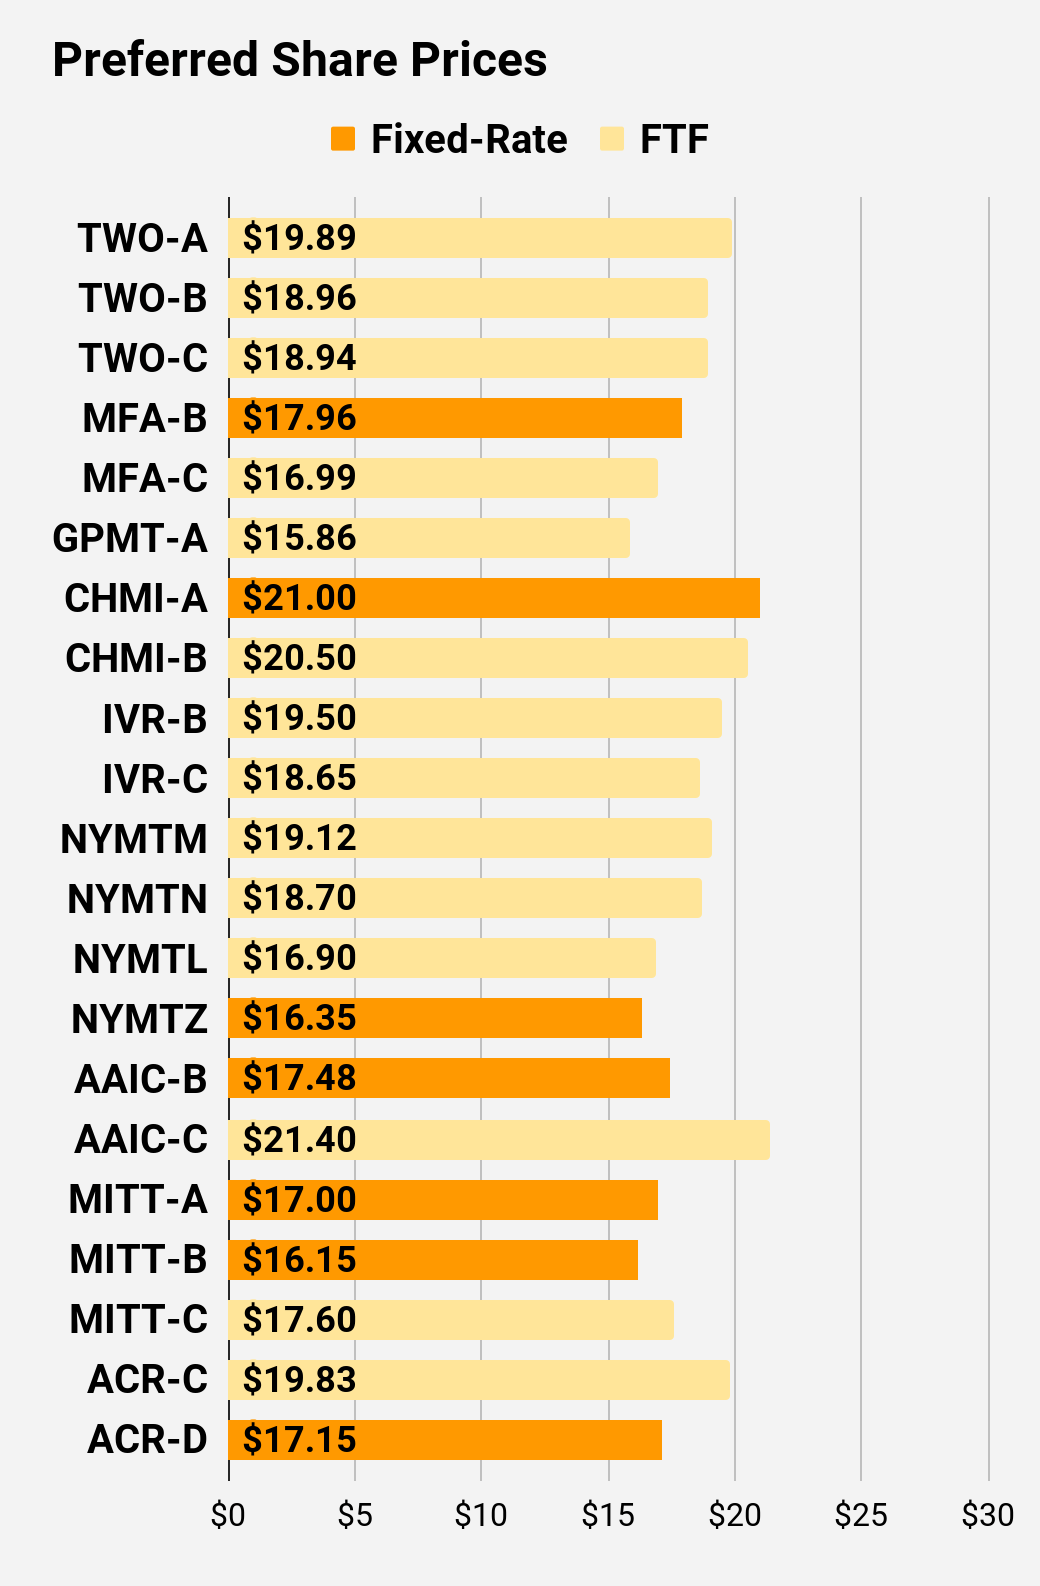
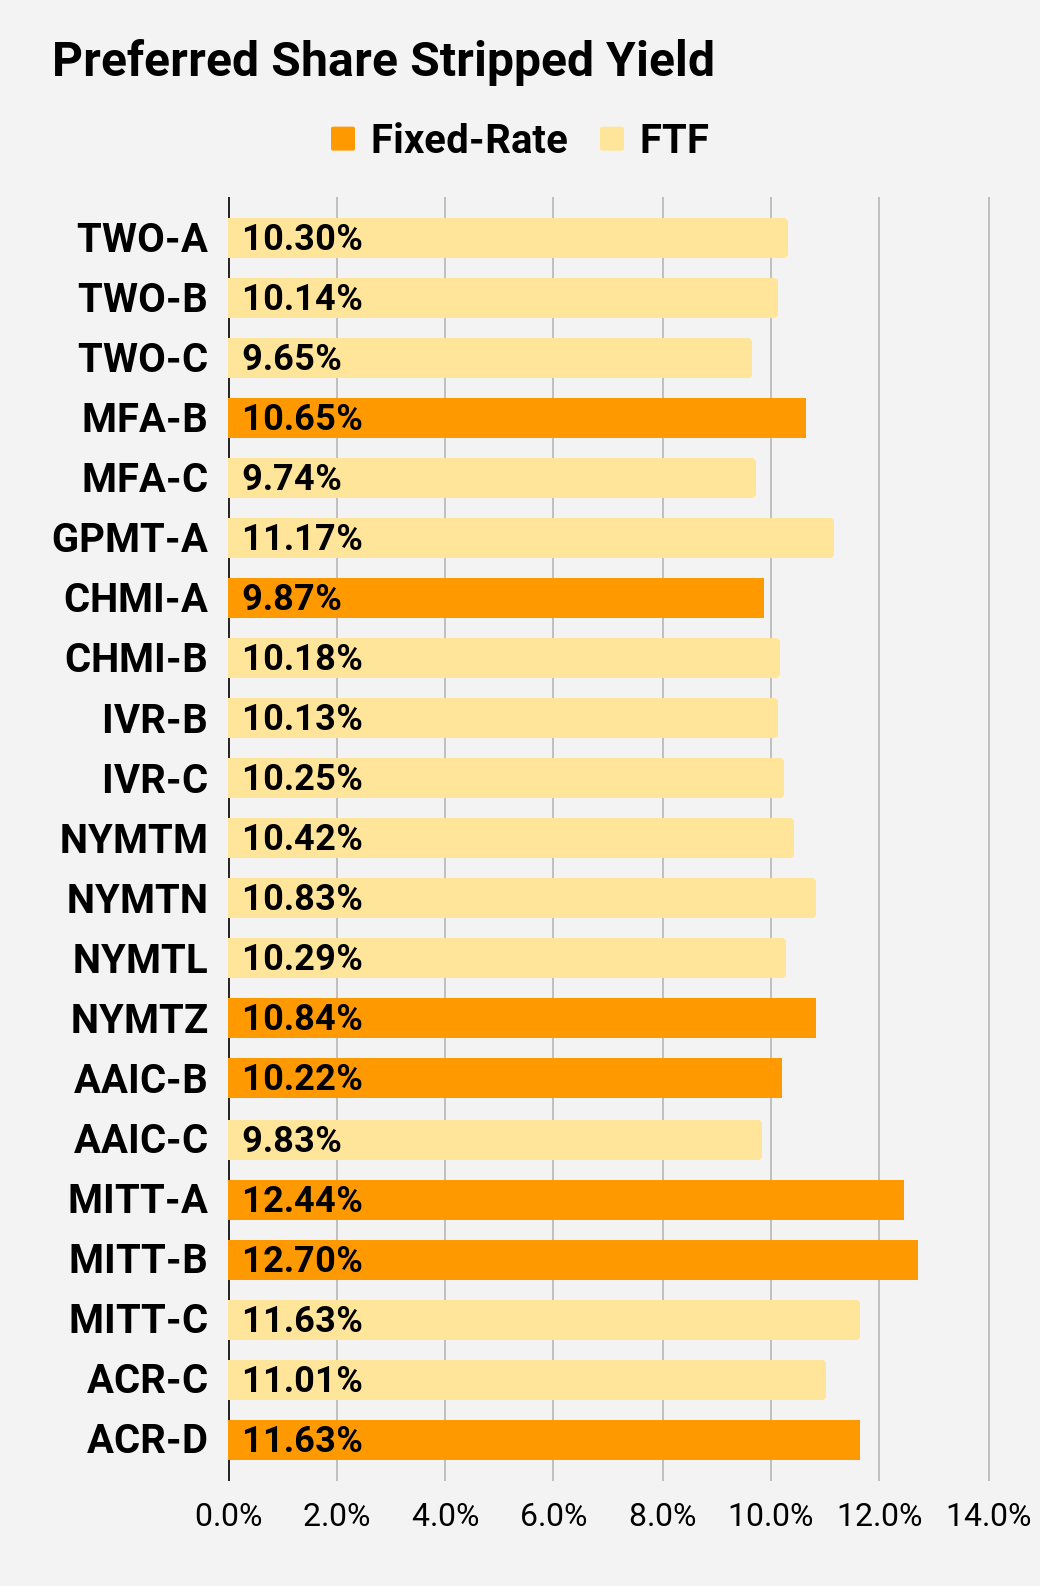
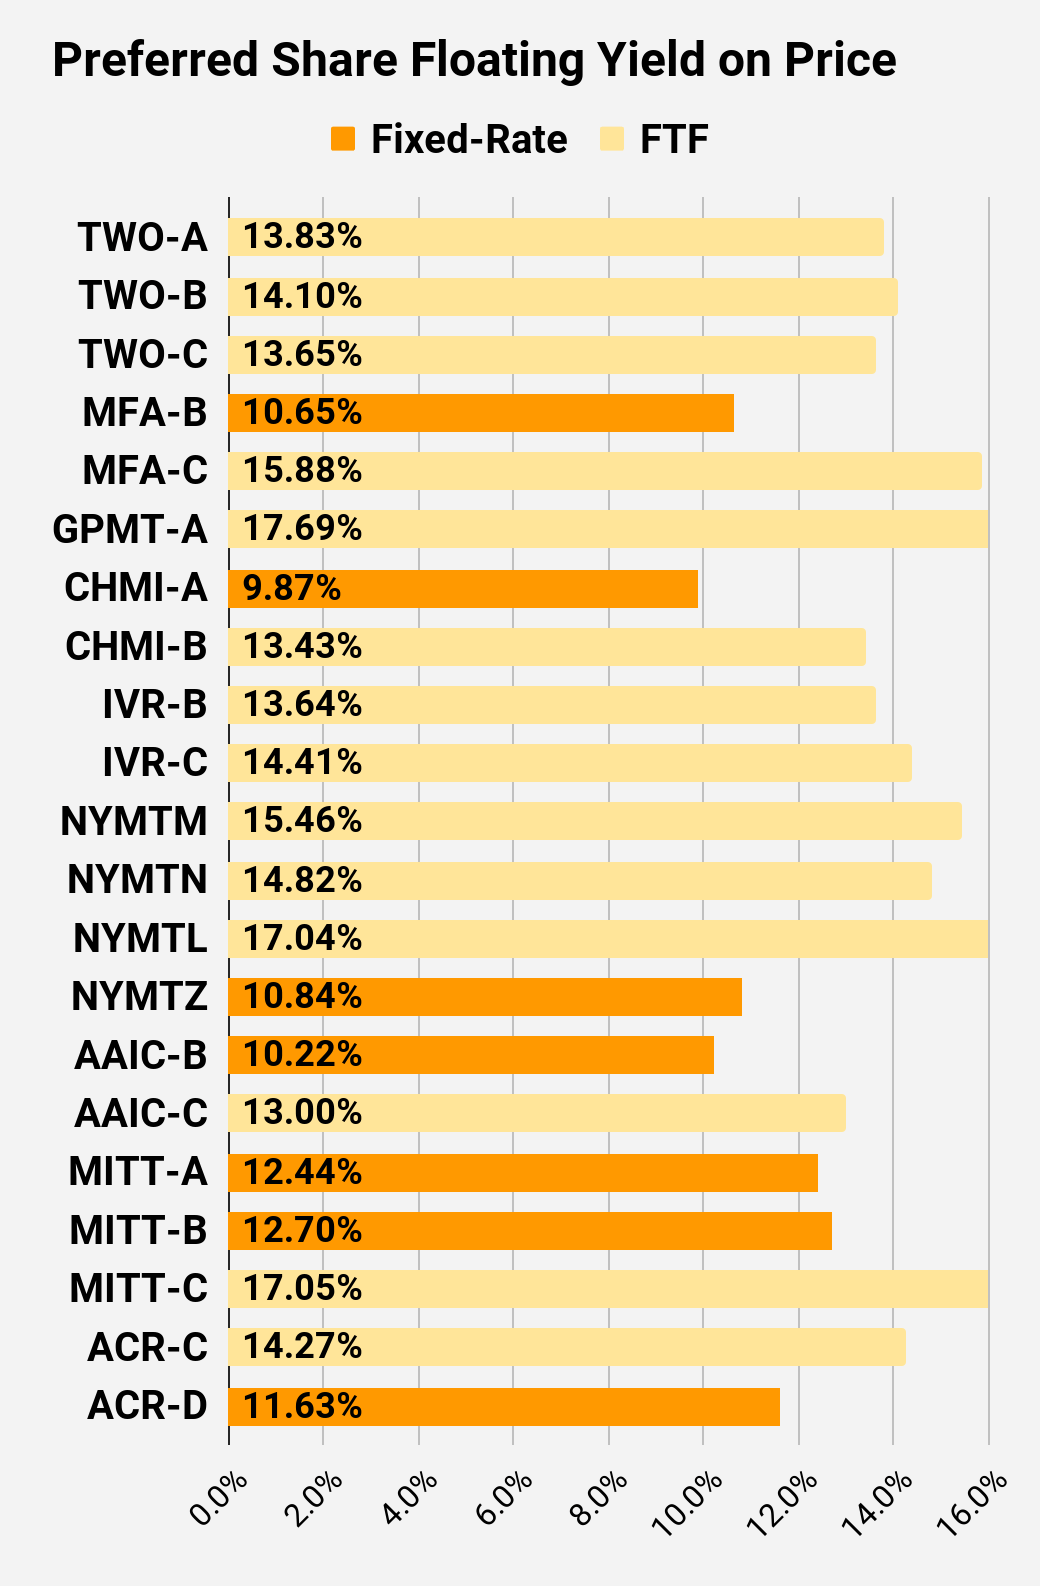
Preferred Share Charts
I changed the coloring a bit. We needed to adjust to include that the first fixed-to-floating shares have transitioned over to floating rates. When a share is already floating, the stripped yield may be different from the “Floating Yield on Price” due to changes in interest rates. For instance, NLY-F already has a floating rate. However, the rate is only reset once per three months. The stripped yield is calculated using the upcoming projected dividend payment and the “Floating Yield on Price” is based on where the dividend would be if the rate reset today. In my opinion, for these shares, the “Floating Yield on Price” is clearly the more important metric.
Preferred Share Data
Beyond the charts, we’re also providing our readers with access to several other metrics for the preferred shares.
After testing out a series on preferred shares, we decided to try merging it into the series on common shares. After all, we're still talking about positions in mortgage REITs. We don’t have any desire to cover preferred shares without cumulative dividends, so any preferred shares you see in our column will have cumulative dividends. You can verify that by using Quantum Online. We’ve included the links in the table below.
To better organize the table, we needed to abbreviate column names as follows:
- Price = Recent Share Price - Shown in Charts
- BoF = Bond or FTF (Fixed-to-Floating)
- S-Yield = Stripped Yield - Shown in Charts
- Coupon = Initial Fixed-Rate Coupon
- FYoP = Floating Yield on Price - Shown in Charts
- NCD = Next Call Date (the soonest shares could be called)
- Note: For all FTF issues, the floating rate would start on NCD.
- WCC = Worst Cash to Call (lowest net cash return possible from a call)
- QO Link = Link to Quantum Online Page
| Ticker |
| Price |
| BoF |
| S-Yield |
| Coupon |
| FYoP |
| NCD |
| WCC |
| QO Link |
| P-Link |
| $21.66 |
| FTF |
| 7.98% |
| 6.88% |
| 11.13% |
| 4/15/2024 |
| $5.07 |
| $24.68 |
| Floating |
| 10.59% |
| 10.37% |
| 10.58% |
| 5/27/2023 |
| $0.63 |
| $21.34 |
| FTF |
| 7.66% |
| 6.50% |
| 12.07% |
| 10/15/2024 |
| $6.11 |
| $20.28 |
| FTF |
| 7.60% |
| 6.13% |
| 12.33% |
| 4/15/2025 |
| $7.79 |
| $21.50 |
| FTF |
| 9.08% |
| 7.75% |
| 9.36% |
| 10/15/2027 |
| $12.23 |
| $24.93 |
| Floating |
| 10.38% |
| 10.18% |
| 10.44% |
| 5/27/2023 |
| $0.48 |
| $24.00 |
| Floating |
| 9.91% |
| 9.36% |
| 9.97% |
| 5/27/2023 |
| $1.37 |
| $23.70 |
| FTF |
| 7.20% |
| 6.75% |
| 10.93% |
| 6/30/2024 |
| $3.42 |
| $20.02 |
| 8.77% |
| 7.00% |
| 8.77% |
| 1/28/2025 |
| $8.05 |
| $21.53 |
| FTF |
| 8.06% |
| 6.90% |
| 12.52% |
| 4/15/2025 |
| $6.92 |
| $18.69 |
| 10.11% |
| 7.50% |
| 10.11% |
| 5/27/2023 |
| $6.52 |
| $19.84 |
| FTF |
| 8.56% |
| 6.75% |
| 13.25% |
| 10/30/2024 |
| $7.70 |
| $19.74 |
| FTF |
| 7.96% |
| 6.25% |
| 10.95% |
| 1/30/2027 |
| $11.13 |
| $21.65 |
| FTF |
| 10.04% |
| 8.63% |
| 10.16% |
| 4/30/2028 |
| $14.15 |
| $21.10 |
| FTF |
| 8.92% |
| 7.50% |
| 13.14% |
| 8/15/2024 |
| $6.26 |
| $20.25 |
| FTF |
| 8.83% |
| 7.13% |
| 13.49% |
| 8/15/2024 |
| $6.99 |
| $18.00 |
| FTF |
| 8.88% |
| 6.38% |
| 14.24% |
| 2/15/2025 |
| $9.81 |
| $19.31 |
| FTF |
| 9.09% |
| 7.00% |
| 12.77% |
| 11/15/2026 |
| $11.84 |
| $22.91 |
| FTF |
| 8.99% |
| 8.13% |
| 12.27% |
| 3/15/2024 |
| $4.13 |
| $22.50 |
| FTF |
| 9.02% |
| 8.00% |
| 12.67% |
| 6/15/2024 |
| $5.01 |
| $17.90 |
| 9.57% |
| 6.75% |
| 9.57% |
| 8/24/2026 |
| $12.92 |
| $23.90 |
| Bond |
| 7.14% |
| 6.75% |
| 7.14% |
| 5/27/2023 |
| $1.43 |
| $22.97 |
| Bond |
| 6.55% |
| 6.00% |
| 6.55% |
| 8/1/2023 |
| $2.40 |
| $19.81 |
| 10.26% |
| 8.00% |
| 10.26% |
| 5/27/2023 |
| $5.59 |
| $20.10 |
| FTF |
| 10.11% |
| 8.00% |
| 13.96% |
| 3/30/2024 |
| $6.99 |
| $18.82 |
| FTF |
| 10.47% |
| 7.75% |
| 13.50% |
| 9/30/2025 |
| $11.12 |
| $19.93 |
| FTF |
| 10.20% |
| 8.00% |
| 13.55% |
| 03/30/2024 |
| $7.16 |
Second Batch:
| Ticker |
| Price |
| BoF |
| S-Yield |
| Coupon |
| FYoP |
| NCD |
| WCC |
| QO Link |
| P-Link |
| $19.79 |
| FTF |
| 10.31% |
| 8.13% |
| 13.85% |
| 04/27/2027 |
| $13.33 |
| $18.75 |
| FTF |
| 10.21% |
| 7.63% |
| 14.20% |
| 07/27/2027 |
| $14.35 |
| $18.64 |
| FTF |
| 9.77% |
| 7.25% |
| 13.82% |
| 1/27/2025 |
| $9.54 |
| $18.45 |
| 10.32% |
| 7.50% |
| 10.32% |
| 5/27/2023 |
| $6.84 |
| $17.77 |
| FTF |
| 9.27% |
| 6.50% |
| 15.12% |
| 3/31/2025 |
| $10.49 |
| $16.89 |
| FTF |
| 10.44% |
| 7.00% |
| 16.53% |
| 11/30/2026 |
| $14.44 |
| $21.63 |
| 9.55% |
| 8.20% |
| 9.55% |
| 5/27/2023 |
| $3.53 |
| $21.74 |
| FTF |
| 9.56% |
| 8.25% |
| 12.61% |
| 4/15/2024 |
| $5.25 |
| $20.18 |
| FTF |
| 9.75% |
| 7.75% |
| 13.12% |
| 12/27/2024 |
| $8.24 |
| $19.18 |
| FTF |
| 9.93% |
| 7.50% |
| 13.95% |
| 9/27/2027 |
| $14.29 |
| $20.00 |
| FTF |
| 9.92% |
| 7.88% |
| 14.71% |
| 1/15/2025 |
| $8.45 |
| $19.58 |
| FTF |
| 10.30% |
| 8.00% |
| 14.09% |
| 10/15/2027 |
| $14.42 |
| $17.66 |
| FTF |
| 9.81% |
| 6.88% |
| 16.23% |
| 10/15/2026 |
| $13.36 |
| $17.20 |
| 10.26% |
| 7.00% |
| 10.26% |
| 1/15/2027 |
| $14.37 |
| $19.00 |
| 9.35% |
| 7.00% |
| 9.35% |
| 5/27/2023 |
| $6.28 |
| $21.00 |
| FTF |
| 9.98% |
| 8.25% |
| 13.20% |
| 3/30/2024 |
| $6.07 |
| $17.38 |
| 12.10% |
| 8.25% |
| 12.10% |
| 5/27/2023 |
| $7.98 |
| $16.50 |
| 12.37% |
| 8.00% |
| 12.37% |
| 5/27/2023 |
| $8.85 |
| $17.80 |
| FTF |
| 11.45% |
| 8.00% |
| 16.78% |
| 9/17/2024 |
| $10.18 |
| $20.19 |
| FTF |
| 10.77% |
| 8.63% |
| 13.95% |
| 7/30/2024 |
| $7.51 |
| $18.00 |
| 11.03% |
| 7.88% |
| 11.03% |
| 5/21/2026 |
| $13.02 |
Strategy
Our goal is to maximize total returns . We achieve those most effectively by including “trading” strategies. We regularly trade positions in the mortgage REIT common shares and BDCs because:
- Prices are inefficient.
- Long term, share prices generally revolve around book value.
- Short term, price-to-book ratios can deviate materially.
- Book value isn’t the only step in analysis, but it's the cornerstone.
We also allocate to preferred shares and equity REITs. We encourage buy-and-hold investors to consider using more preferred shares and equity REITs.
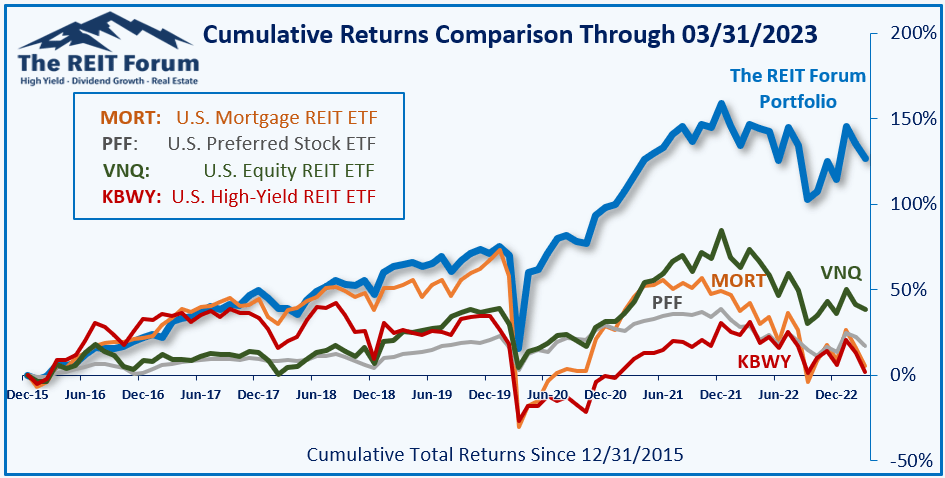
Performance
We compare our performance against four ETFs that investors might use for exposure to our sectors:
The REIT Forum
The four ETFs we use for comparison are:
| Ticker |
| Exposure |
| One of the largest mortgage REIT ETFs |
| One of the largest preferred share ETFs |
| Largest equity REIT ETF |
| The high-yield equity REIT ETF. Yes, it has been dreadful. |
When investors think it isn’t possible to earn solid returns in preferred shares or mortgage REITs, we politely disagree. The sector has plenty of opportunities, but investors still need to be wary of the risks. We can’t simply reach for yield and hope for the best. When it comes to common shares, we need to be even more vigilant to protect our principal by regularly watching prices and updating estimates for book value and price targets.
Ratings: Predicting RITM-B to outperform RITM-A. The idea of swapping RITM-A for RITM-B doesn't involve a change in risk; it just gives the investor a better valuation. Never use limit orders though. If the prices swing too far, it stops being a good idea.
I'm even going to toss out a slightly bullish view on TWO. They got whacked so hard that the price-to-book ratio came in. Not a strong buy, but I'll upgrade it to a bullish outlook. That's a big difference from the times we were trashing on shares previously. This is still a pretty high-risk idea. More potential rewards, but the preferred shares we just discussed are a lower-risk choice that still offers upside and big yields.
For further details see:
A High Yield Disaster