IVOV - A Look Inside The Inflation Numbers Says The Fed Is Done
2023-08-14 23:39:00 ET
Summary
- At some point, likely well before year-end, the Fed is going to have to concede that inflation has been licked - and lower rates accordingly.
- It's well-known that housing prices and rents stopped rising about a year ago, but owners' equivalent rent, the largest single component of the CPI is still rising, albeit at a somewhat slower rate in recent months.
- Judging by the jobs market, the economy is unlikely to do much better than 2% going forward.
- If my reading of the monetary and inflation tea leaves is correct, the Fed should begin cutting rates now, not next year.
I've long believed that the Fed and most media observers are confused about how inflation works. That's because most people are still captive to the traditional Phillips Curve model of inflation, which says that in order to tame inflation, the economy needs to suffer a significant slowdown in growth. In turn, that means that the Fed needs to be very tight for a significant period; no easing until early next year.
So the market is convinced the Fed will be on hold through at least the end of the year. But a look inside the inflation statistics suggests that is likely to be unnecessary; inflation is very likely to continue to decline in the months to come. At some point, likely well before year-end, the Fed is going to have to concede that inflation has been licked - and lower rates accordingly.
And now for some charts:
Chart #1
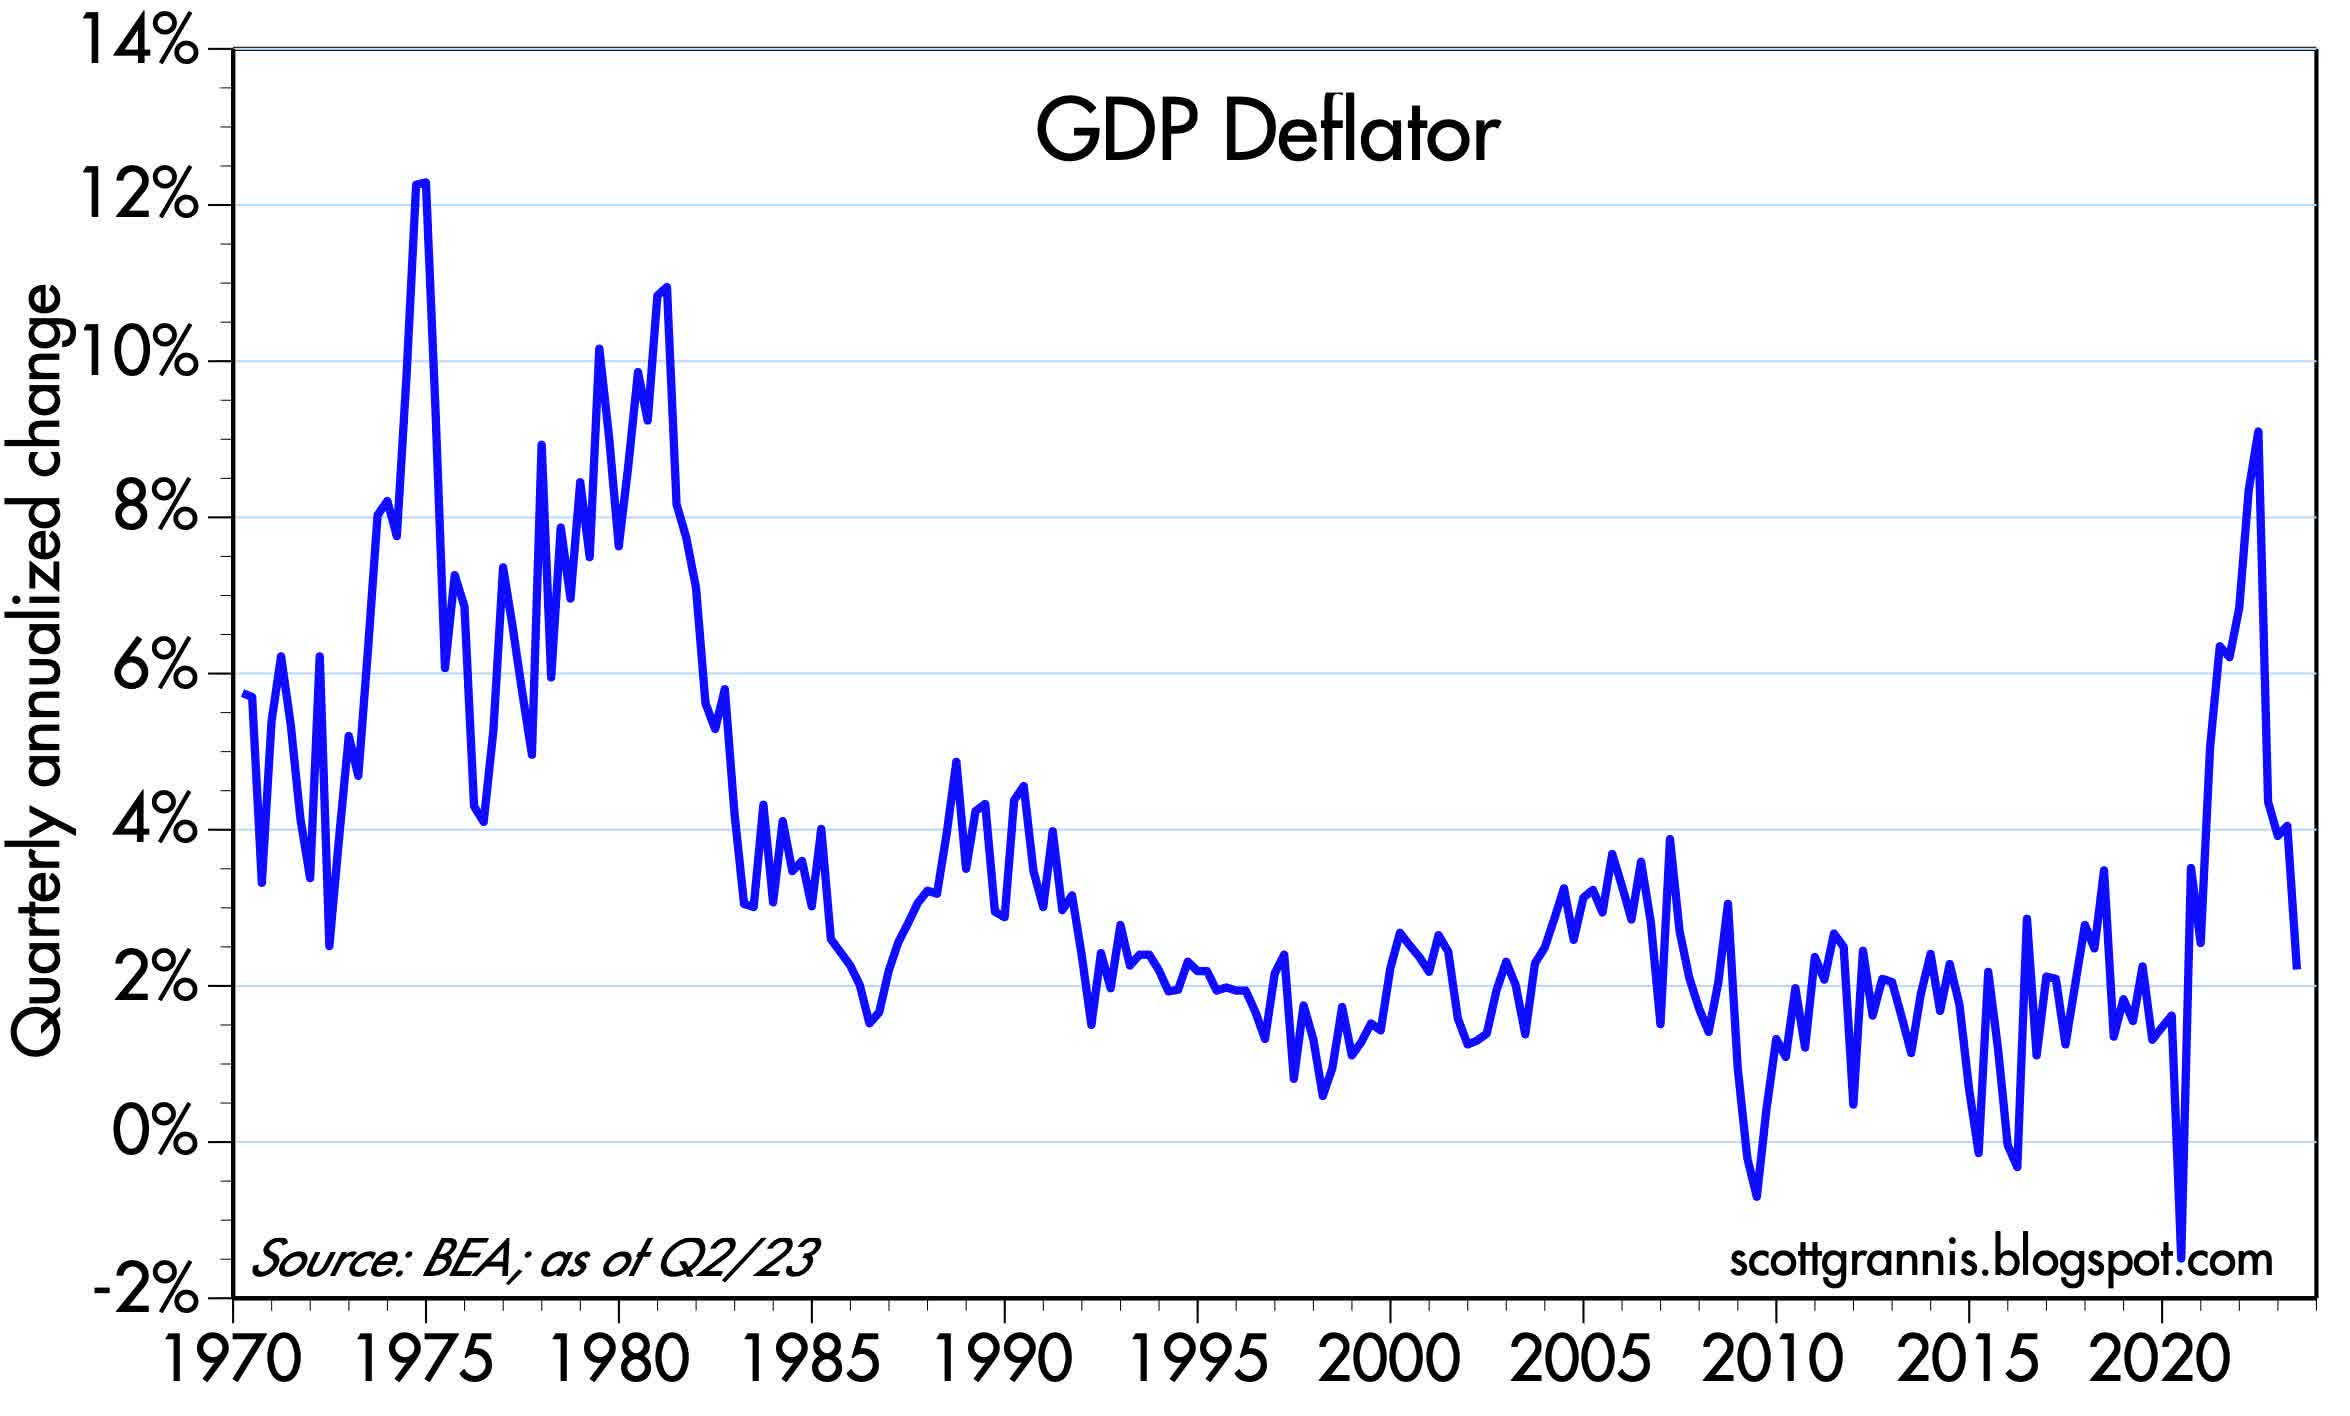
Chart #1 shows the quarterly annualized rate of inflation according to the GDP deflator. This is the broadest and most inclusive measure of inflation that we have. In the second quarter prices throughout the economy rose at a mere 2.2% annualized rate - exactly in line with the Fed's target. Why is no one else talking about this? To me, it's abundantly clear that inflation is yesterday's news. Inflation is more likely to decline further than it is to rise.
Chart #2
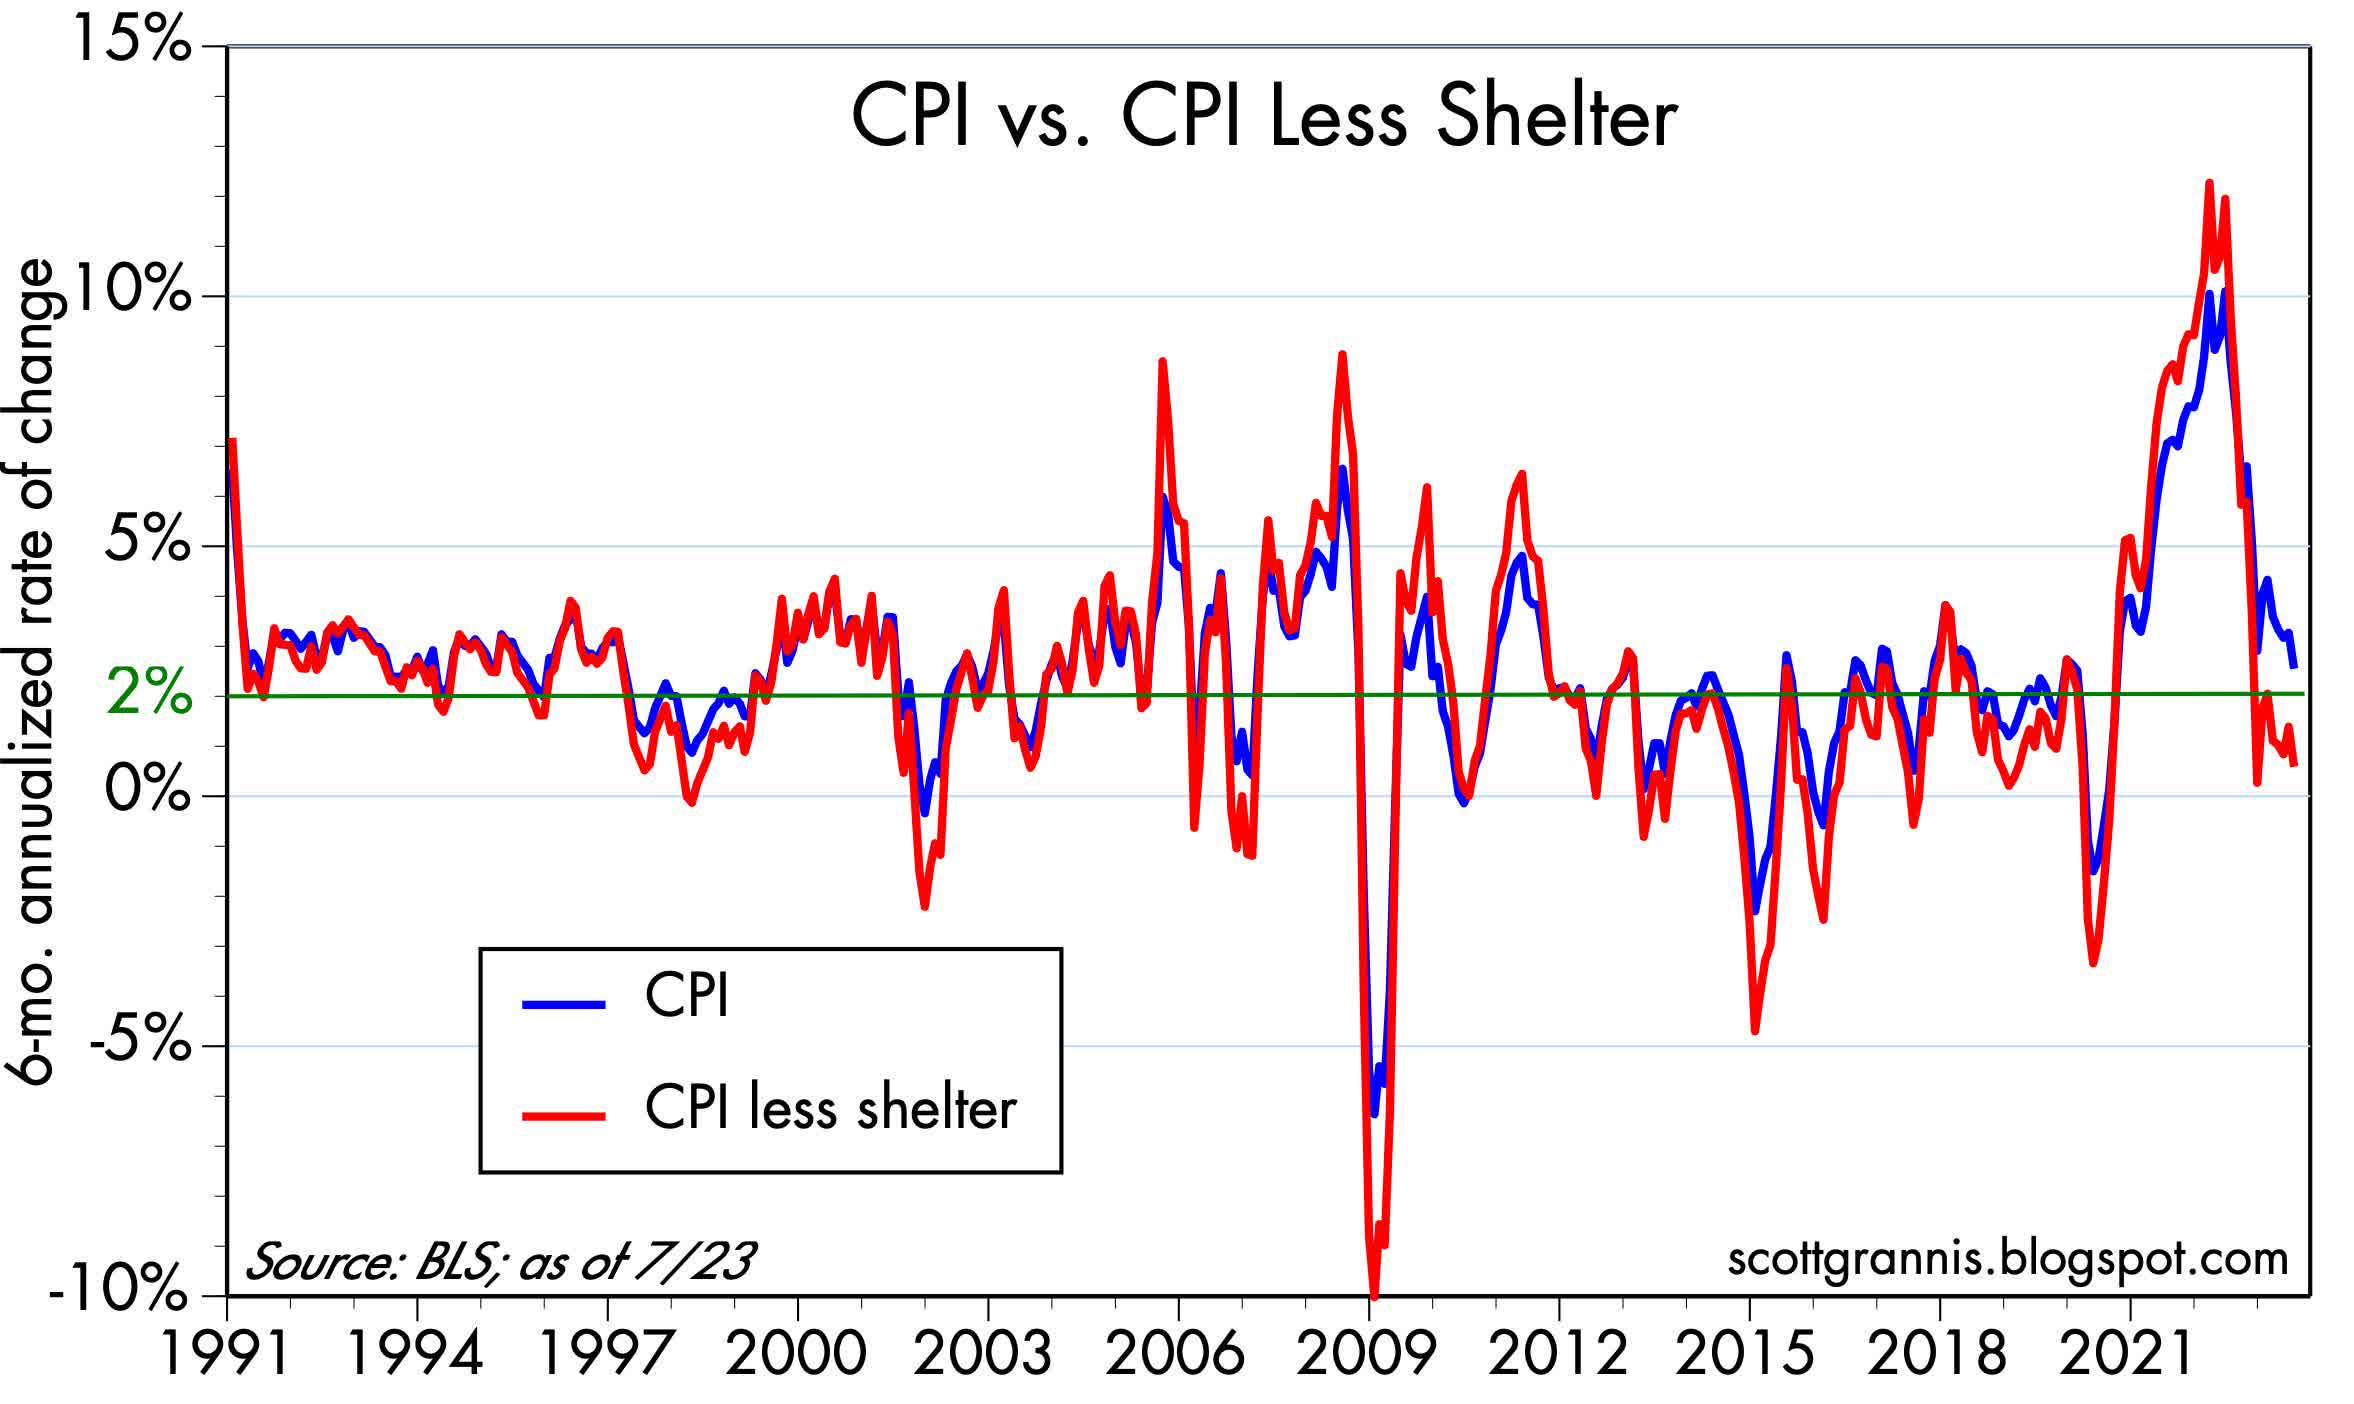
Chart #2 looks at the 6-mo. annualized growth of the Consumer Price Index with and without shelter costs, the latter of which comprise over one-third of the total. I've been highlighting this for a long time: shelter costs are notorious for measuring housing prices and rents with a lag of one year or more. Absent shelter costs, the CPI over the past six months is up at a teeny-tiny annualized rate of only 0.6%! Including shelter costs, the CPI over the past six months is up at a 2.6% annualized rate, which is only slightly above the Fed's 2% target. (Actually, the Fed is targeting 2% for the PCE deflator, which is equivalent to about a 2.5% CPI.) Why all the anguish about inflation "still running hot?"
Chart #3
Chart #4
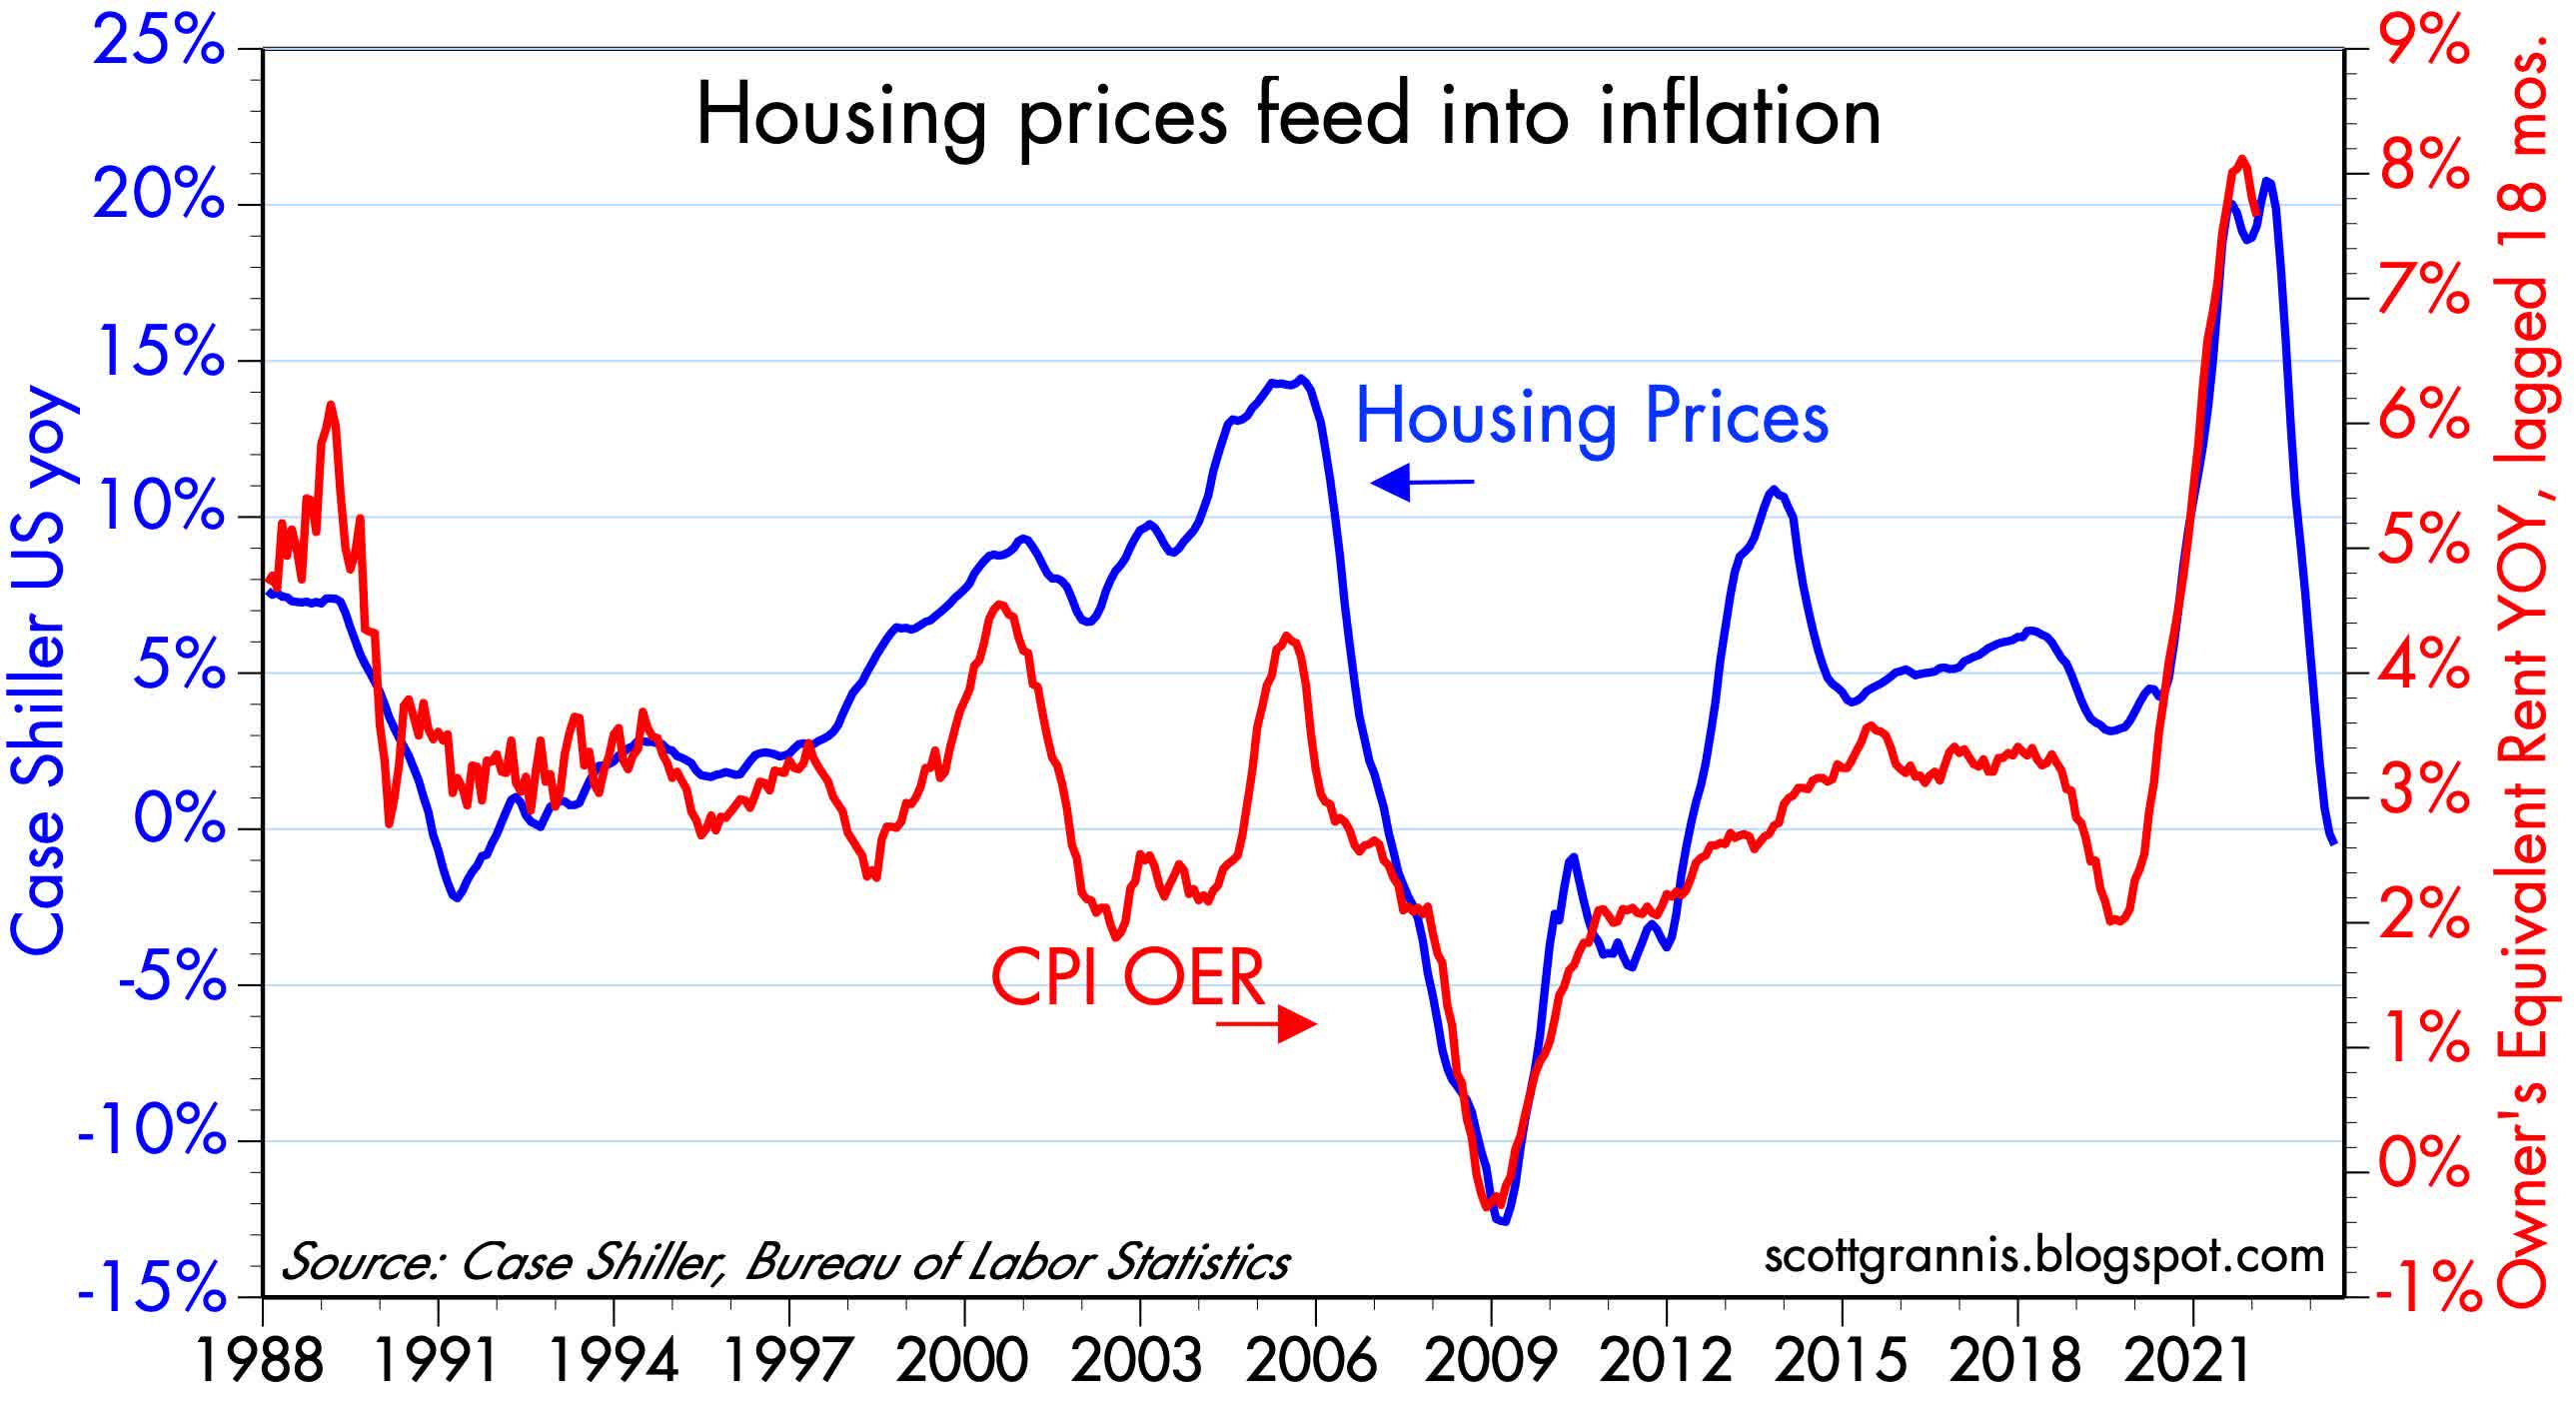
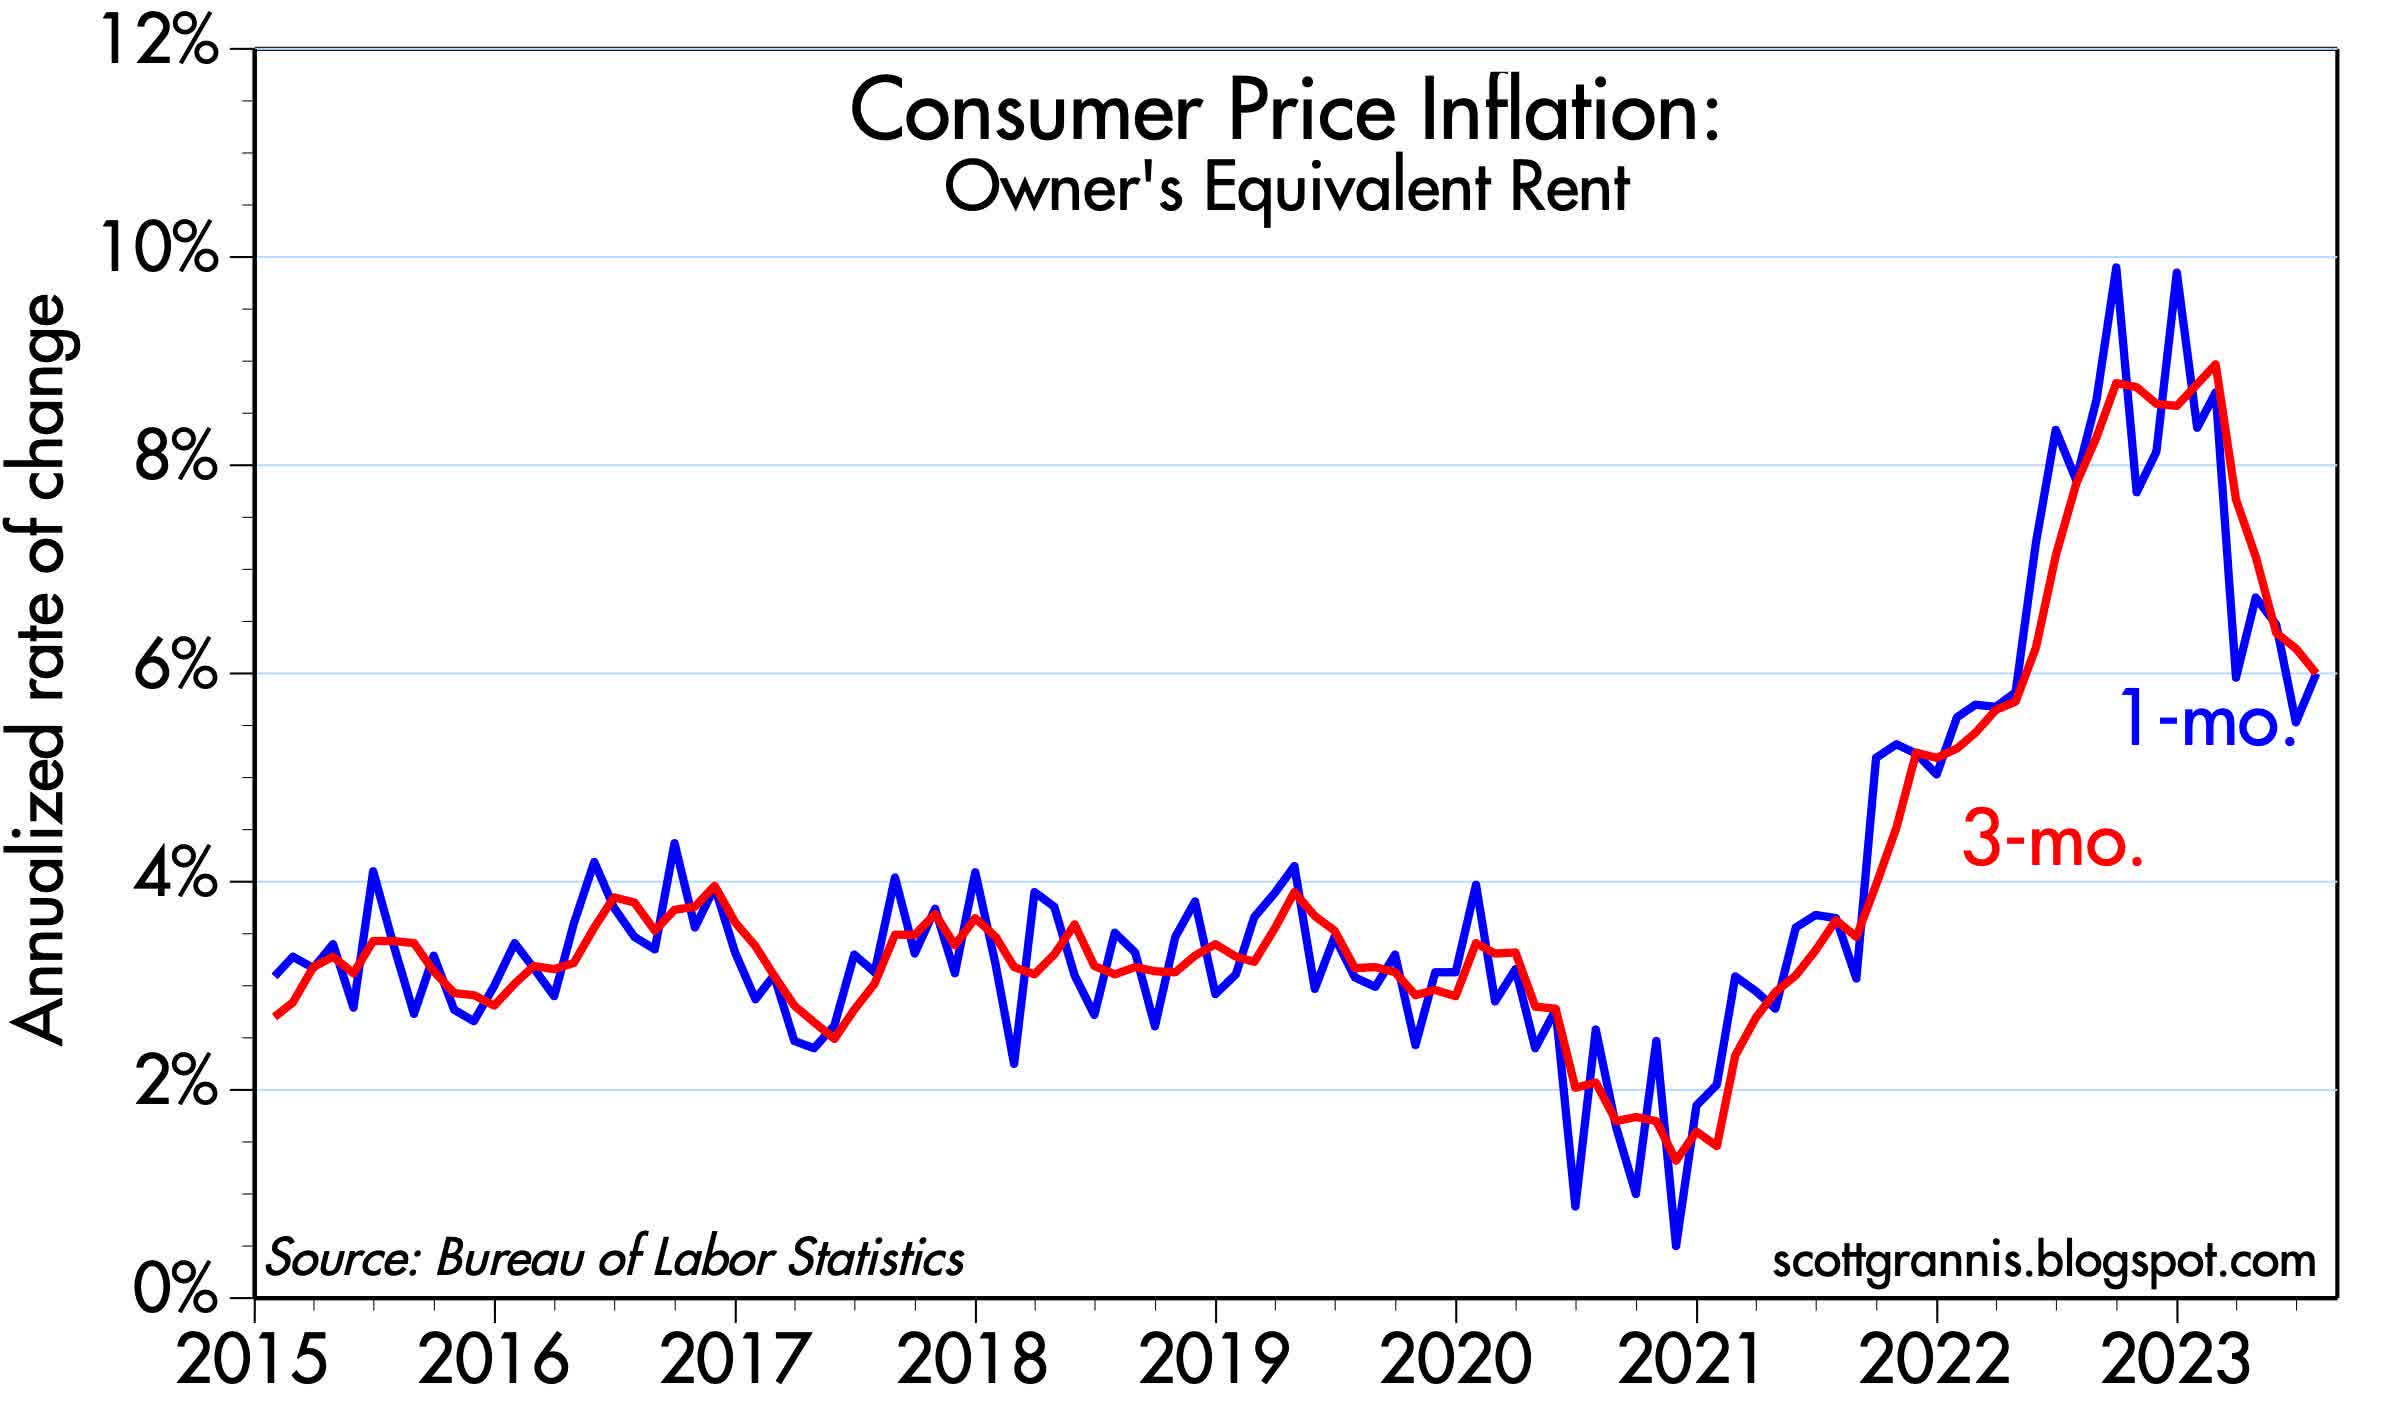
It's well-known that housing prices and rents stopped rising about a year ago, but owners' equivalent rent, the largest single component of the CPI (red line) is still rising, albeit at a somewhat slower rate in recent months. As Chart #3 shows, OER lags changes in housing prices by about 12-18 months. As Chart #4 shows, OER inflation has been falling - and it will very likely continue to fall for the next 6-9 months. Before the year is out, OER disinflation might well be enough to cause the overall CPI to turn negative.
Chart #5
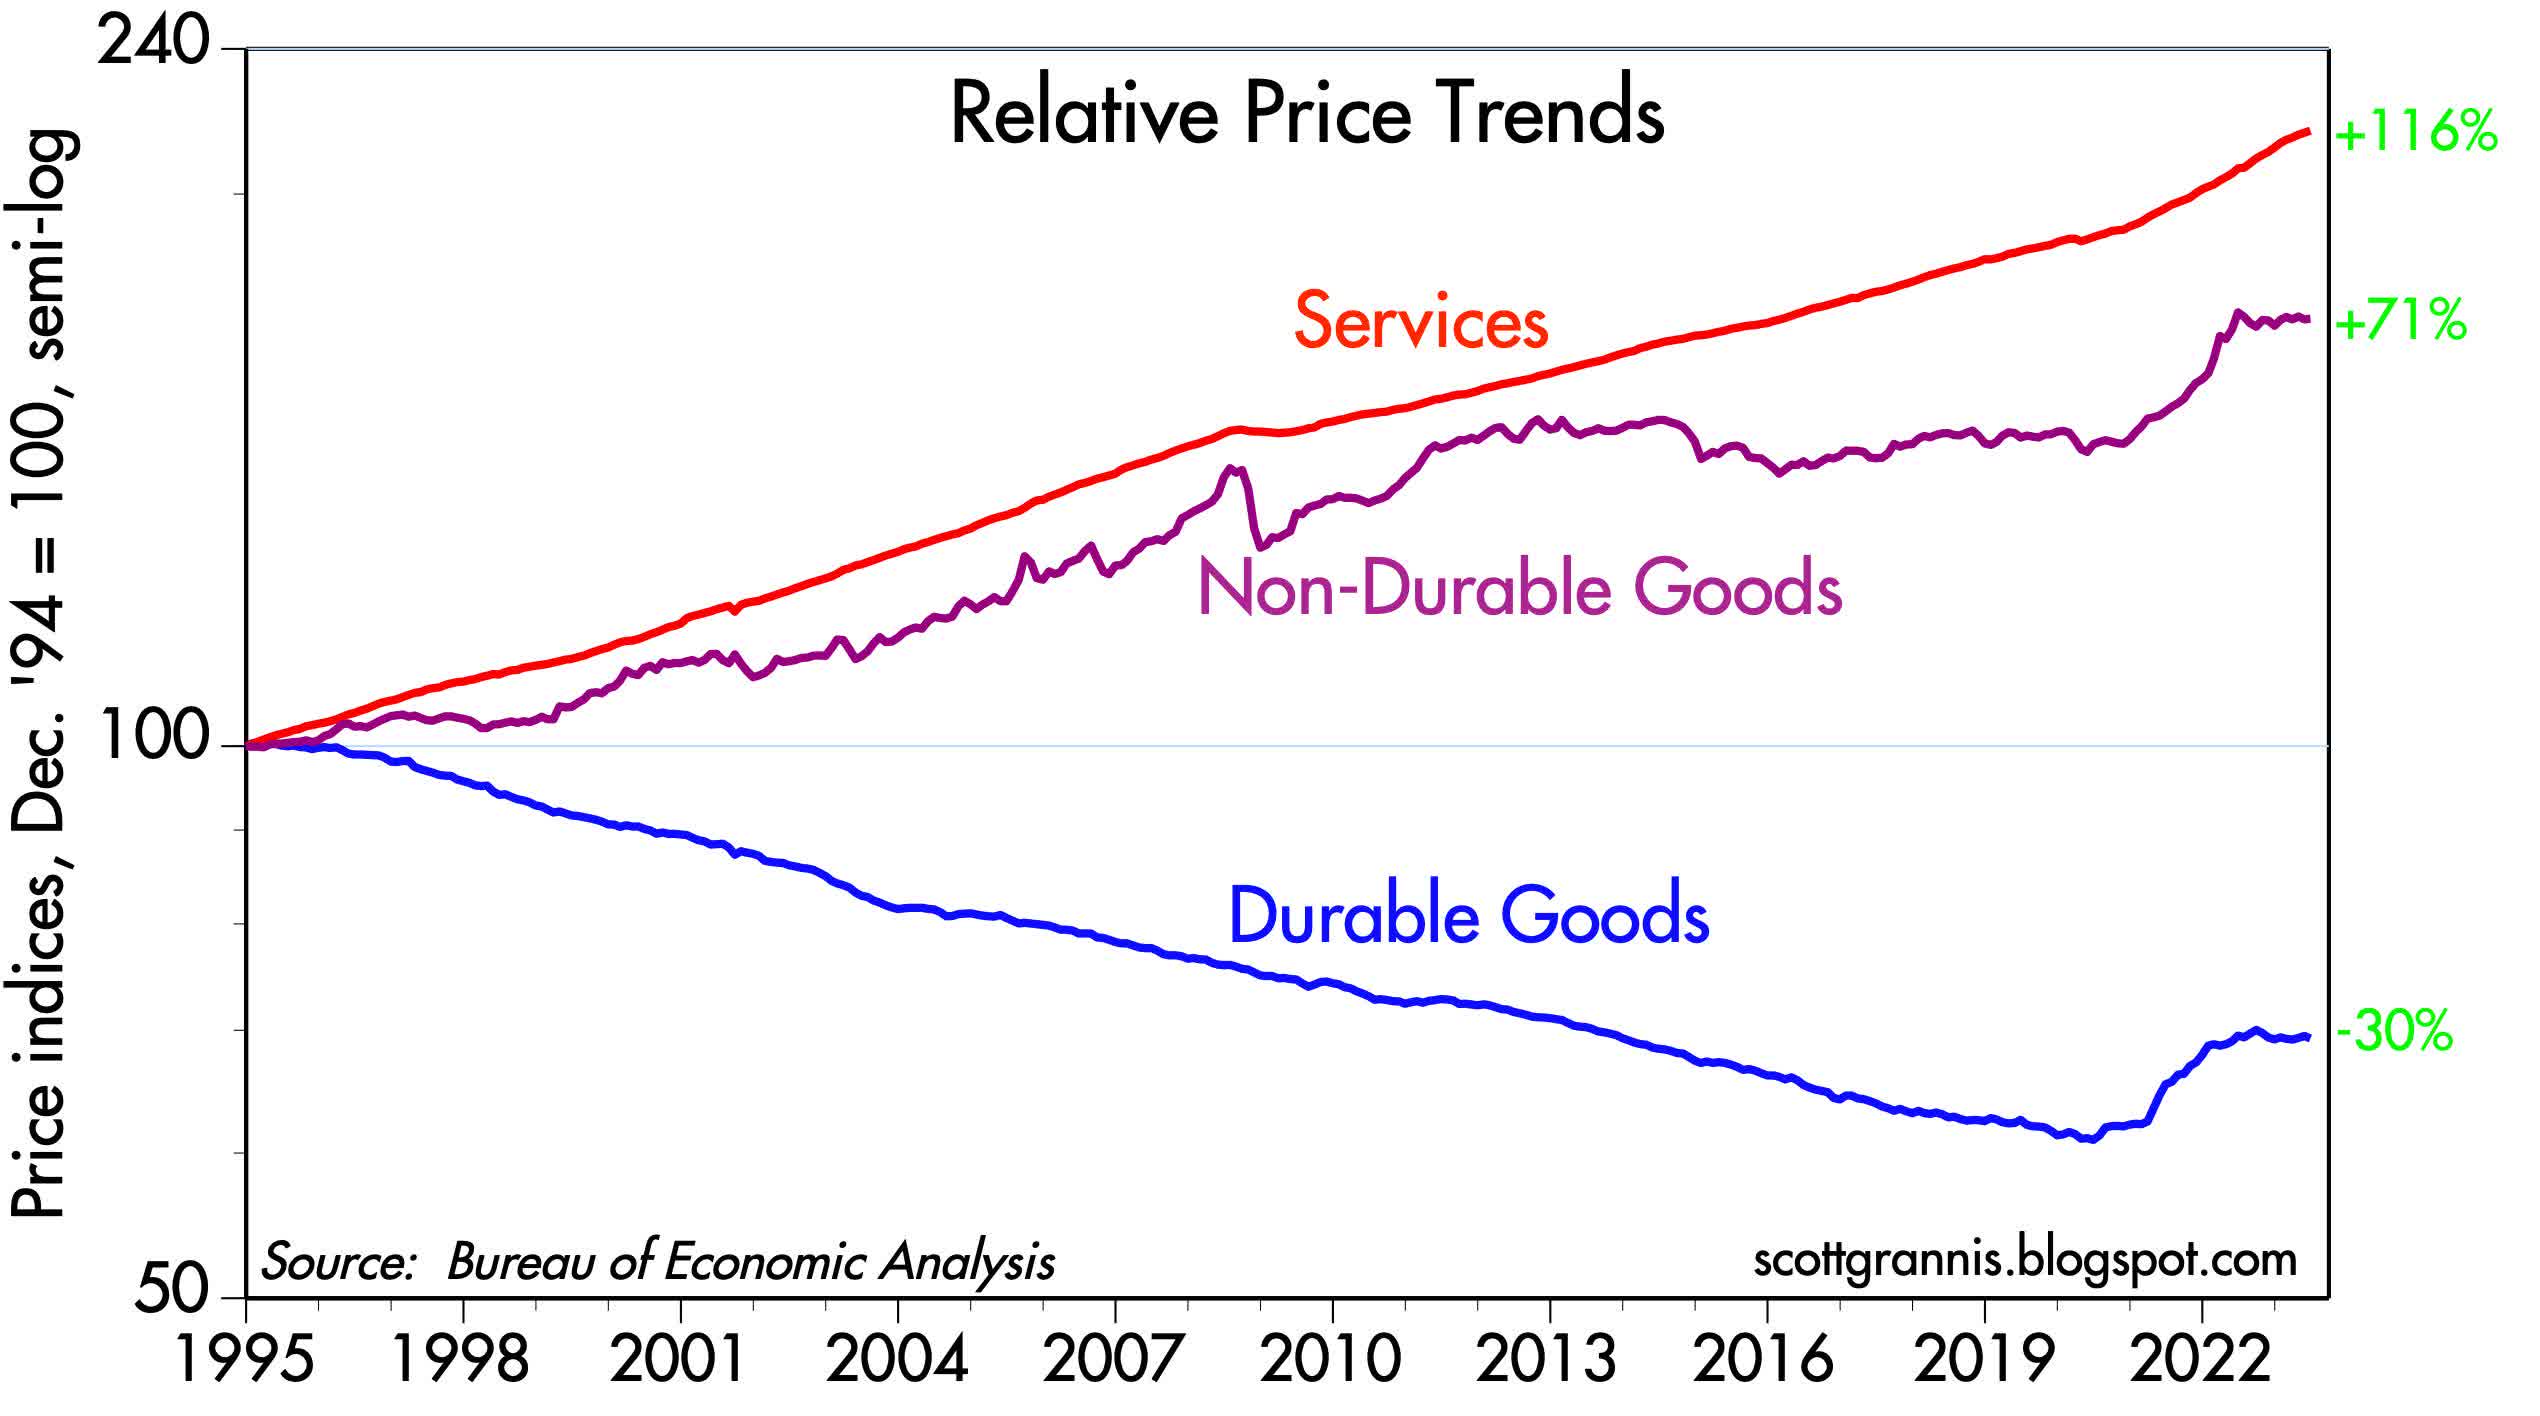
Chart #5 shows the three major components of the Personal Consumption Deflator, which increased by 3.0% in the year ending June. Note how both the non-durable goods and durable goods indices have been unchanged since June of last year. This means that the only source of inflation in the economy since June of 2022 has been in the service sector. Shelter costs figure prominently in this sector, just as they figure prominently in the CPI. Shelter costs are badly measured; correcting for that we find that inflation is no longer a problem.
Chart #6
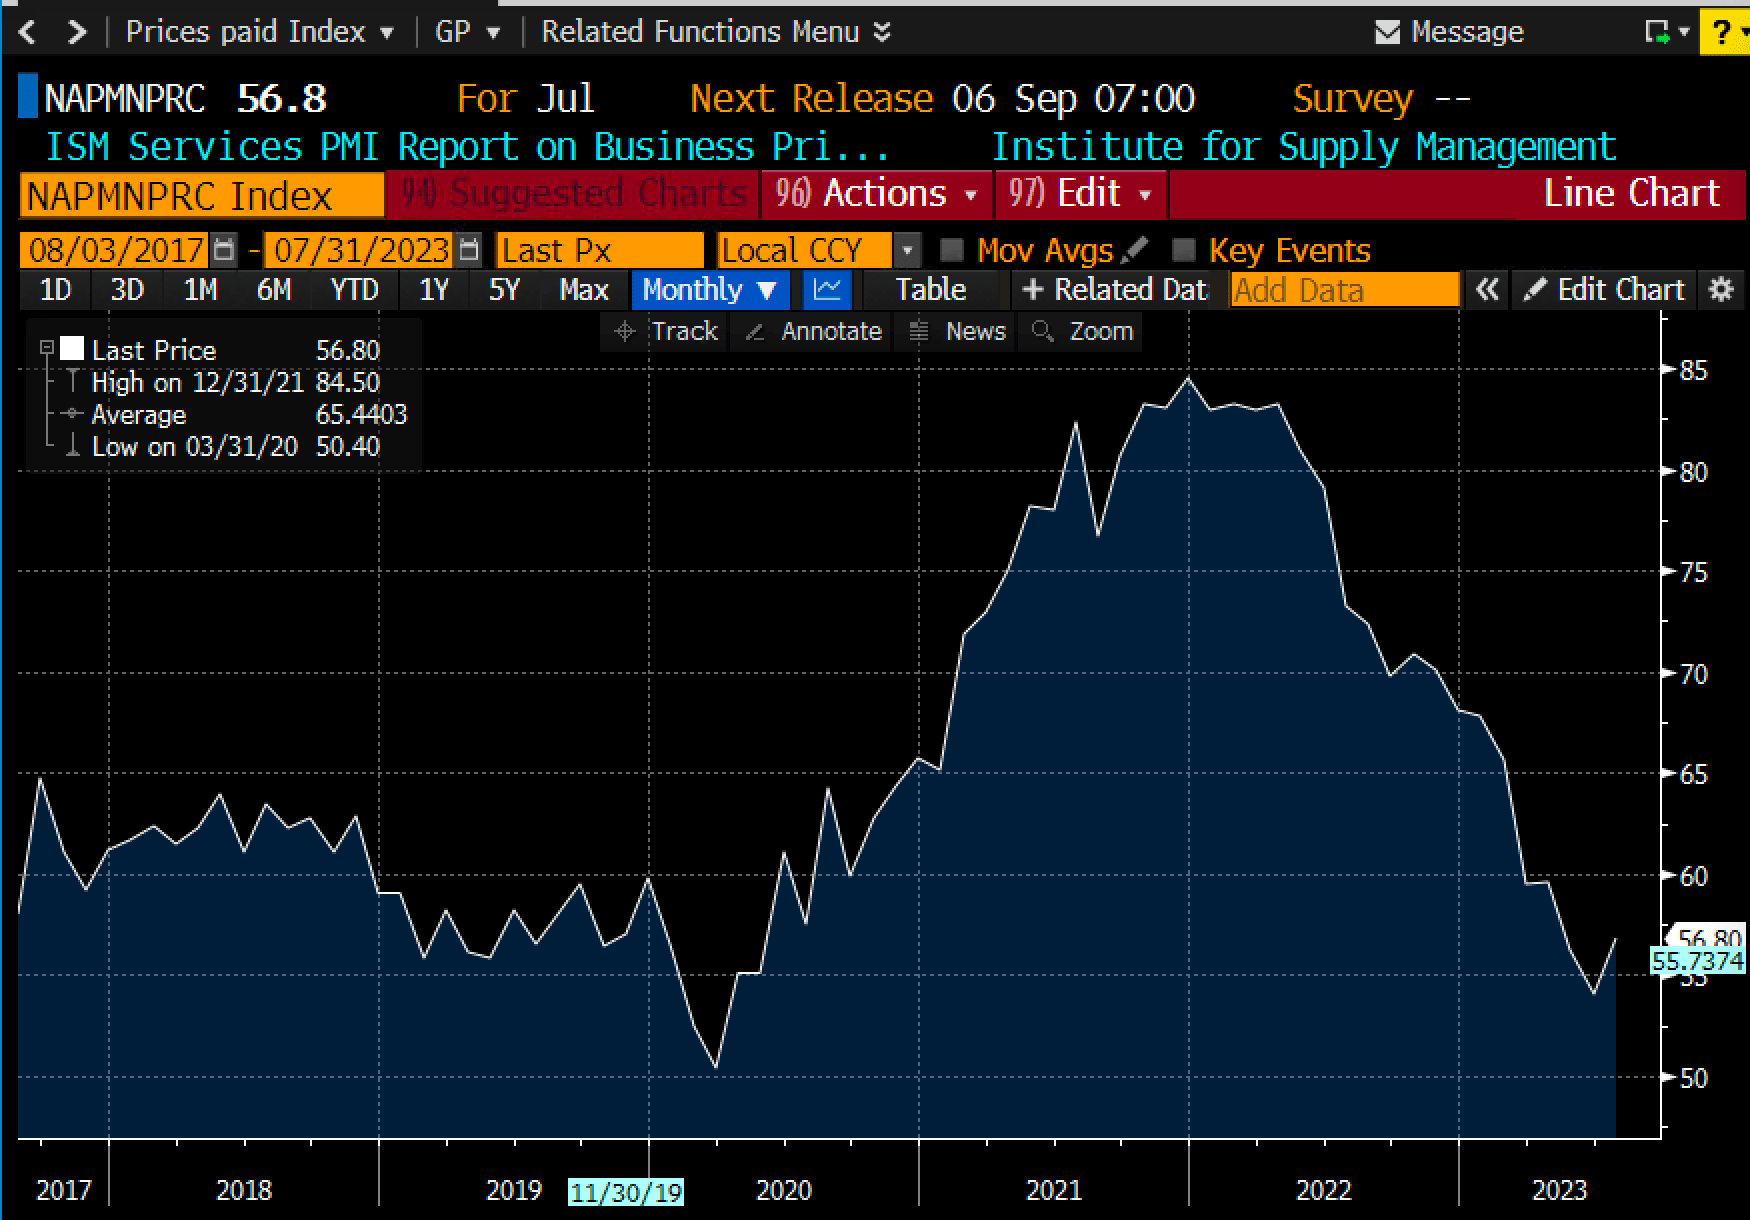
Chart #6 shows the percentage of businesses who report paying higher prices, according to the ISM survey. Only 57% reported paying higher prices in July, and that is about the same number that reported paying higher prices in the year prior to Covid. In short, we're back to where we started on inflation.
Chart #7
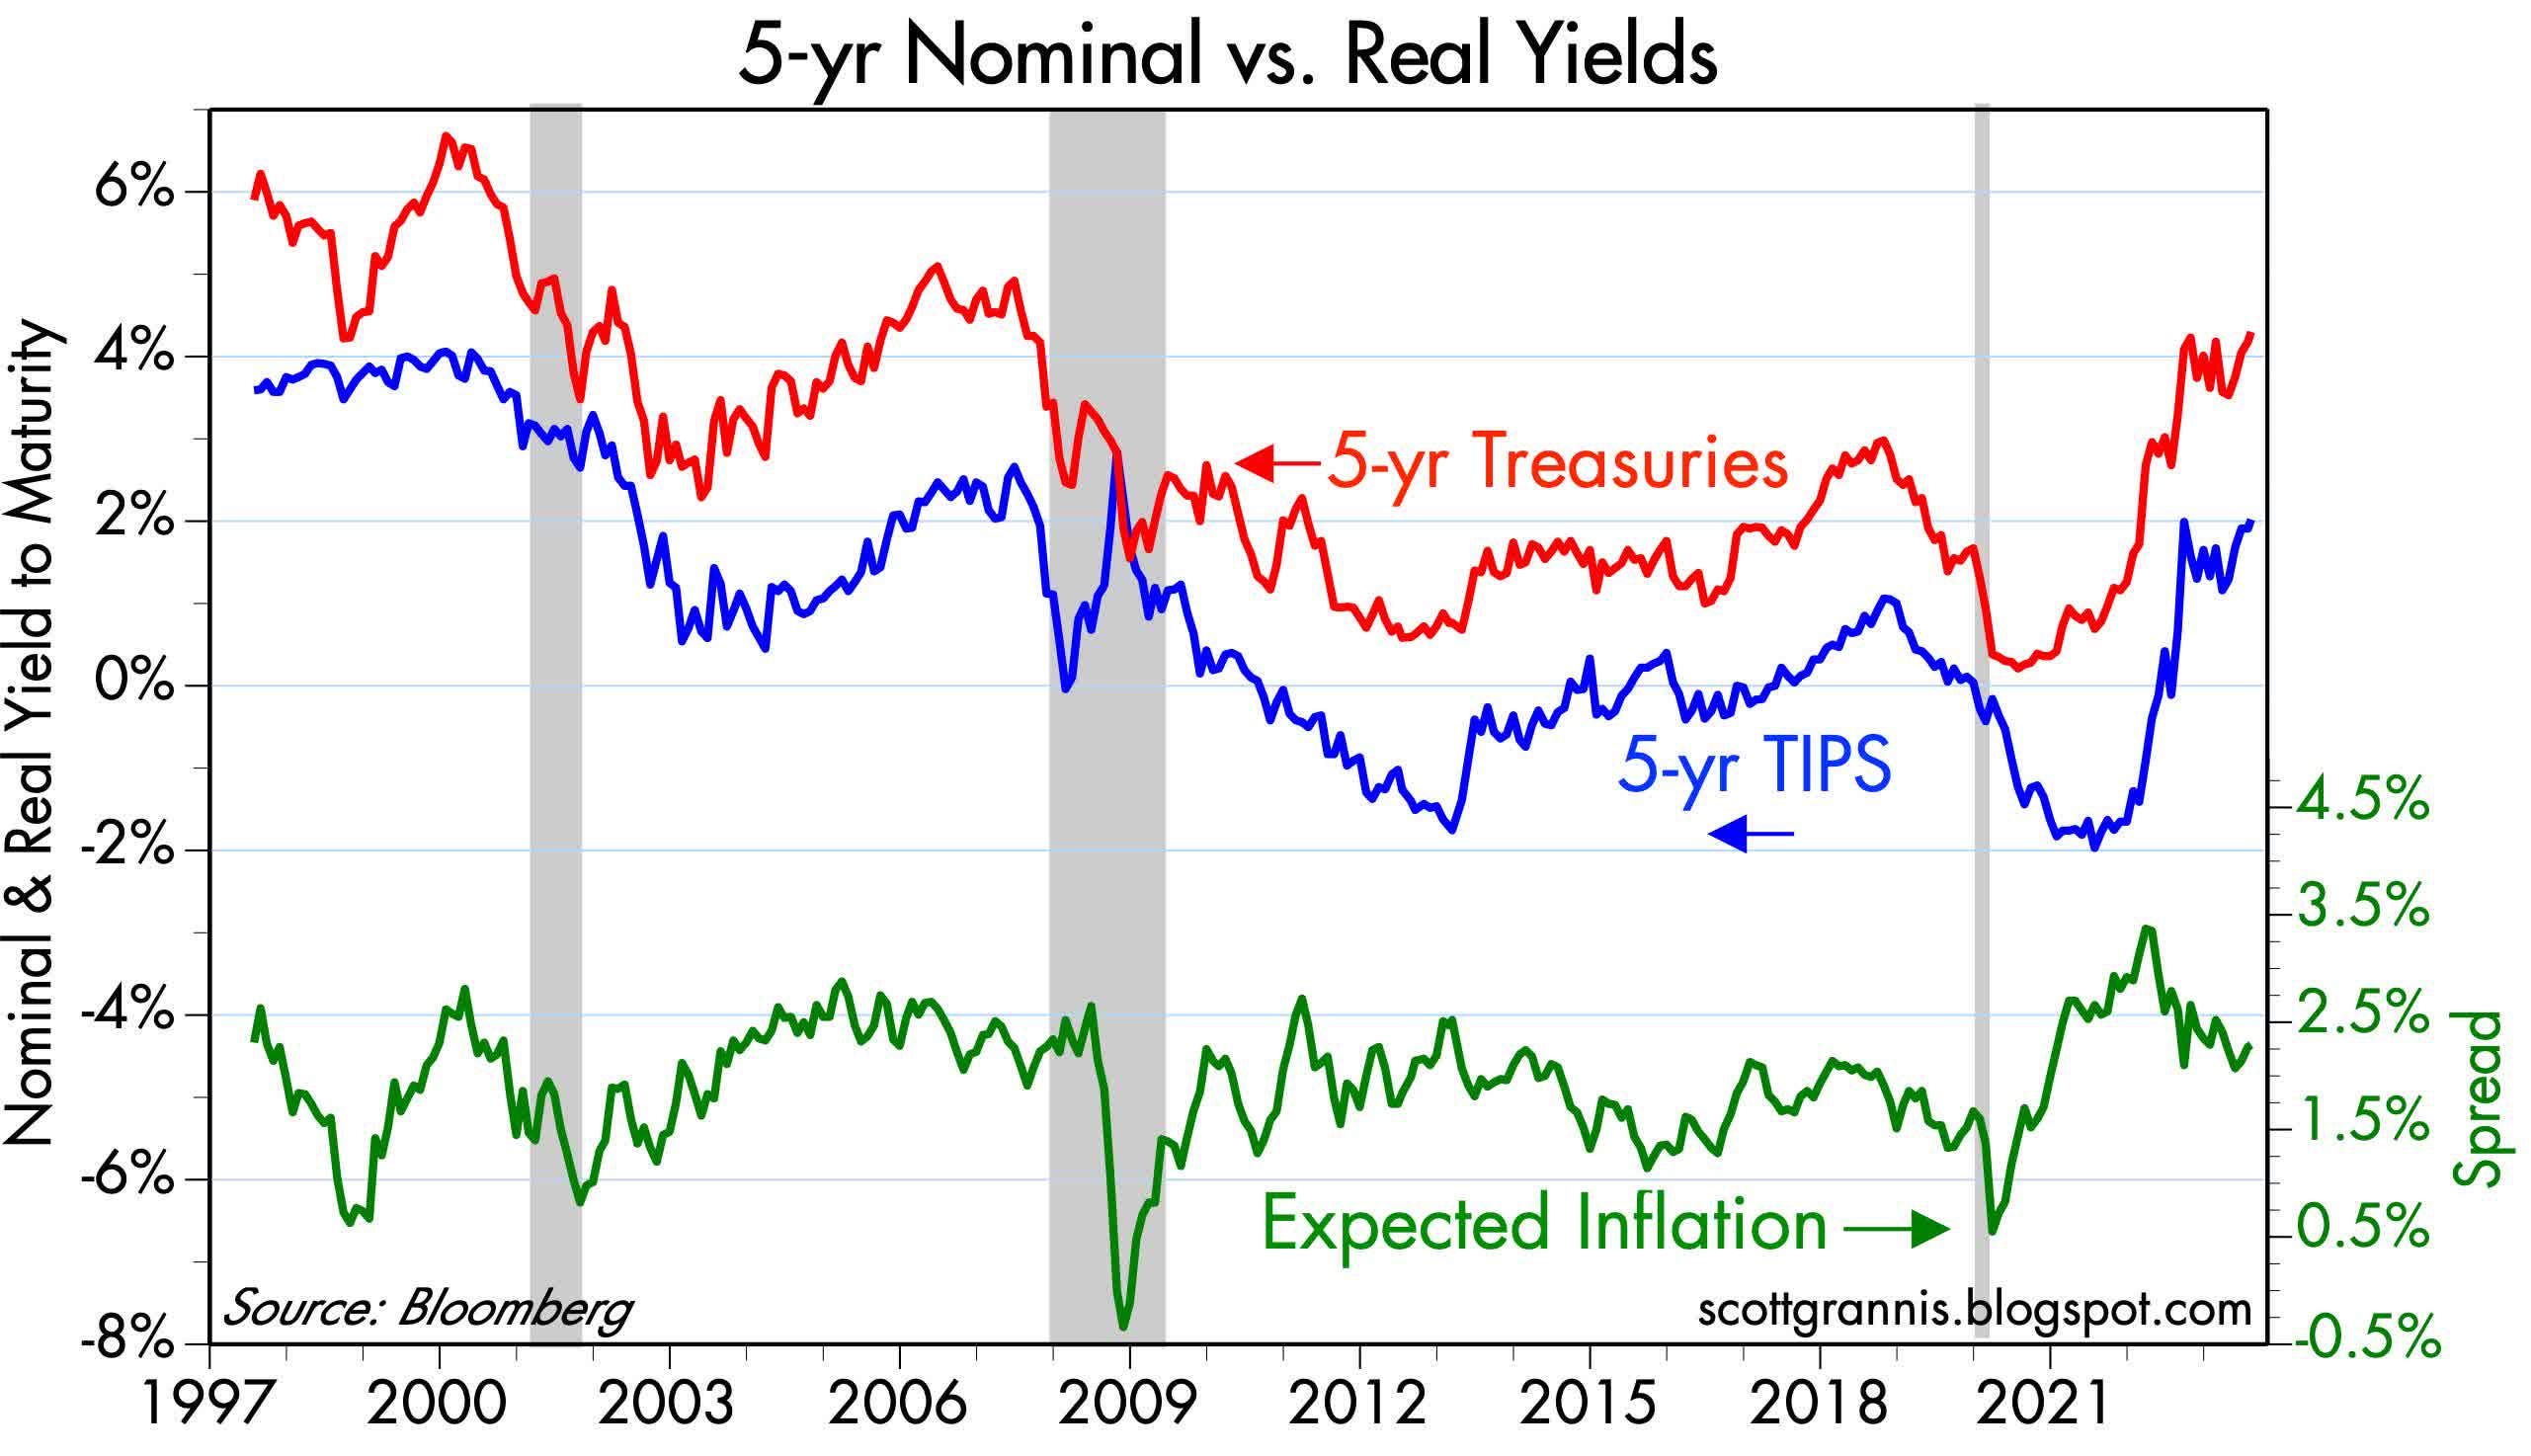
Chart #7 shows the nominal and real yields on 5-yr Treasuries and TIPS, and the difference between them (green line), which is the market's expectation for what CPI inflation will average over the next 5 years. By this measure, the bond market fully expects the Fed will deliver on its inflation promise: 5-yr inflation expectations are about 2.2%.
Chart #8
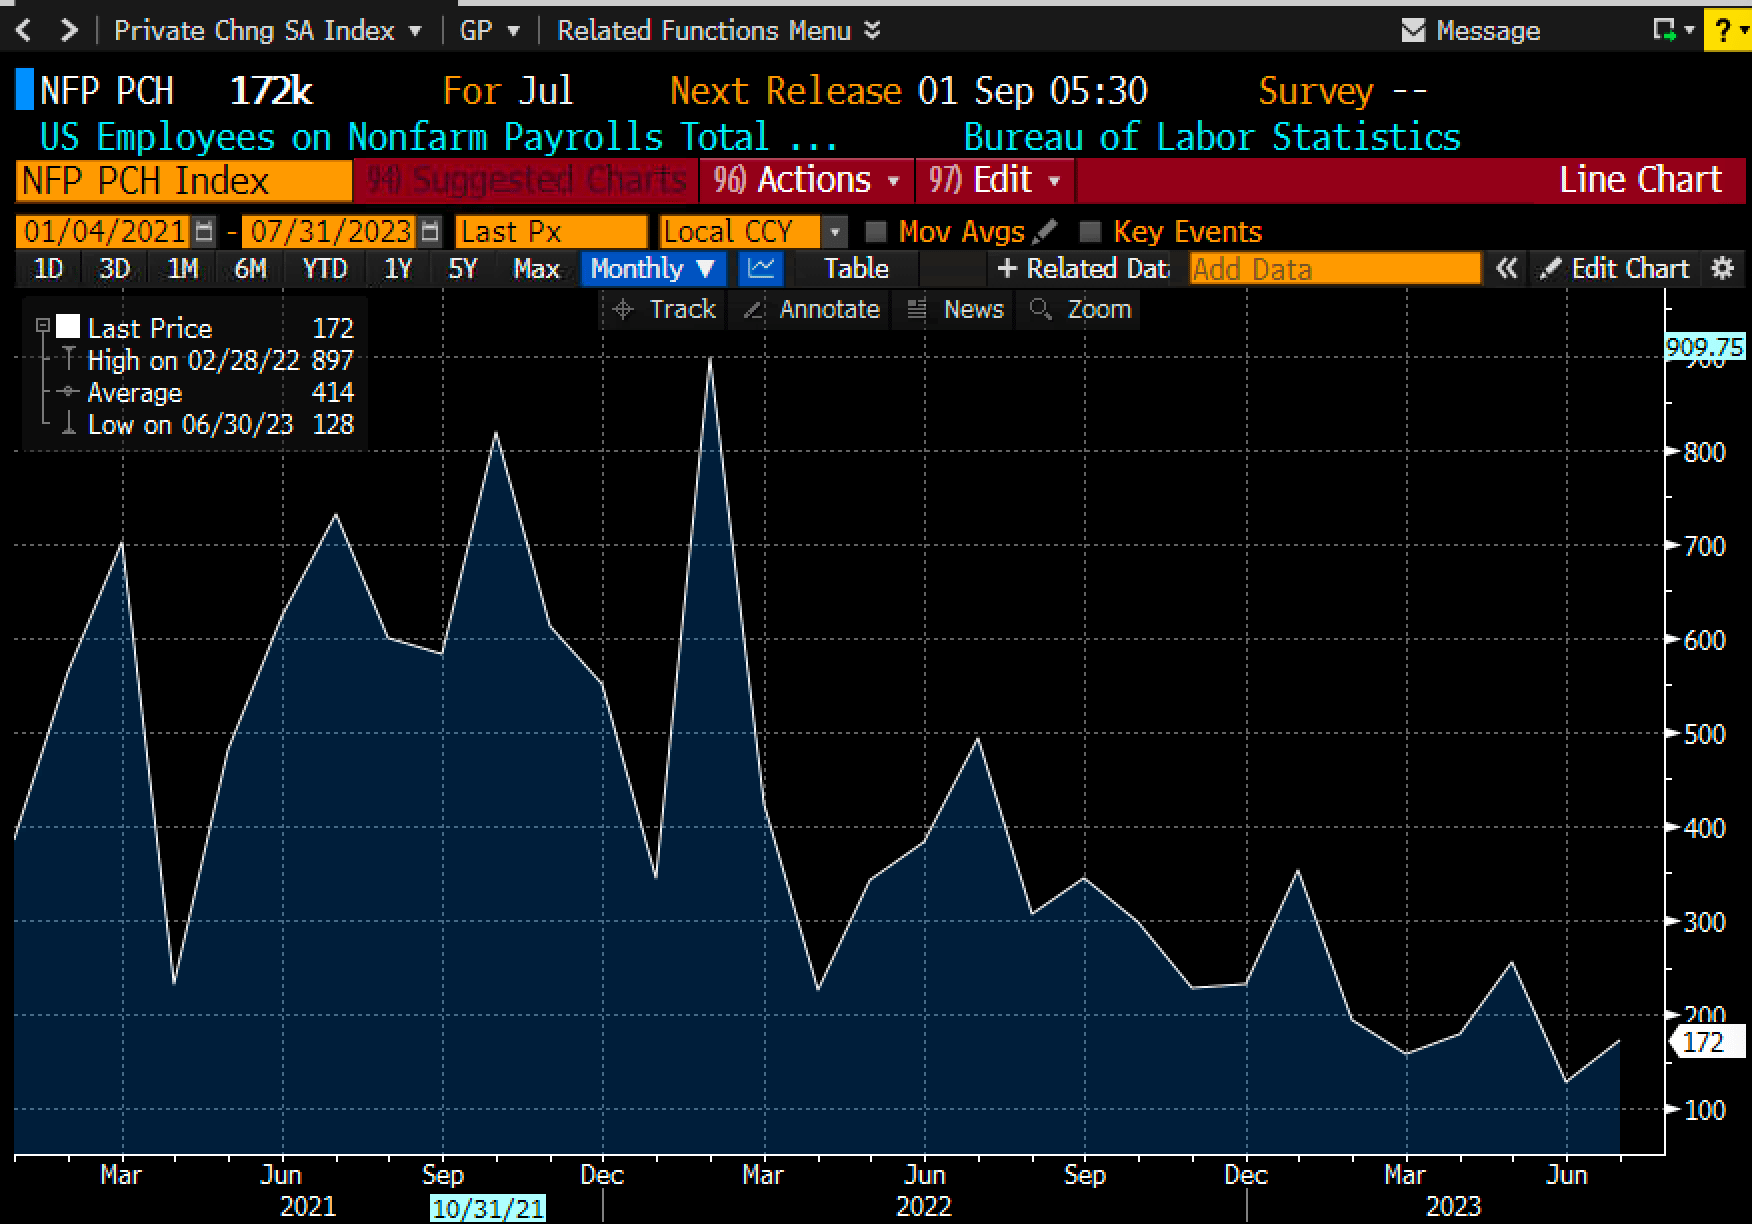
Now let's turn to the economy. Contrary to the hand-wringers who lament that the economy is "running hot" and thus we're unlikely to see further declines in inflation, Chart #8 (monthly changes in private sector jobs) makes it clear that the growth of private sector jobs has been declining since early 2022. The private sector is the one that counts, and jobs there have grown by only 2.2% in the past year. That's down sharply from the 5.0% year-over-year growth rate through July '22. Over the past six months, private sector jobs have increased at only a 1.6% annualized rate. Judging by the jobs market, the economy is unlikely to do much better than 2% going forward. That's not even close to "running hot" in my book.
Chart #9
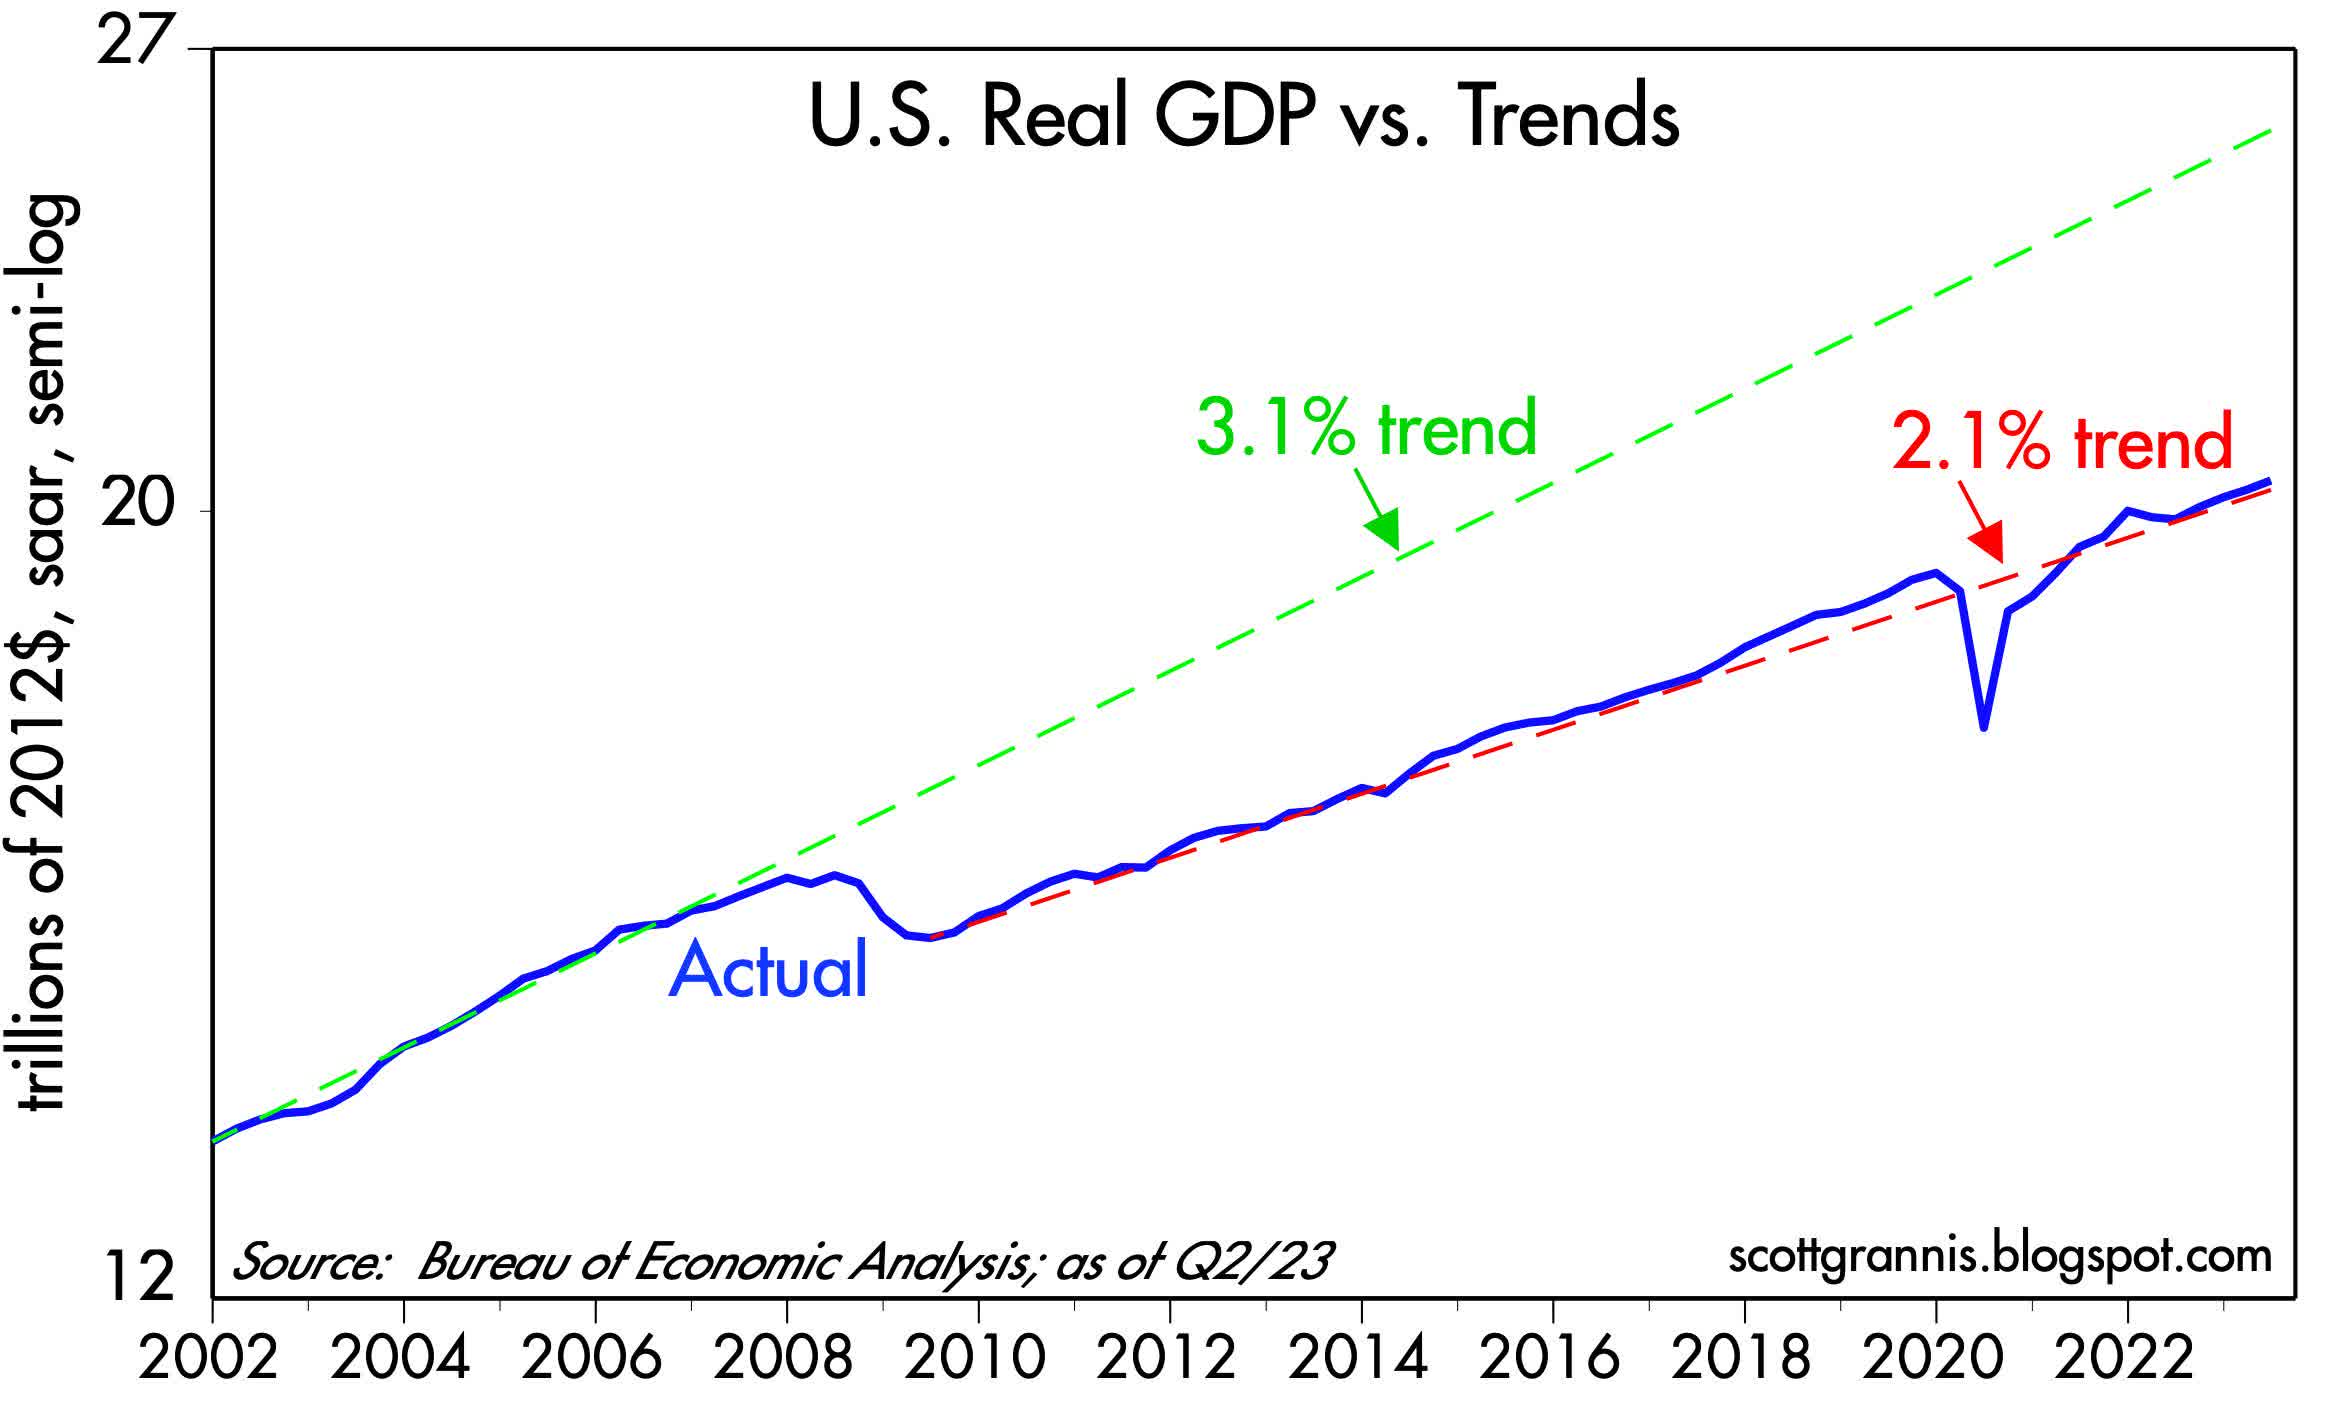
Chart #9 compares the level of inflation-adjusted GDP (blue line) with two trend lines (green and red dashed lines). It's plotted on a log scale axis, which means constant rates of growth show up as straight lines. Here we see that since the summer of 2009, the US economy has grown on average by about 2.1% per year. That's way less than the 3.1% growth trend that prevailed from 1965 through 2007 - 21% less, in fact. If the economy had followed a 3.1% trend growth path, it would be 26% larger today. We live in a slow-growth world, thanks to massive (and terribly wasteful) government spending on transfer payments and inefficient "green" energy.
Economic growth has been sluggish for the past 14 years, yet that didn't stop inflation from rising to double-digit levels. That's because growth has nothing to do with inflation; inflation is all about money . By sharply boosting short-term interest rates since early last year, the Fed has managed to bring money supply and money demand back into line, and that is why inflation has fallen.
M2 growth has slowed dramatically and inflation has fallen because interest rates have soared. Higher interest rates make holding money more attractive, AND they make borrowing money less attractive. The public today is more willing to hold onto M2 and less willing to spend it. The public is less willing to borrow money since interest rates are so high and more willing to pay back existing loans. (Banks create M2 money when they make net new loans.) The result is a balancing of the supply of money and the demand for money, and the gradual disappearance of inflation.
Currently, the market expects the Fed to hold rates steady through the early part of next year, and then to begin easing. If my reading of the monetary and inflation tea leaves is correct, the Fed should begin cutting rates now , not next year. If they wait too long, we will see the CPI entering negative territory (i.e., deflation).
Would deflation be a huge problem? Many seem to think so, but I'm not so sure. The argument against deflation is that consumers would pull back on their spending - and weaken the economy - because cash would become an earning asset. Why buy something now if you can buy it later with fewer dollars? The problem with this line of thinking is that economic growth does not depend on consumers spending money. We don't spend our way to prosperity, we work hard and invest in order to prosper.
Growth is the by-product of savings and investments that boost the productivity of the average worker, in addition to the organic growth of the workforce. For example, and roughly speaking, a 1% increase in productivity plus a 1% increase in jobs results in real economic growth of 2%.
Be patient . Sooner or later the numbers will convince the Fed that lower rates are called for. In the meantime, enjoy an economy that continues to grow, albeit relatively slowly, and inflation that continues to decline.
Editor's Note: The summary bullets for this article were chosen by Seeking Alpha editors.
For further details see:
A Look Inside The Inflation Numbers Says The Fed Is Done