CCI - A Margin Of Safety For Crown Castle
2023-05-23 06:30:00 ET
Summary
- Crown Castle differs in many ways from typical REITs.
- Recent cash earnings growth has been slower than it seems from reported FFO and AFFO.
- Future growth is key to their fair value.
Crown Castle Inc. ( CCI ) is one of three "Communications REITs" in the NAREIT classifications. They build, own, and lease cell-phone towers, fiber optics, and small cells.
The towers are used almost everywhere. The fibers provide high-bandwidth data transfer in places where that is needed, such as universities and other data-intensive businesses. The small cells enable provision of adequate bandwidth for 5G service to dense urban areas.
Crown Castle became a REIT in 2014. They and their predecessors have provided telecommunications infrastructure back to the 1990s at least.
Here is how they describe their business in the 2022 10-K:
Our core business is providing access, including space or capacity, to our shared communications infrastructure via long-term contracts in various forms, including lease, license, sublease and service agreements (collectively, "tenant contracts"). We seek to increase our site rental revenues by adding more tenants on our shared communications infrastructure, which we expect to result in significant incremental cash flows due to our low incremental operating costs.
There is also some revenue from site development and installation services.
Crown Castle has emphasized for several years their dividend growth target of 7-8%. They have done 9% since setting the target in 2016. More recently they have called for a couple years of below-target growth while the consequences of the merger of T-Mobile and Sprint play out.
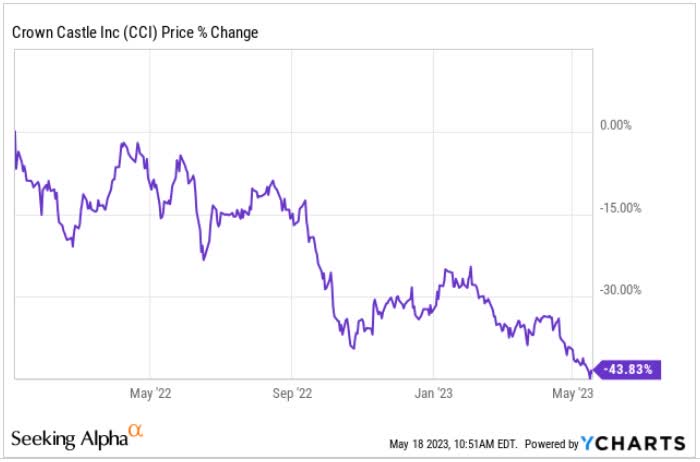
I decided to look into Crown Castle because they are one of the REITs whose stock price has dropped enormously. The stock price is down nearly 50% since early 2022 and it would be great to find another REIT that I was willing to own now.
The Lease-Up Ladder
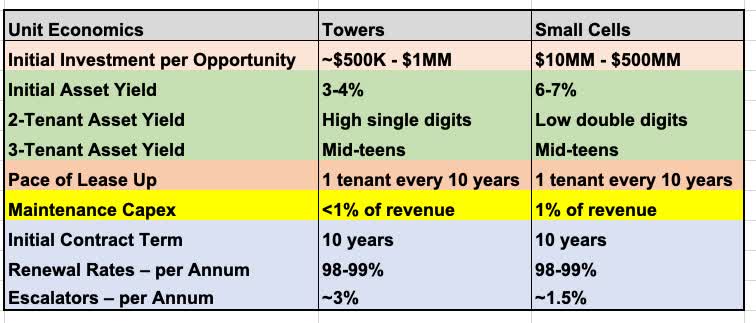
Here is how Crown Castle portrays the leasing of their towers and small cells:
The key rows are shaded green. The initial yield is low. But one can serve multiple tenants with the same tower or small cell.
Additional tenants are cheaper to serve. As they come in, about one every ten years historically, the yield moves to near 10% and then into the mid-teens.
One way to look at this is that the rents from the infrastructure double in ten years (plus some escalation of the rent from the first tenant). This is similar to having an overall rent escalator above 7%. It is the main thing lets Crown Castle target a 7% dividend increase, above that of more traditional REITs.
But this road of leasing communications infrastructure is not smooth. Let's look more closely.
Fast Growth via GAAP
Crown Castle gets most of their revenues from renting their communications infrastructure to their tenants. The main expense for them is the rent they pay on ground leases or similar contracts that give them use of land, fiber, or other physical objects on which they install their communications infrastructure. The gross operating margin for their towers and fiber sites is 78% and 67%, respectively.
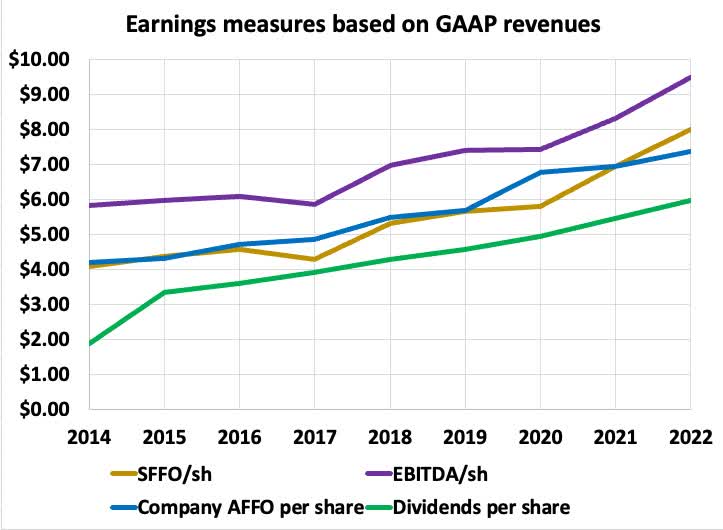
Looking first at traditional indicators of earnings, all derived from GAAP revenues, we have these trends:
Here EBITDA has its usual definition. With FFO being Funds From Operations, SFFO is Simple FFO, just EBITDA less interest expenses. From 2015 through 2022, the CAGR of SFFO/sh was 9%.
AFFO is Adjusted FFO as defined by the company. The main adjustments are these: it removes certain noncash revenues and expenses from FFO, adds back in stock-based compensation, and takes out recurring capex. In some ideal world AFFO would represent cash earnings, but we will see below that this is not the case here.
The green curve is dividends/sh. These have steadily run at about 80% of AFFO since 2015. From 2015 through 2022, the CAGR of AFFO/sh was 8% and that of dividends/sh was 9%.
Overall, it appears that since 2015 Crown Castle has been a high grower. But we need to look deeper than AFFO to find out the real story.
Where is the Money?
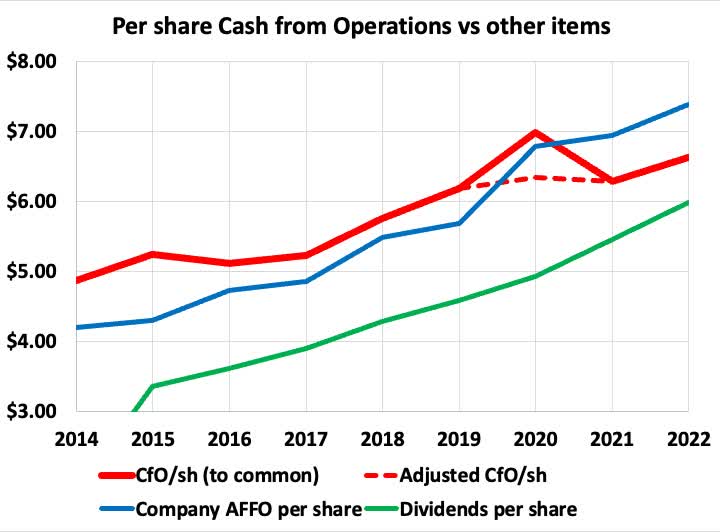
We can start with Cash from Operations, or CfO:
CfO and AFFO should both be unaffected by straight-line revenues and expenses. CfO should be larger because recurring capex is not taken out of it. This was true before 2020, but the gap is larger than recurring capex alone would explain.
Then in 2020 (from the 2022 10-K) relating to the merger of T-Mobile and Sprint:
The Company received approximately $308 million from T-Mobile pursuant to the 2020 Cancellation [of contracts for small cells], and recognized receipt of this payment as "Other operating income"
That $308M created the (one-time) upward bump in CfO/sh one sees above. The dashed curve is what you get if you remove the bump.
Overall, CfO/sh grew at a CAGR of only 3% from 2014 thru 2022. Ouch.
If you look at payout ratios you see this:
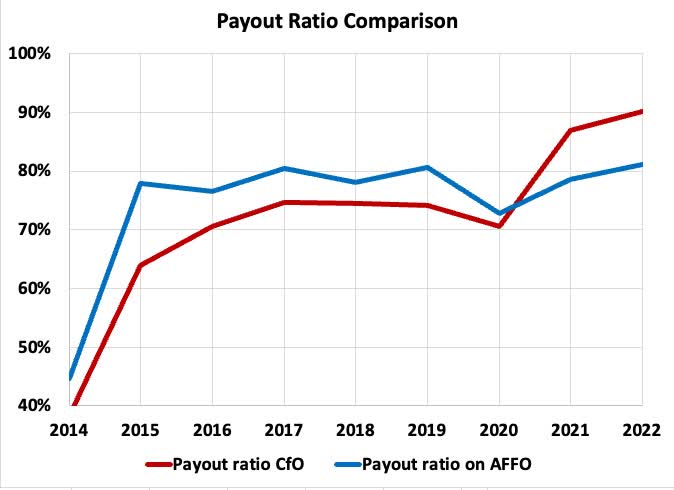
The fraction of CfO paid out as dividends was comfortably below 80% through 2020. Then it jumped to about 90% in 2021 and 2022.
This is too high. Crown Castle needs to bring up their cash earnings by at least 10% before they can afford aggressive future dividend increases.
I'm not concerned about sustaining the dividend. Their earnings will grow. Increasing the dividend, though, may be another matter.
One must wonder how the red and blue curves in the last two plots flipped their order. There are some rather mysterious adjustments in the Statements of Cash Flows. Here is 2022:
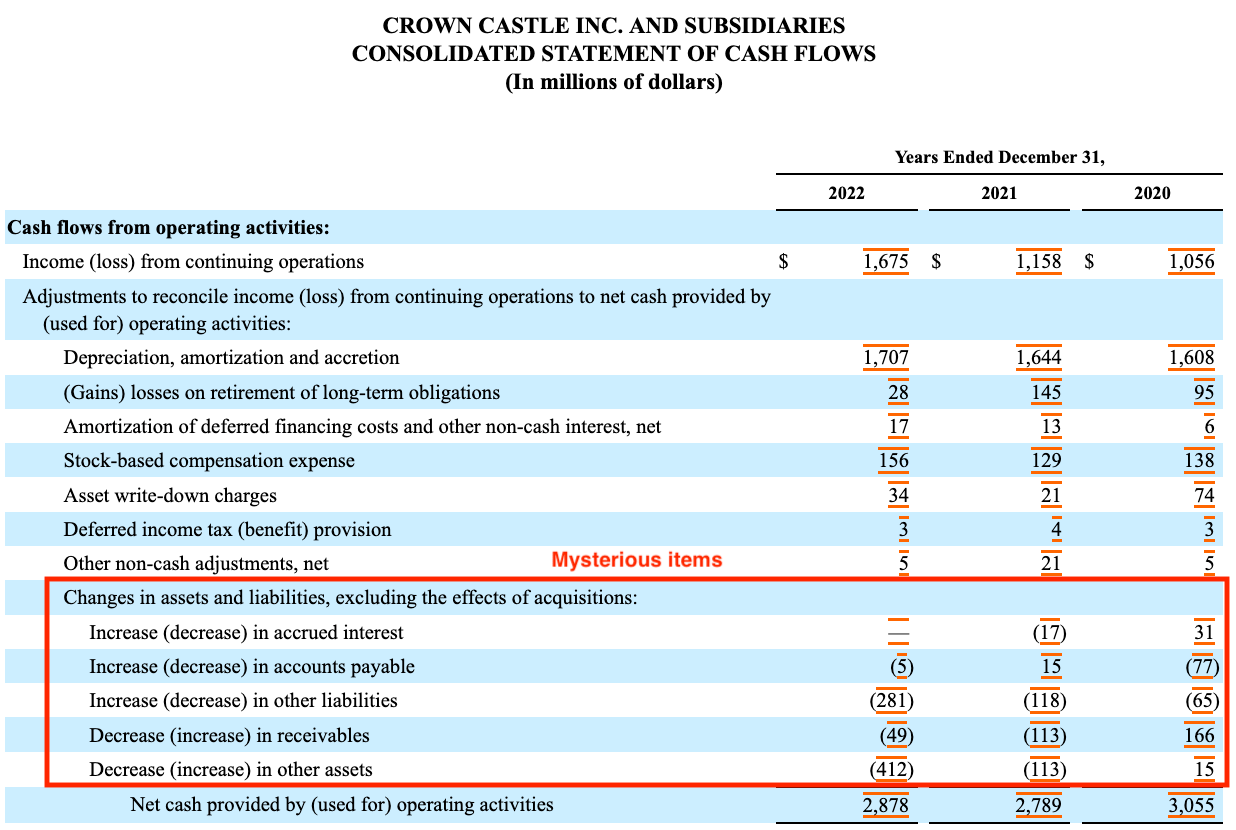
My reading of the 10-K and Supplemental gave me only a few clues about these items. So I asked Investor Relations.
They said it was mostly straight-line rent and expense adjustments and that I should look at their reconciliations of AFFO. So I did.
Unless you are a glutton for punishment, you can ignore almost everything in the next table, which is for 2014 and 2022. Let me guide you to the important stuff.
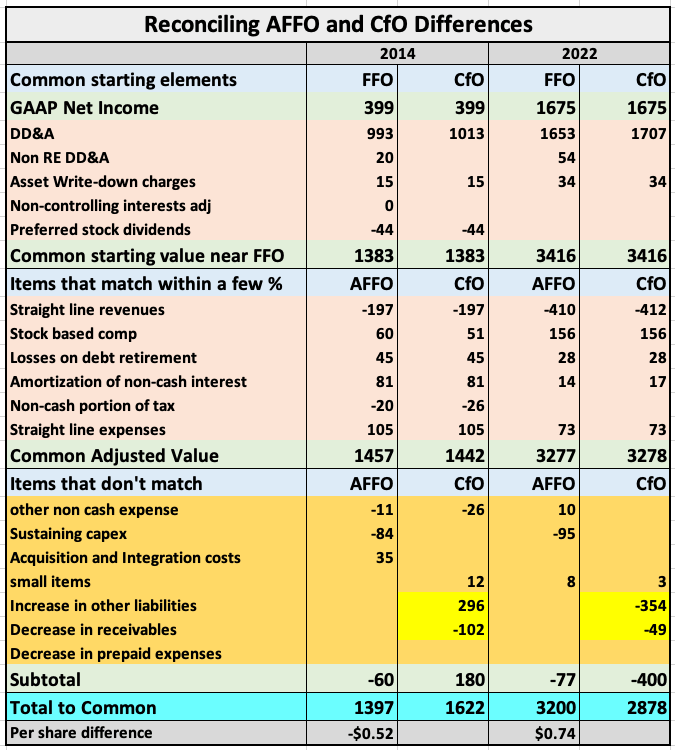
The two sets of rows labeled orange show details that can be ignored here. The first orange section starts with GAAP Net Income and makes the standard adjustments that get one near FFO. The next orange section includes several adjustments that remove non-cash income or expenses that are part of GAAP Net Income. This gets one to numbers that differ little between the columns for a given year.
It is the rows shaded gold where the main differences appear. As mentioned above, one of these is sustaining capex, taken out of AFFO but not CfO.
But it is the cells shaded yellow where the mysteries remain unresolved. Despite removing the values of straight-line items identified in the AFFO calculation, there seems to be $180M of extra cash income in 2014 and $400M of false income in 2022.
[To be clear, Crown Castle is not falsifying anything here. Instead, the GAAP accounting rules imply that GAAP revenues do not equal cash revenues. I consider any resulting increase in earnings to be false earnings because they do not represent cash, they may never actually happen, and straight-lining inaccurately represents the time value of money.]
This pattern is the same as that of the straight-line adjustments. In 2014 Crown Castle had a lot of old leases so GAAP revenue understated cash income. And vice versa for 2022.
But my explorations left me unable to figure out what was (apparently) being leased yet not counted as part of real-estate operations. I asked investor relations, on May 9, for help. No reply yet, as of May 22.
Crown Castle overall has been responsive to shareholder requests to make their financials more clear in their filings. But leaving well over 10% of CfO as a mystery makes me conclude that they have yet to do quite enough.
The bottom line: it is not clear why AFFO overstates CfO by 11% in 2022. Crown Castle has new things happening with Dish. Perhaps the current non-cash revenue relates to this.
[Crown Castle management: you should pay attention here. You have done a great job improving your disclosures recently. Why leave 11% of CfO as a mystery to your owners?]
The discrepancy makes it difficult to understand when and how Crown Castle can repair the coverage of their dividend by cash earnings. It may help to look at their growth model.
Cash Flows and Growth
Looking at all the Crown Castle cash flows, we can look first at Cash from Operations and dividends, shown here:
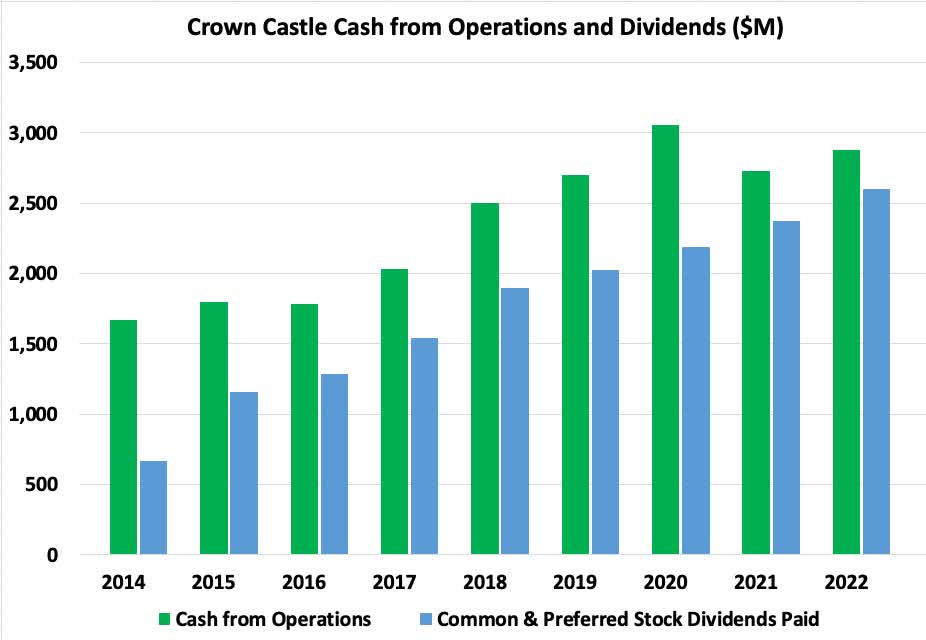
Now we take the difference of these to find the retained earnings, and compare it with the other cash flows:
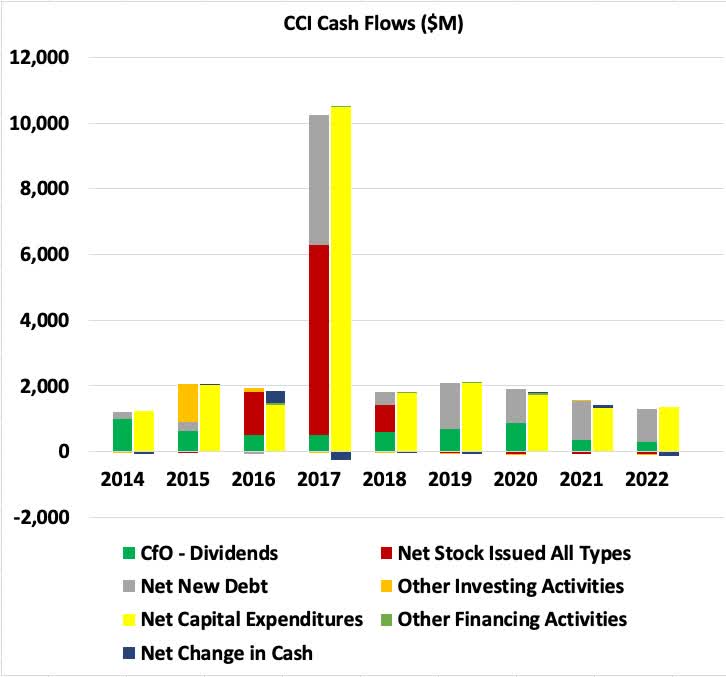
Now the green is retained earnings. Red is issuing stock. They only did that as part of the 2017 merger with LightTower.
Gray shows new debt. Since 2018, retained earnings and new debt have been the only significant sources of capital. And nearly all of those have gone to pay for capex, shown in yellow.
Recently, new debt has exceeded retained earnings. Longer-term, they have been comparable.
The simple story of earnings growth is this, using numbers between those for towers and for fiber:
- Earnings from a new installation effectively grow at a 9% CAGR, with 7% from adding a second tenant and 2% from rent escalators.
- Retained earnings (pre-1921) are 25% of CfO.
- These are invested at an effective cap rate of 5%, with matching debt at 5% interest.
- The return on equity for that investment will be in the 3% ballpark, so that the immediate resulting growth of CfO is less than 1%.
One can get to the same result by looking at the specifics of their Fiber and Tower segments, from the 8-K. The disclosures of these details are outstanding.
RP Drake
This table finds the NOI increase based on known details and on the estimate that the initial NOI per site is 50% of the average. It does not matter what this number is precisely; the NOI growth from new infrastructure is much smaller than the growth of income from adding tenants to existing infrastructure. The disparity is larger to much larger than one sees from typical REITs.
The bottom line is that retained earnings can support growth of assets and long-term increases in CfO, but does not immediately contribute a significant increase in CfO. The impact of adding tenants over time is much larger.
Crown Castle explains a lot of things very well in their disclosures. But if they score a 90% then on a classic Bell Curve that is a B grade.
The Good, The Bad, and The Risky
Following from the above, the story on Crown Castle seems a mixed bag to me. And there are some risks that may be under-appreciated.
The Good:
The ability to add tenants over time to a tower or small cell is well-established. So is the increase in earnings that comes with sequential generations of network performance (3G, 4G, 5G, etc).
This provides hope that growing earnings can support strong dividend growth across the 5G transition and beyond. This is certainly what management has been selling.
The Bad:
One concern here is that, from the plots above, CfO only increased about 20% across the 4G transition in 2018 and 2019. For the rest of the past decade it has been flat.
It seems an open question whether actual growth can live up to the hype. This is even moreso with the current need to repair the CfO payout ratio. You can't pay dividends with the false earnings that are still part of AFFO, unless you do so by adding debt.
A second concern is tenant concentration in the context that the communications industry is not always stable. The merger of T-Mobile and Sprint will produce a significant drop in cash revenues through 2025.
Right now Dish is trying to grow, and Crown Castle expects them to be a source of steadily increasing income. But this move by Dish could fail. We have certainly seen similar things in the past.
Future decades might look a lot like the past one, with bursts of growth and periods that are flat. The end result could be the CAGR of 4% achieved for CfO/sh over the past decade. Higher growth is possible, but would require that new leaseups and new technology march forward while tenant issues are small.
In sum, I'm not buying 7% dividend growth as a basis for valuation. A conservative number is probably the 4% achieved for the past 10 years. Reality has a good chance to turn out in between those numbers.
Few REITs have done better than 4% growth rate of dividend/sh over the past 20 years. Lots have exceeded that over the past decade, especially those that cut the dividend a lot during the Great Recession.
The Risky:
Beyond the above aspects, it seems to me that this business has some long-term risks. Crown Castle is far from a typical REIT. Towers and small cells are not buildings.
Perhaps this is why the tower sector has been slow to get investment-grade credit ratings. The lack of these has been my #1 beef with them recently.
But interest expense is only about 16% of my ballpark cash NOI for Crown Castle. And the debt maturities are well laddered and small until 2026:
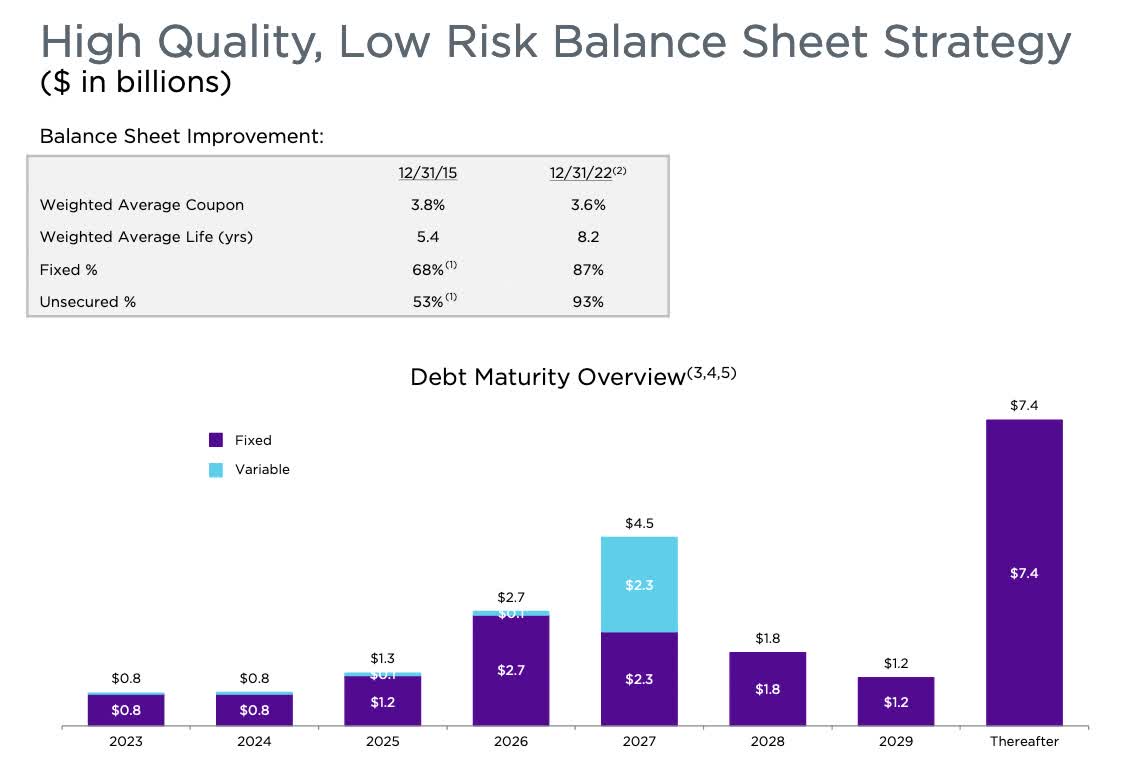
The ratings for Crown Castle today are schizophrenic. Fitch: BBB+, Moody's: Baa3, S&P: BBB. So are they close to an A rating or close to junk? You decide.
Typical REITs develop buildings or buy buildings, perhaps redeveloping the ones they buy afterward. They then operate these buildings for some period of time.
But throughout, and especially as their buildings age, most REITs sell them or renovate them. Portfolio recycling and redevelopment are common.
Who is Crown Castle going to sell a tower or small cell site too? Likely nobody. They are stuck with it over whatever its life cycle turns out to be.
They do account for Asset Retirement Obligations on the balance sheet. That is a small sum, though, and not important.
Technical risks and obsolescence also may matter. Consider apartments. If humanity were transformed to encased beings, a la The Matrix, that would render physical apartments obsolete. I am willing to invest on the assumption that this will not happen.
But rearrangements of the electromagnetic spectrum, coupled with new technology, could perhaps render some fraction (half?) of the existing towers obsolete. This is just speculation, but seems to me far more likely than seeing us all encased.
Or maybe innovation makes fiber cheaper and much less expensive to install, enabling displacement of many towers. On top of which the useful life of fiber is pegged at something like only 30 years and this may create long-term headwinds on fiber they own.
Or maybe AT&T goes and buys a big media company, perhaps Netflix. (Sound familiar?) Then they make bad decisions that shred whatever moat remained.
Financial troubles follow. The dividend is cut (again). AT&T finds a way out by making a deal to work through the Verizon infrastructure in regions where AT&T is not profitable.
Demand for towers in those regions plummets. Oops.
In a lot of ways communications infrastructure is far more risky than traditional real estate. Should one view Crown Castle like other REITs? You get to decide that too.
My take is that beyond two or maybe three decades from here, it makes sense to consider that the terminal value of Crown Castle may be greatly reduced.
Valuation
To value this company, one needs to make assumptions that seem less certain to me than those for most other REITs.
Where I end up is that the dividends will grow at some rate between 4% to 7% for the next, say, 25 years. And that the growth after that is uncertain.
It is informative to show the ratios of stock price now and in early 2022 to various earnings-related measures:
RP Drake
FFO multiples often mislead, and do so here. The FFO multiple is 14x today. The multiple increases as one proceeds from FFO to AFFO to CfO and to the current dividend.
To my mind the meaningful multiple now is 17 to 18, 25% larger than the FFO multiple. And using the early 2022 price the multiple was 30x or larger.
Taking the positive view that the cash earnings will grow at 7% forever, here is how the value of the discounted cash flow looks:
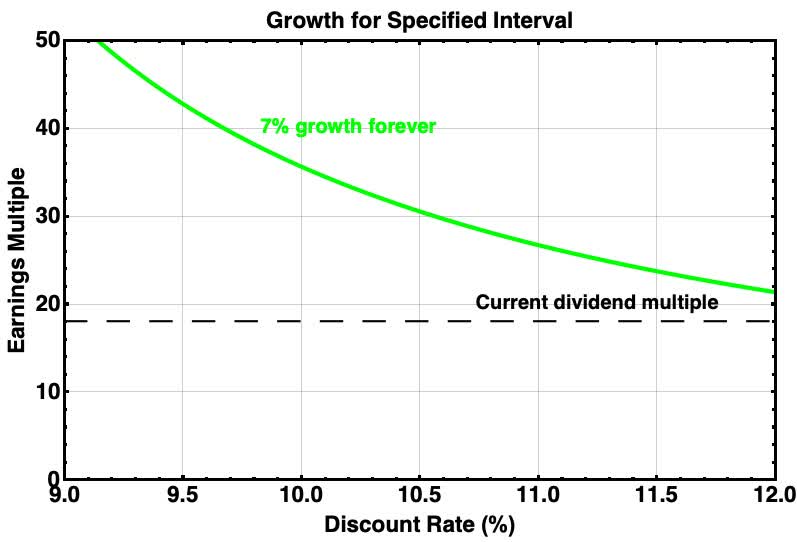
In late 2021 and early 2022, the market was pricing CCI at close to a 7% growth rate forever (6.5% fits better), for the 10% discount rate that often has made sense of REIT prices since 2010 or so.
If you believe that these parameters will represent future valuations, then CCI should double from here. But that 10% discount rate was from an era with 10-yr treasury rates near 2%. If they end up in the 4% to 5% ballpark, one has to think discount rates would increase.
The rapid collapse in the value of distant growth is evident as the discount rate increases toward 12%. If that were the future, thanks to sustained higher interest rates, then CCI would be nearly fully valued now (on this optimistic growth assumption).
The problem is that such high growth rates are very unlikely to continue forever. Benjamin Graham addressed this by coming up with a formula that imposed a larger discount rate for higher growth rates.
Graham described his formula as one that explained a lot of data. It also makes sense to me to value very distant earnings more weakly than relatively near ones.
I discuss that formula and related issues here . From Graham's formula a larger growth rate is valued at a higher discount rate. For a 7% growth rate, the Graham formula gives a value that corresponds to a 12% discount rate.
Another way to look at value here is to suppose that 7% only endured for 25 years. Or worse, that what you get is only 4% for 25 years. Now the picture looks like this:
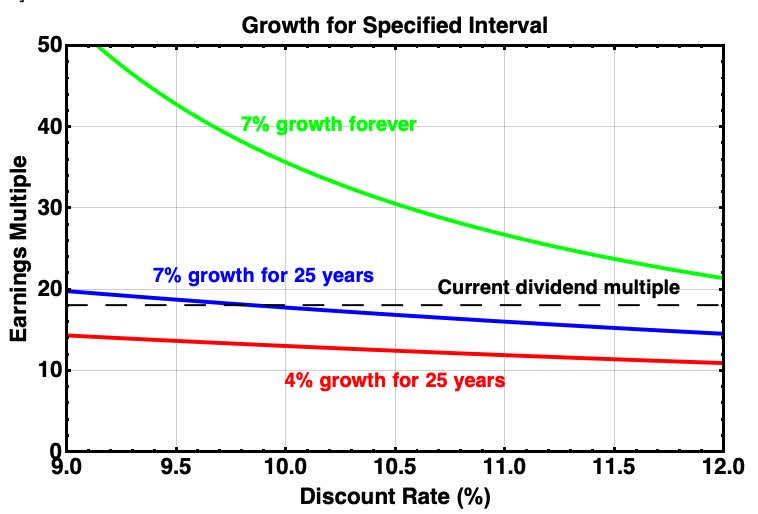
You can see that, for the 10% discount rate and 7% growth rate, fully half the value of CCI would come from earnings after year 25 . If those later earnings netted to zero present value, CCI would be fairly valued now.
And if what will happen is 4% growth for only 25 years, then CCI would clearly be overvalued now. Well, life is full of uncertainties. Here are some numbers extracted from these calculations.
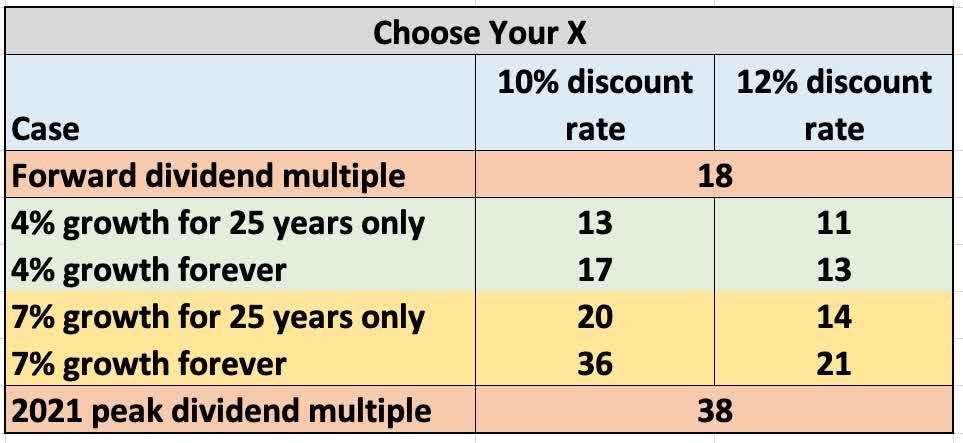
This table makes it easy to see that the current dividend multiple corresponds to achieving 4% dividend growth forever, or getting faster growth for less long. But even 7% growth for 25 years does not get you to the present valuation at a 12% discount rate.
My own personal estimate is that interest rates and discount rates will not stay as high as they are now but are still likely to be higher than they were in the teens. A multiple in the mid-20s would not surprise me.
That would be less than 50% upside from here. But I absolutely could be wrong with that estimate.
Takeaways
Crown Castle is overall a solid company with an interesting business model that should let them grow cash earnings for some decades. How many decades is one question.
The cash earnings growth will be quite rapid (6% or more) if they encounter no headwinds. But there are headwinds at the moment. And with their tenant concentration more may follow.
Headwinds as large as those of the present have been rare in their past and quickly overcome. Even so, one cannot ignore that the growth of CfO per share over the past 8 years has been at a 4% CAGR.
My view is that they will grow at some rate, and will keep raising their dividend. But I am skeptical that they will actually achieve their aggressive and widely promoted target rate of growth.
Unfortunately for me, this study has dashed my hope that CCI had fallen enough to look like a great upside deal today. Instead, the above research led me to conclude that CCI became way, way overpriced in 2021 and has not fallen far enough to have a large margin of safety.
But all is not lost for everybody. The dividend yield today is 5.6%. It is likely to grow at a rate of 4% or more, perhaps after a pause. If this meets your needs, then CCI seems like a good addition to your portfolio.
If I were revisiting my Buy-Hold-And-Go-Fishing REIT Portfolio today, CCI would probably be added. The balance sheet would be a key question: are they a solid blue chip or borderline junk?
On the one hand, my view ends up that CCI probably has some upside from here but perhaps much less than a return to 2021 prices. This is not buying a dollar for 40 cents.
On the other hand, the dividend, at nearly a 6% yield now, seems likely to be sustained and to grow over time at least modestly. That combination plus modest likely upside may or may not work for you.
For further details see:
A Margin Of Safety For Crown Castle