AMRK - A-Mark Precious Metals: Unexpected Way To Bet On Gold
2023-09-08 02:08:50 ET
Summary
- The fundamentals are lined up for another gold bull run. A-Mark offers the upside potential of gold but with capped downside risk compared to gold miners.
- AMRK has a clean balance sheet, a proven track record in consistently growing revenues, and managers with skin in the game.
- I give A-Mark a strong buy rating because it offers excellent business supported by macro tailwinds at a 30% discount.
Thesis
The gold prices at the decade's end will exceed 4000 $/oz. To benefit from the gold bull run, the market offers multiple instruments. We can choose between bullion and gold ETFs or jump into the rabbit hole and buy mining shares. A-Mark Precious Metals ( AMRK ) offers the upside potential of gold but with capped downside risk compared to gold miners. Its business is asset-light and is not exposed to energy price fluctuations, political uncertainties, and geological and metallurgical challenges. Investing in A-Mark, we get maximum Beta exposure to gold and are being paid for that.
A-Mark is a diversified service provider in the precious metals trading industry. The company has a robust balance sheet with sufficient liquidity. The company's revenue and gross profit margins have consistently risen for the last eight years. A-Mark's managers and directors are significant shareholders.
I give A-Mark a strong buy rating because it offers excellent business at a steep discount supported by macro tailwinds.
Rising demand for precious metals
We live in exciting times. Uncertainty arises in geopolitics and the macroeconomy. Precious metals love such an environment. They benefit from the disorder; as Taleb would call them, they are antifragile. The gold price has been rising since the beginning of the century. It reached twice peak levels in 2011 and 2022 and, in the meantime, moves in a wide range.
The fundamentals are lined up to fuel another leg of the gold bull market. The economic metrics, such as growing M2 aggregate and rising debt to GDP, drive the long-term demand. On the other hand, the supply is constrained by a lack of CAPEX and the approaching gold supply cliff . New Tier 1 deposits have not been discovered and developed for the last decade. My scenario is initially for the gold price to reach the $ 2200 - 2500 range in the next 24 months. However, by the decade's end, we might see the gold priced beyond 4000 $/oz.
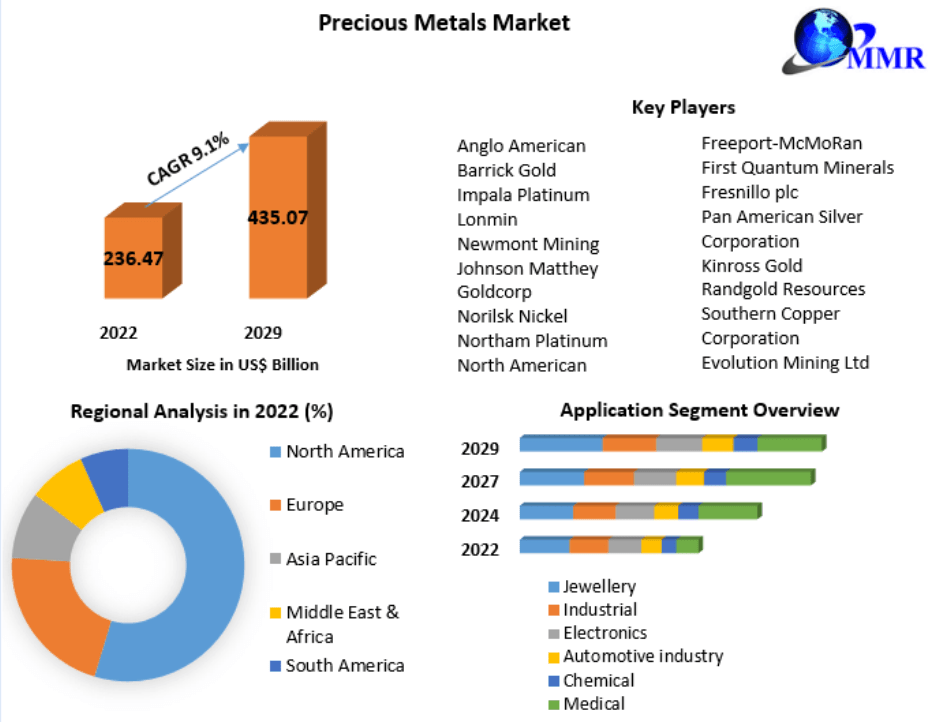
The demand for precious metals is forecasted to grow by 9.1%CAGR till 2029. The chart below from MMR illustrates the growth specifics.
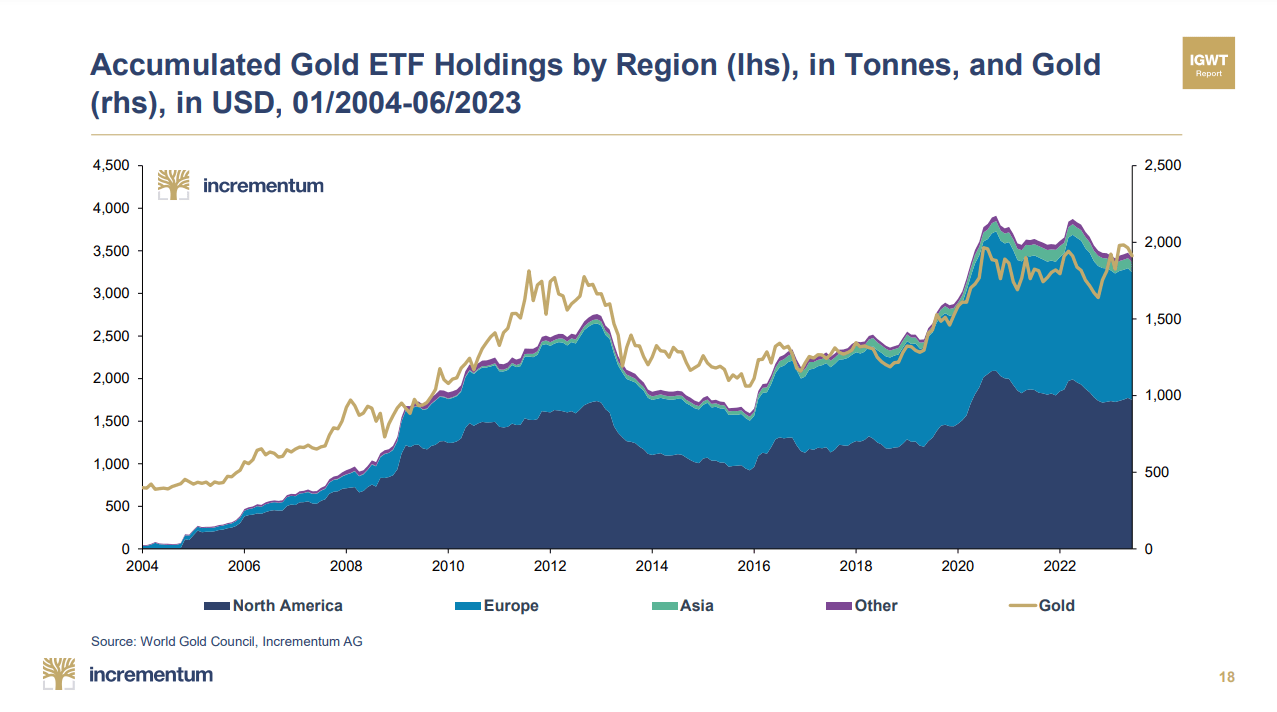
In all segments, the demand will increase at a similar rate. Globally, the market is concentrated in North America and Europe. The newcomers as MENA and LATAM states still lag behind the Far East and the Western world. However, at a fast rate, they compensate for the delay. The chart below from Incrementum shows ETF gold holding by region:
Incrementum Gold Compass August 2023
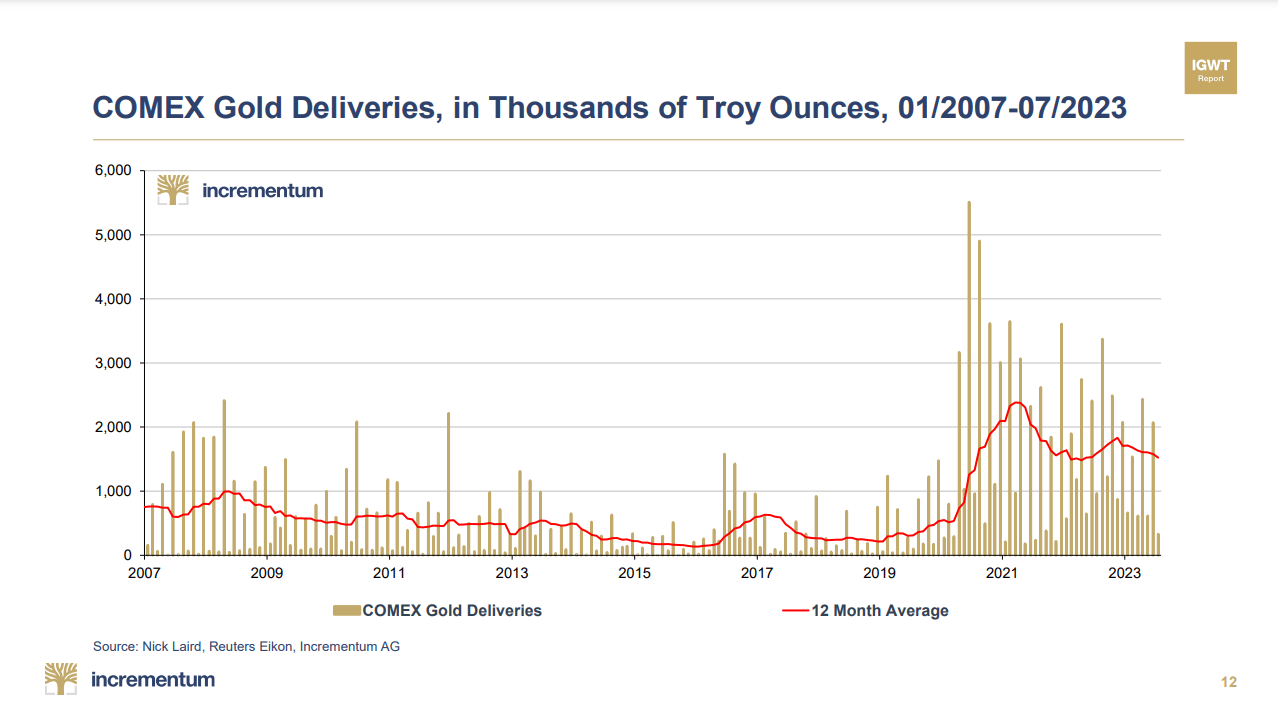
The progress made by Asia and Europe in the last 17 years is apparent. Another overlooked process illustrating the rising gold demand is the COMEX deliveries. They have been rising steadily over the previous five years. The chart below shows the trend:
Incrementum Gold Compass August 2023
The consistency is impressive. The 12-month average has been significantly higher than in the past two decades. For the last several years, the Central Banks across the globe have also been active participants in precious metal markets. They have increased their gold reserves with regular purchases. Many European Central Banks requested their gold to be repatriated from Fed's custody to their vaults.
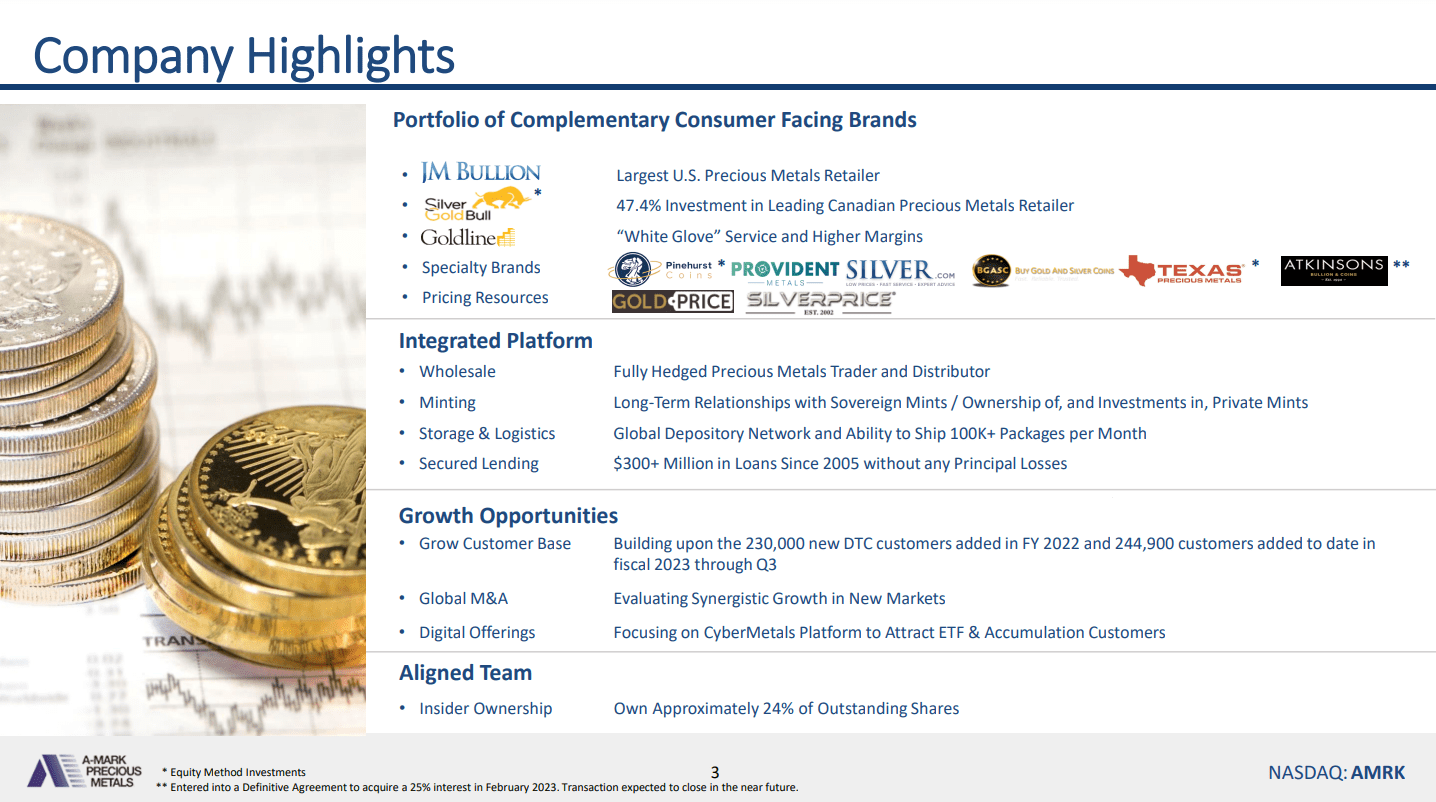
Company Overview
A-Mark is a diversified service provider in the precious metals trading industry. The image below from the last corporate presentation shows the company operations:
A-Mark has a few revenue streams:
- Wholesale of precious metals, including gold, platinum, and silver in all shapes and sizes
- Direct to customers sales
- Minting platforms
- Logistics and securities
- Lending operations
A-Mark sells wholesale goods to merchants and institutional customers. Historically, wholesale segment margins averaged over 2%, compared to less than 1%. Due to the enormous supply and demand variations, predicting margins from quarter to quarter is challenging.
What I like about A-Mark is its expansion in precious metals retail sales. The everyday investors has started to realize the importance of owning gold and silver. The pandemic was the catalytic event. All bullion dealers were short of inventories. A-Mark made acquisitions, thus reaching a more extensive customer base. JM Bullion, the largest precious metals retailer in the US, is included in its portfolio, and Silver Gold Bull is one of the largest in Canada.
Cyber Metals is a platform developed by A-Mark and JMB. The quote below from the company's announcement briefly explains Cyber Metals.
Leveraging the core strengths of A-Mark and JMB, CyberMetals is an innovative online platform that digitizes large gold, silver, and platinum bars and allows consumers to buy and sell fractional shares of these bars in a range of denominations. The platform will support accumulation-type programs where customers acquire precious metals at pre-defined intervals and more opportunistic purchase and sale transactions.
In my opinion, the app will significantly improve A-Mark's customer reach. It will attract Gen Z customers who are tech-savvy. Long-term Cyber Metals might turn into another established revenue stream for A-Mark.
The directors and managers own company shares. The image below from Market Screener illustrates the large shareholders:
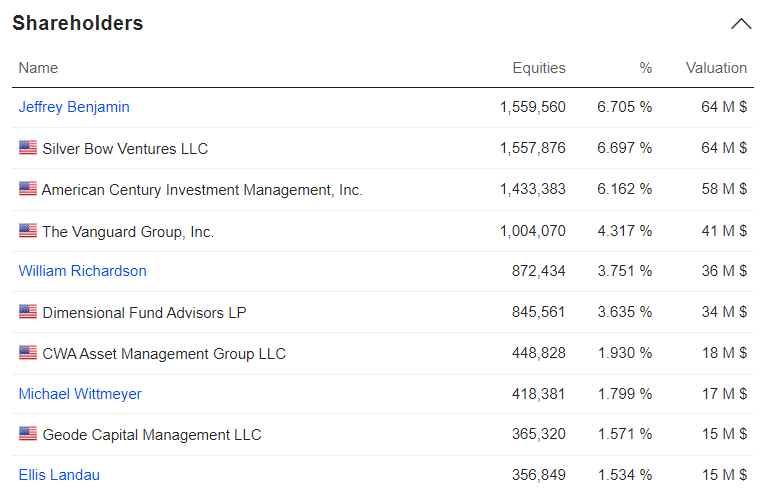
Investing means trusting the company's managers. No skin in the game says a lot to me. A-Mark is an excellent example of high ownership among managers and directors.
Company Financials
A-Mark has strong financials. The table below shows the company's liquidity and solvency metrics. The data is from the company's last financial report .
| EBITDA/ Interest Expenses |
| 10.3 |
| Quick ratio |
| 0.19 |
| Current ratio |
| 1.36 |
| Net debt/EBITDA |
| 3.26 |
| Long-term debt/Equity |
| - |
| Total debt/Equity |
| 115% |
| Total liabilities/Total assets |
| 61% |
The numbers are good enough for me. A- Mark is not overloaded with debt and has enough cash flow to cover its debt obligations. The image below shows the company's balance sheet:
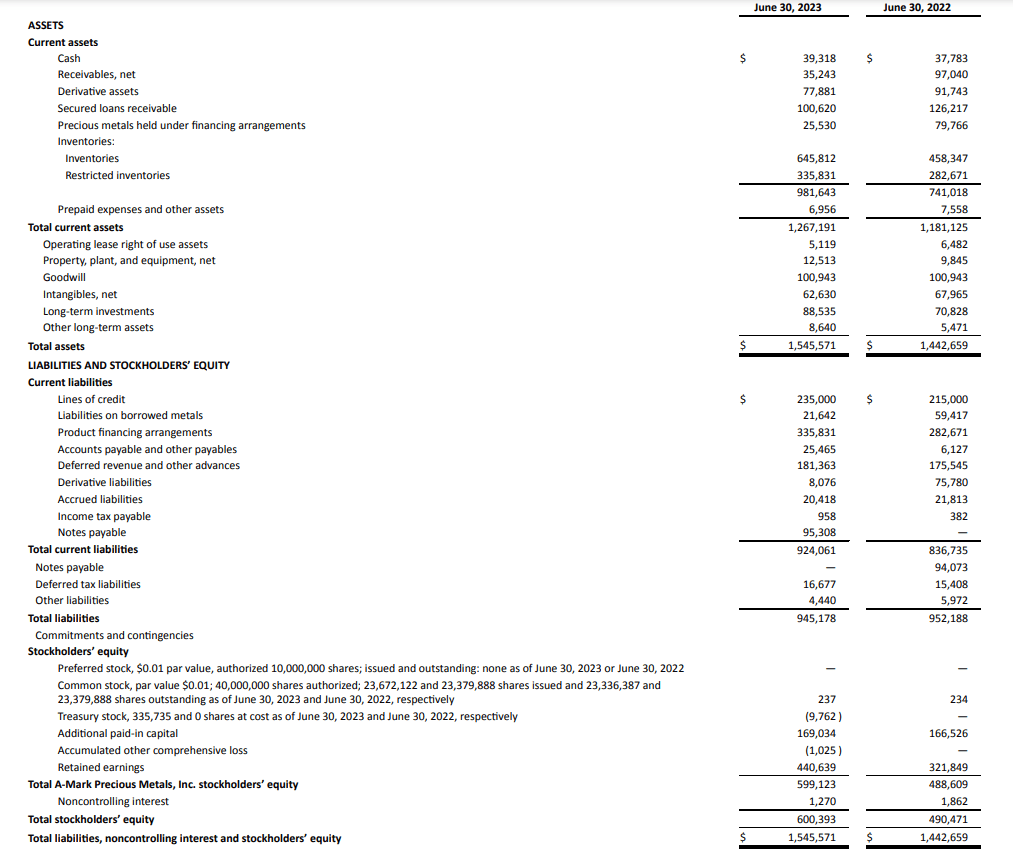
A few things I like about that business model: The first is the domination of liquid assets. The company owns $ 645 million in inventories (ex-restricted inventories). They could easily be liquidated without steep discounts hurting the company's solvency. Intangibles and goodwill constitute 10% of A-Mark's assets. Both are difficult to quantify; hence, our NAV estimate could be far off. It is nice to see such prudent levels in service-based business.
On the liabilities side, the company does not hold long-term debt. It uses product financing agreements and revolving credit lines to fund its operations. Both provide flexibility and could be withdrawn when needed.
The revenues have been rising for the last three years. The SG&A expenses came up, too, due to inflation pressures. The company earnings are still below the levels of 2021 due to the increased expenses.
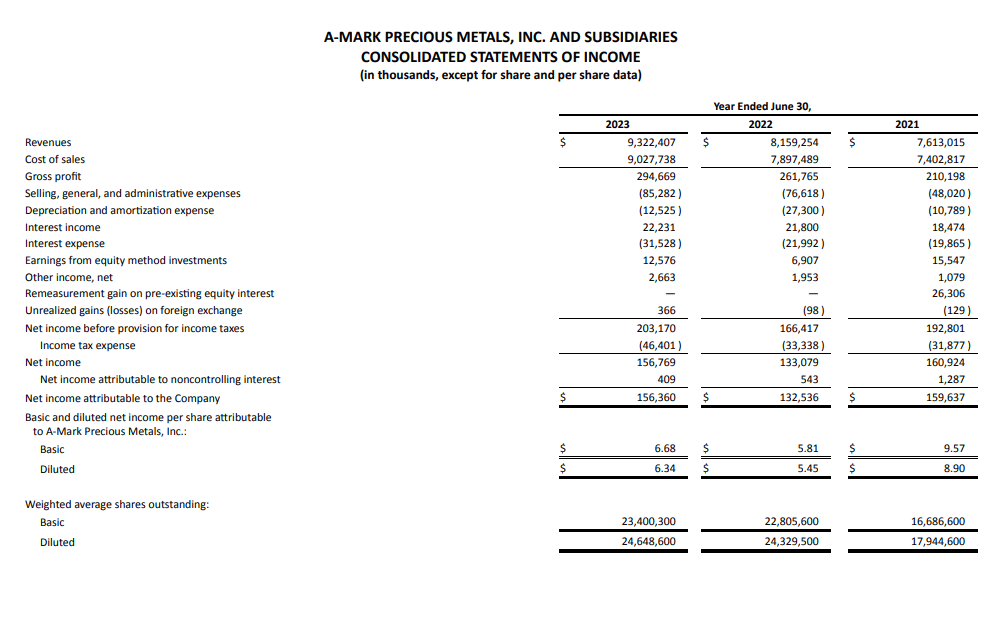
The last numbers are not an exception. The company has managed to grow its yearly revenues for eight years. The chart below shows the company's line since its IPO in 2014.
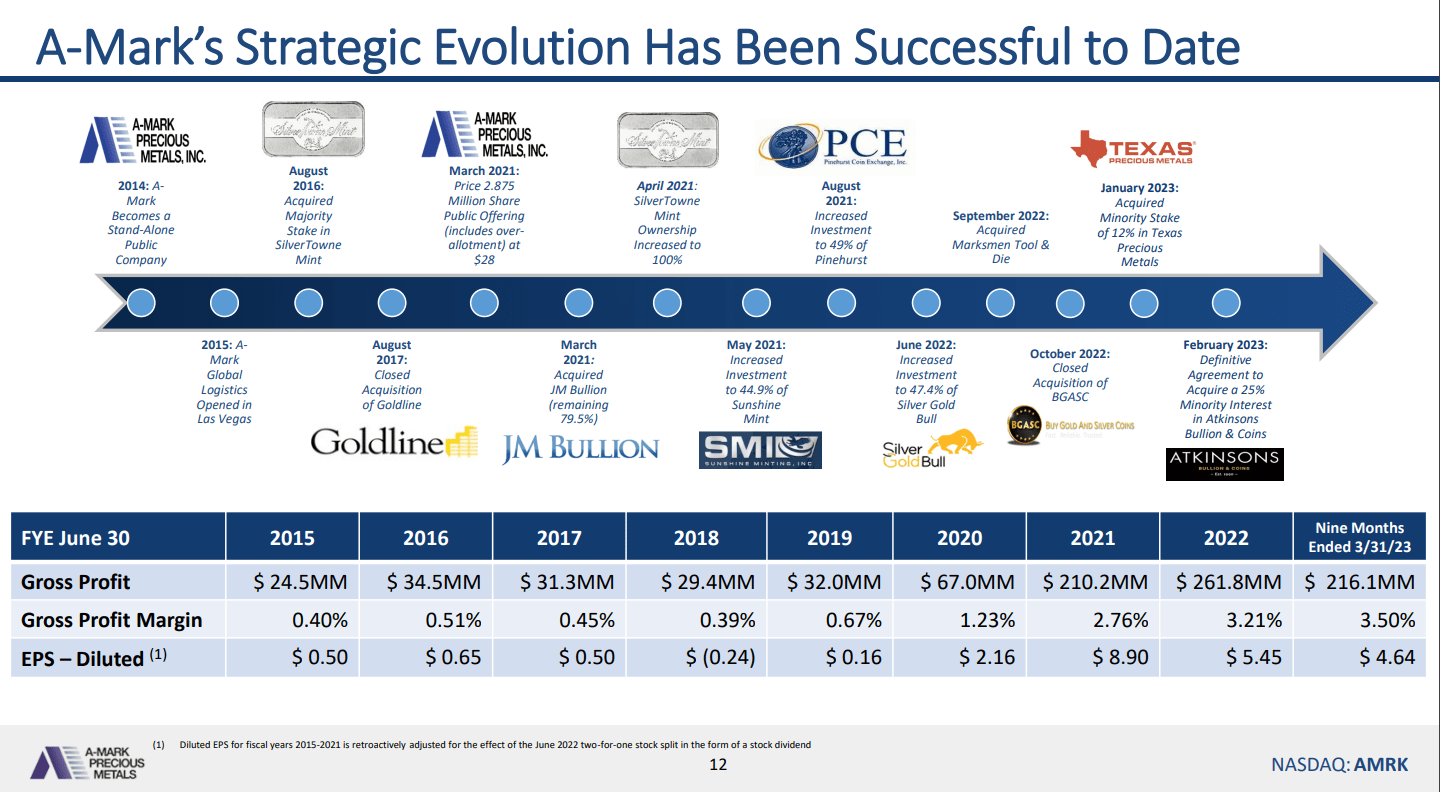
It is impressive to see the growing revenues have been translated into higher margins and EPS. As discussed above, efficient acquisitions were a primary driver, expanding the company's ability to cross and upsell its products.
| Free cash flow/EV |
| 1.2% |
| Sales/EV |
| 600% |
| Gross Margin |
| 3.5% |
| FCF margin |
| 0.74% |
| ROI% |
| 10.3% |
| ROE% |
| 28.7% |
| Net income per employee |
| $ 410,390 |
The table above illustrates company profitability metrics. The data is from the last report, Q2, 2023. The margins are very low in the precious metals trading industry. A-Mark management has done a great job gradually increasing the gross profit margin from 0.4% in 2015 to 3.5% in 2023. Net income per employee has improved too for the same period. Those numbers are a substantial achievement in a challenging environment for precious metals prices.
A-Mark traditionally distributes dividends. The image below shows dividend metrics:
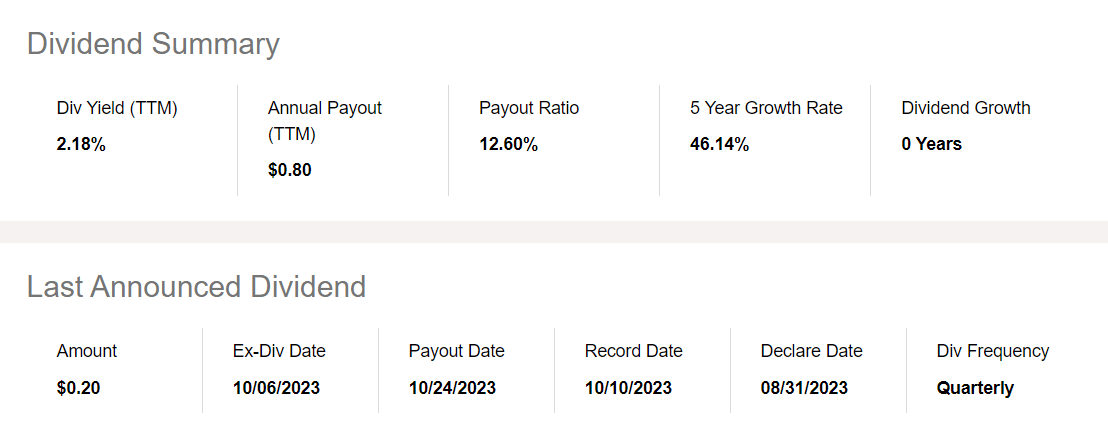
It maintains a low payout ratio, which is a positive sign. That means the company can maintain its dividend policy without adversely affecting its liquidity. Another benefit is quarterly distribution and dividend growth.
Valuation
At this point, I will calculate the intrinsic value of A-Mark. For this purpose, I use a 2 Stage Discounted Free Cash Flow Model by Professor Damodaran. For equation inputs, I use his database and Seeking Alpha.
Assumptions and inputs:
- Risk-free rate is equal to the 5Y average of US long-term Government bond Rate - 2.2%
- Perpetual growth rate, g, is equal to the 5Y average of US long-term Government bond Rate - 2.2%
- US equity risk premium is 9.6%
- Gold miners Beta 1.1
- A-Mart debt to equity ratio 115%
- A-Mark effective tax rate 22.8%
The above parameters are inputs in the following steps:
1. Calculate Levered Beta with the formula below:
Levered Beta = Unlevered Beta * (1+D*(1-T)/E)
2. Calculate the discount rate (discount rate as the cost of equity) using the resulting value for leveraged beta. The formula I use is:
Cost of Equity = Risk Free Rate + (Levered Beta * Equity Risk Premium)
3. Stage 1: I calculate the present value of discounted free cash flows for ten years using 2024 and 2025 FCF estimates from Market Screener . I assume the FCF will grow at a stable rate of 2.2%.
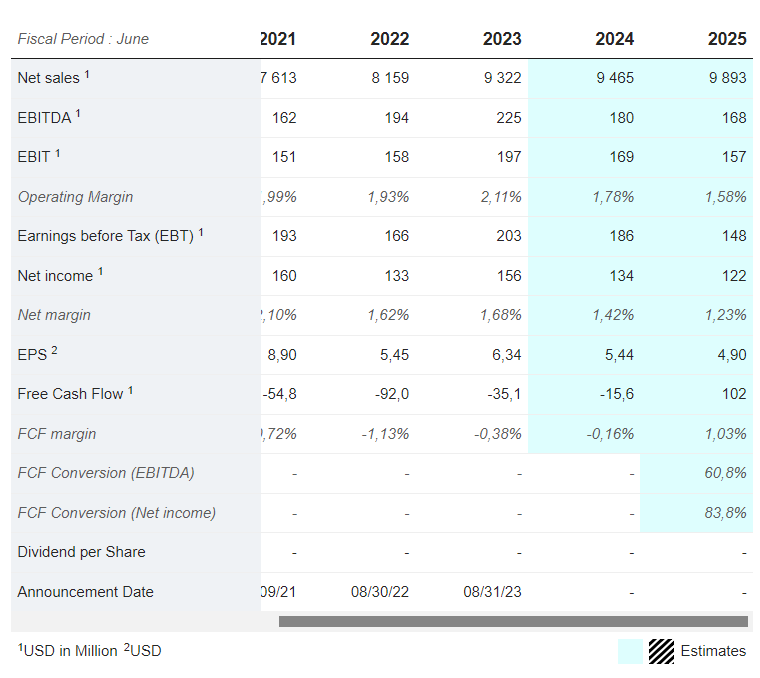
4. Stage 2: Calculate the Terminal Value of the free cash flows over ten years at stable growth into perpetuity, g, and the resulting discount rate. Then, calculate the present value of the Terminal Value:
Terminal Value = FCF 2033 × (1 + g) ÷ (Discount Rate - g)
Present Value of Terminal Value = Terminal Value ÷ (1 + r) 10
5. Sum the final results of stage 1 and stage 2. Their sum is called the Total Equity Value (TEV);
Total Equity Value = Present value of next ten years cash flows + Terminal Value
6. Divide the TEV by the total number of company-issued shares. The result is the intrinsic value of the acacia, which I compare against the current market price.
For A-Mark, I get the following results:
Levered Beta = 1.2
Discount Rate = 8.2%
Total Equity Value = $ 1,196,000,000
Total shares outstanding = 23,000,000
Intrinsic value per share = $ 52.0
Current market price = $ 35.80 (as of Sept 07, 2023)
To value A-Mark is difficult because its competitors are not public companies. I will weigh A-Mark against its peers from Specialized Finance (Acacia Research (ACDG) and SWK Holdings ( SWKH ) )and mid-size gold miners (Hecla Mining Company ( HL ) and Coeur Mining ( CDE )). The latter have an asset-heavy business model and carry a lot of risk not inherent for A-Mark. While specialized finance companies might have clean balance sheets, they differ widely in business models.
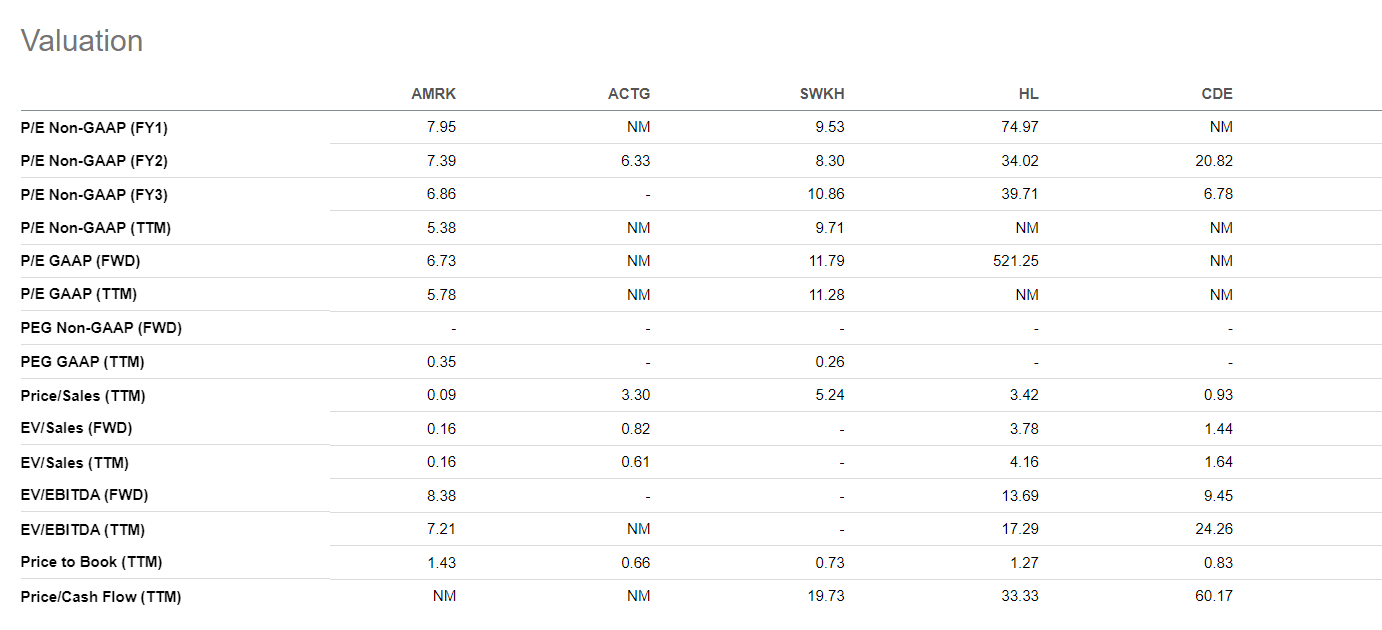
Ratios with sales in the denominator are useless for valuing AMRK because precious metals services have single-digit gross margins, unlike specialized financiers or gold miners. I use P/B and P/E in that case, despite their drawbacks. The latter is the most unreliable of all the metrics. Too often, the earnings are subject to accounting gimmicks. The book value, especially for A-Mark, could be estimated with a high degree of certainty because the company holds precious metals, cash, and derivatives with exposure to precious metals in its balance sheet.
A-Mark is undervalued compared to financiers and miners based on all P/E ratios while using P/B, the company is overvalued. In conclusion, the company offers a 30% margin of safety based on DCF calculations - a rare occurrence for such a high-quality business.
Risks
A-Mark carries the following risks: economic, liquidity, credit, and operational risk. The financial risk is related to interest rates and rising bond yields. The chart below shows the correlation between gold prices and 10-year US Treasury real yields (inverted).
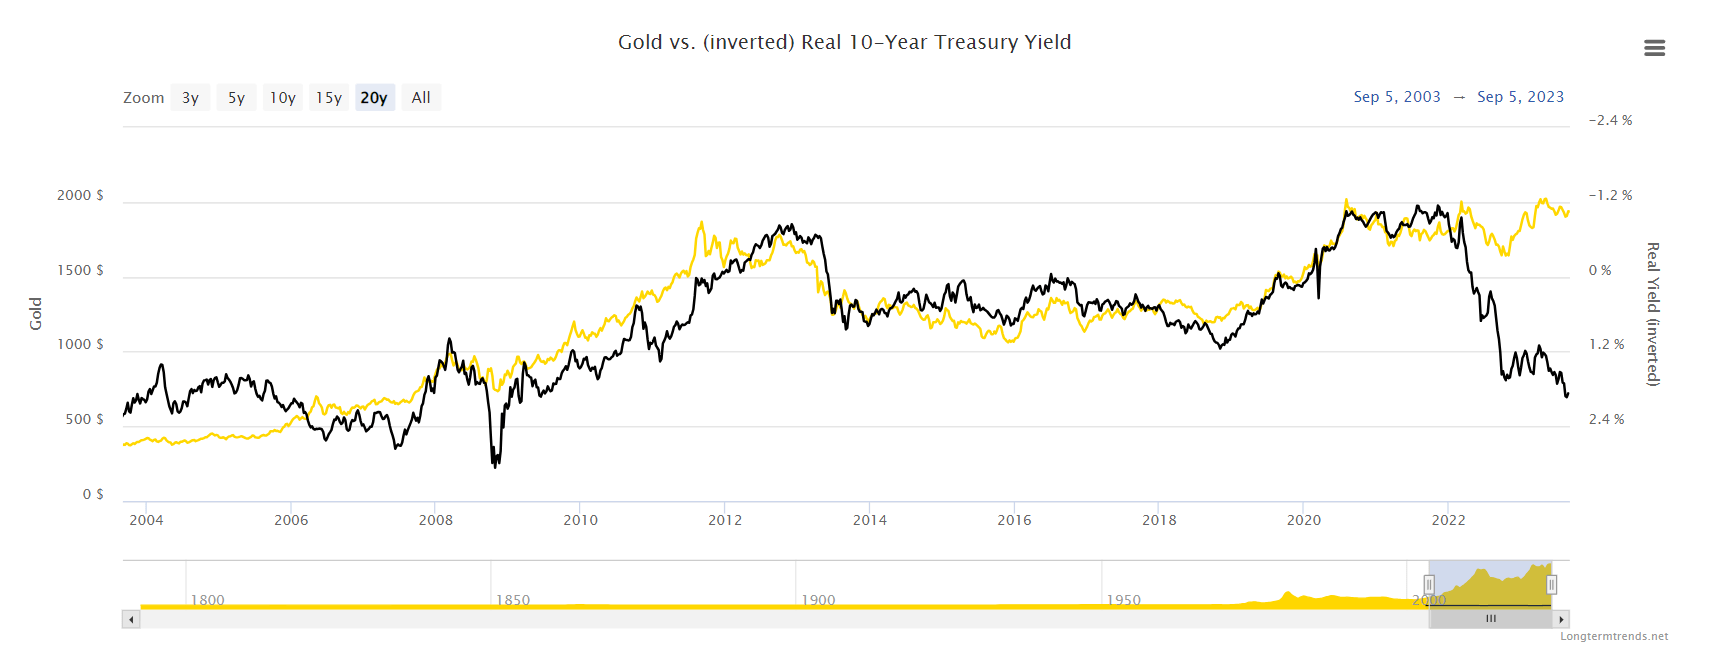
Both variables are inversely correlated. The gold is down when the yields are up, and vice versa. But that is a too simplistic explanation. We subtract the inflation from the nominal rates to obtain the actual rates. The current decade will be dominated by structural inflation. ZIRP will remain in the past, and the correlation between the rates and gold prices will become more insignificant.
As seen on the chart for the first time since 2019, we have positive real yields. During that period, gold has been moving in a large consolidation. It broke unsuccessfully twice the resistance at 2000 $ per ounce during the pandemic in 2020 and April 20222.
A-Mark is exposed to liquidity and credit risk because it is involved in precious metals landing and funds its operations with revolving credit lines. The liquidity risk is the inability of the borrower to cover its debt obligations on time. A-Mark is highly liquid, thus significantly reducing the liquidity risk.
The credit risk is the company's counterparties' inability to pay its debts. A-Mark has a portfolio of loans valued at $100 million on 30 June 2023. The table below shows the loan structure:
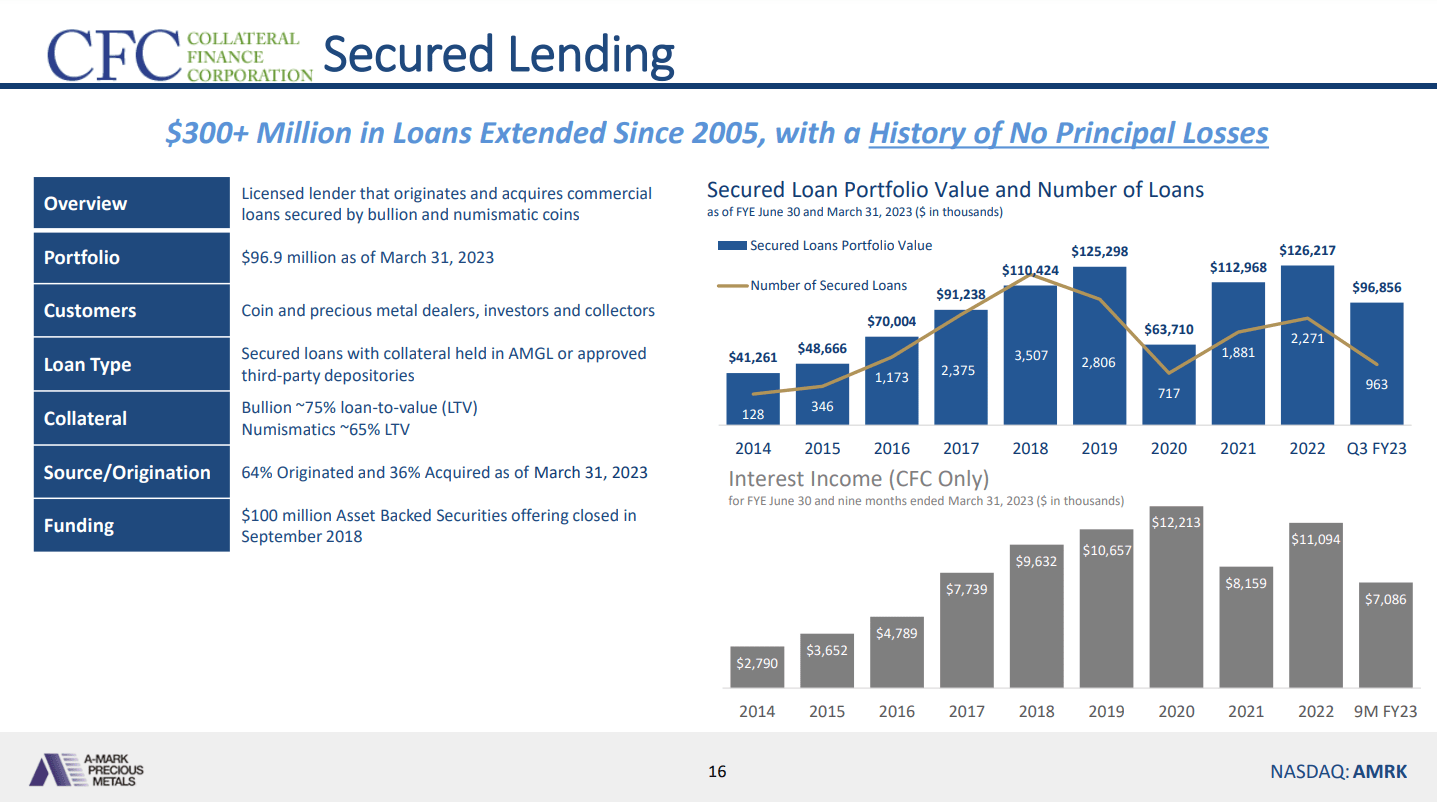
The company has sufficient buffer because the collateral for bullion is 75%, and for numismatics, it is 65% Loan to Value (LTV). On the other hand, A-Mark's borrowers are exposed to lower default risk.
Considering the diverse operations included in the A-Mark portfolio, the operational risk is a factor we cannot ignore. Unfortunately, we can quantify and mitigate its impact. Operational risk is related to the company's processes, which depend on leadership capabilities and corporate culture.
Conclusion
A-Mark is a solid business Mr. Market offers for 70 cents per dollar. It has a clean balance sheet, a proven track record in consistently growing revenues, and managers with skin in the game. The macro tailwinds line up for a long-term gold bull market. Being a precious metal merchant, A-Mark will benefit significantly while offering downside protection, unlike the gold miners.
For further details see:
A-Mark Precious Metals: Unexpected Way To Bet On Gold