QVMS - A Sheep In Wolf's Clothing
Summary
- If what you care most about is the long-term real spending power of your wealth, then that should be your benchmark for assessing the risk of different investments.
- It has long been acknowledged that the volatility of real corporate earnings is much lower than the volatility of the price (or present value) of the stock market.
- So, measured against the benchmark of the long-term real spending power of your wealth, investing in the stock market is considerably less risky than it appears from the conventional perspective.
It's easy to overlook the fact that, in thinking about investment risk, we are implicitly making a choice about the benchmark against which risk is measured. It's a convention, which we often take for granted, to use our local hard currency as the risk-less benchmark - but this choice, while very convenient, also can be misleading.
Let's take the case that what you really care about is what you can buy with your wealth over your lifetime. You're 50-years-old and you can purchase an investment in your brokerage account, with a solid government guarantee that pays one dollar each year for the next 50 years and is adjusted for inflation in the exact goods and services you want to buy. That's a "real annuity" - right now, you can buy it for $40, but the price is always fluctuating as supply and demand drive changes in real interest rates. In fact, one year ago, the price was way up at $65 - and so, had you bought it then, your brokerage statement would now be showing a loss of about 40%. 1 Is this a risky investment?
The present value price of the real annuity fluctuates (wildly, in this example) while its long-term spending power remains constant. If you have a short horizon, it's definitely risky - but, in terms of your personal spending that can be supported by buying the annuity and holding it, there's no risk. Similarly, the spot prices of US inflation-protected bonds - TIPS - fluctuate a lot, but since they can be assembled into a portfolio similar to a long-term real annuity, they're not very risky at all if you're primarily concerned with supporting your long-term real spending.
What about the stock market ( VTI ) ( VT )? We know that stock markets fluctuate pretty significantly year-to-year, often varying from base-case returns by 20% or more. When we measure the long-term realized volatility of the stock market, we get estimates for the annualized standard deviation of returns in the 16% to 20% range for most broad markets in major currencies - but what if we thought about investing in the stock market from the perspective of our long-term real spending power, where real annuities and TIPS are essentially risk-free? How much would that change our assessment of stock market risk?
It's hard to know the exact inflation-adjusted payments you should expect from a long-term stock market investment, but one estimate you could use is the Cyclically-Adjusted Earnings Yield, which suggests that your long-term spending which can be supported by the stock market is directly connected to average 10-year earnings. 2 With this in mind, the chart below shows changes in US stock market earnings compared to price changes, decade by decade, for the past 140 years. 3 What we see is that earnings have been about one-third as volatile as stock prices: 7% volatility for earnings and 20% for market prices. Note that this difference in perspective is quite distinct from having a short-term vs. long-term investment horizon. When we compare changes in earnings vs. changes in stock prices, in both cases we are looking at a relatively long ten-year horizon.
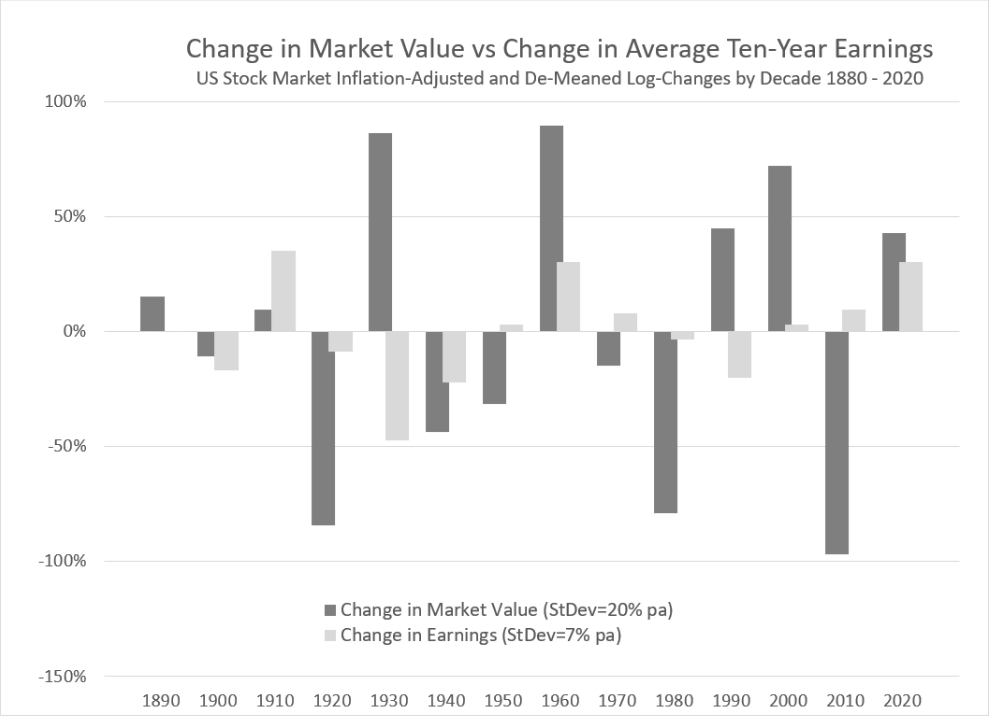
The recognition that stock prices are much more volatile than expected long-term earnings is not new. It was presented at least as early as 1980 by Robert Shiller in his seminal paper "Do Stock Prices Move Too Much to be Justified by Subsequent Changes in Dividends?" 4 and is also at the heart of the long-debated "Equity Risk Premium Puzzle". These days, most market scholars believe that stock market volatility arises mostly from changes in how much people value future earnings, rather than from changes in the expected future earnings themselves. 5 Thus, if you're focused on your long-term spending power and view a real annuity as your riskless benchmark, you will also find equities considerably less risky than their price volatility would suggest.
p.s. We should keep in mind the very severe limitations of using US experience in predicting the future. It is just one path that history could have taken, and in the above analysis, it only provides us with fourteen observations of ten-year average earnings. 6 Taking a long-term view, we must recognize that any given stock market is always in some danger of a total wipe-out in both price and earnings, as experienced by investors in Russian and Chinese stock markets in the 20th Century. The best protections against this important, existential risk are global diversification, the avoidance of leverage, and the sensible sizing of your global stock market risk against your personal benchmark.
- This is because long-term real interest rates in the US have risen from about -1% a year ago to +1% today.
- A variety of corporate-growth models can produce the result that real equity returns will be centered around the earnings yield. One basic condition under which real returns will equal the earnings yield would be if company earnings can grow with inflation with all earnings paid out currently to shareholders. While these models are all caricatures of the real world in a variety of ways, they nonetheless provide a solid starting point for thinking about expected stock market returns and making sense of long-term historical data. For a more up-to-date evaluation of CAPE as a predictor of real equity returns, particularly assessed in non-US equity markets, see Keimling (2016). They conclude: "Existing research indicates that the cyclically adjusted Shiller CAPE has predicted long-term [real] returns in the S&P500 since 1881 fairly reliably for periods of more than 10 years." Furthermore, the results of this paper indicate that this was also the case for 16 other international equity markets in the period from 1979 to 2015.
- Using data kindly provided by Professor Robert Shiller.
- For example, see Mehra and Prescott (1985) and Grossman and Shiller (1981).
- See John Cochrane's 2010 AFA Presidential address, " Discount Rates " for an excellent, broad survey of the topic.
- The 95% confidence interval on the sample standard deviation measured from a sample size of 14 observations is about +/-40% of the sample standard deviation. If we believed that we were drawing from a stationary distribution (which we don't), the 95% confidence interval on our estimates of the volatility of earnings and stock prices would be roughly 4%-10%, and 12%-28%, respectively.
For further details see:
A Sheep In Wolf's Clothing