HIBL - A Technical Check-Up On The Stock Market (Technical Analysis)
2023-04-19 11:02:14 ET
Summary
- The long-term primary trend has been bullish since 2009, and remains so.
- The S&P 500 is bouncing off the bottom of the latest fractal trading-range and is setting up to hit new highs later this year.
- The very short-term outlook is pointing to market weakness this week (tax-collection week).
- We will be adding to our longs during this weakness.
From a fundamental perspective, the debt-ceiling remains a fiscal and psychological drag on the stock market until the political and economic self-harming ends, but for now the spending can continue thanks to the Treasury cash balance (TCB) and the "extraordinary measures" available to the Treasury.
In this piece, we are looking at the stock market from a strictly technical perspective.
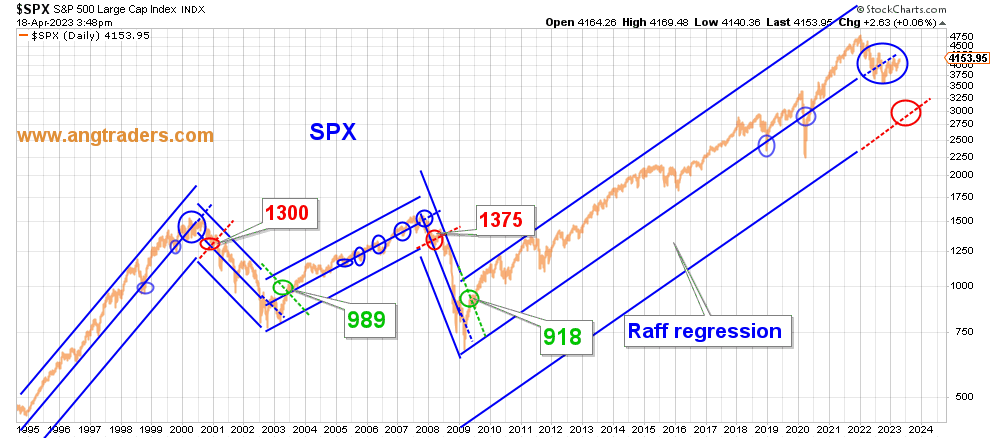
In the very long term (years and decades) , the SPX continues to ride the mid-line of the Raff regression higher like it has done many times in the past 30-years without falling into a "full-frontal" bear market (blue-ovals below). The common belief that a 20% pullback defines a bear market, is arbitrary and not backed up technically; a break below the lower Raff regression line (red-ovals below) is required for technical confirmation of a bear market.
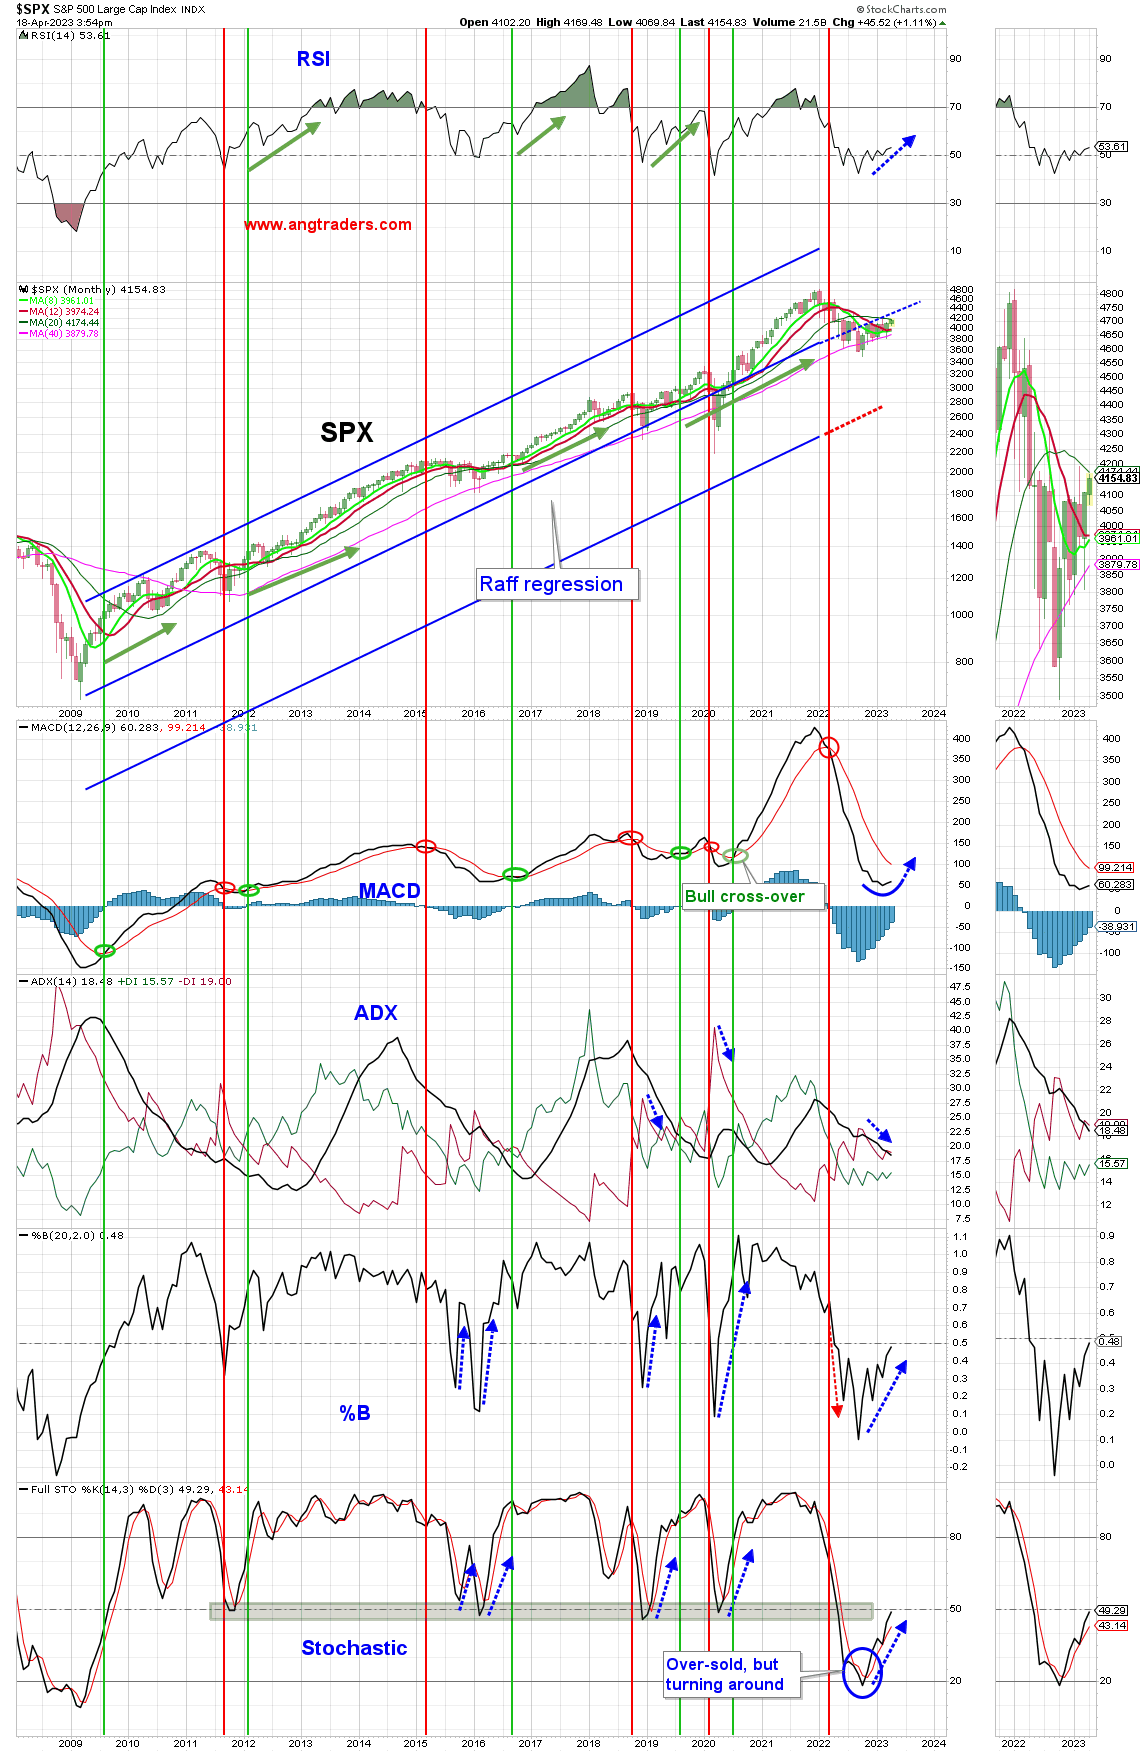
A closer view shows the SPX is above both the 40, 12 and 8-month moving averages, and the technicals are recovering from oversold levels.
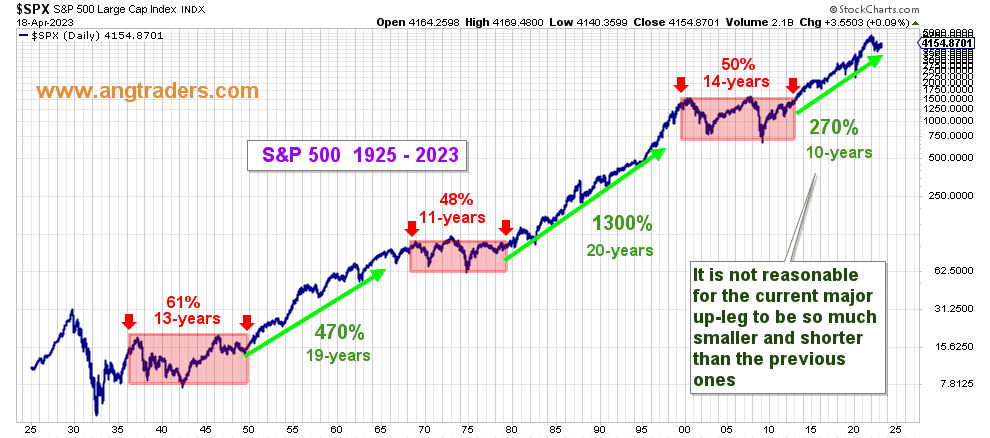
Over the last 100-years, the stock market displays a "step-like" pattern of trading-range periods (steps, highlighted in purple) that last ~12-years, punctuated by rallies (risers) that last ~20-years. Currently, we are nine years into one of these major rally periods, which suggests that we are only halfway through this major bull market (chart below):
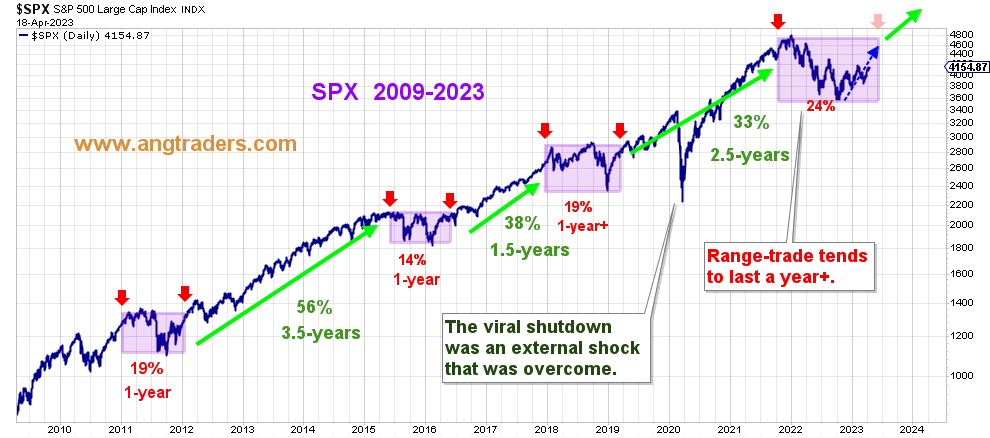
Closing in on the last 9-years, we can see that there is a fractal replication of the "step-like" pattern, where trading-range steps last ~1-year and intervening rallies last 2-3-years. According to this pattern, the SPX is climbing away from the bottom of the trading-range and should break out into new highs later in 2023 (chart below).
Turning now to a shorter time-scale (days and weeks), the weekly-SPX has remained above the Raff upper-line, broken above resistance at the 50-week MA, and is in the 4100-4300 resistance zone (grey area below). We expect some hesitation before it breaks above this resistance (Black-arrows on chart below).
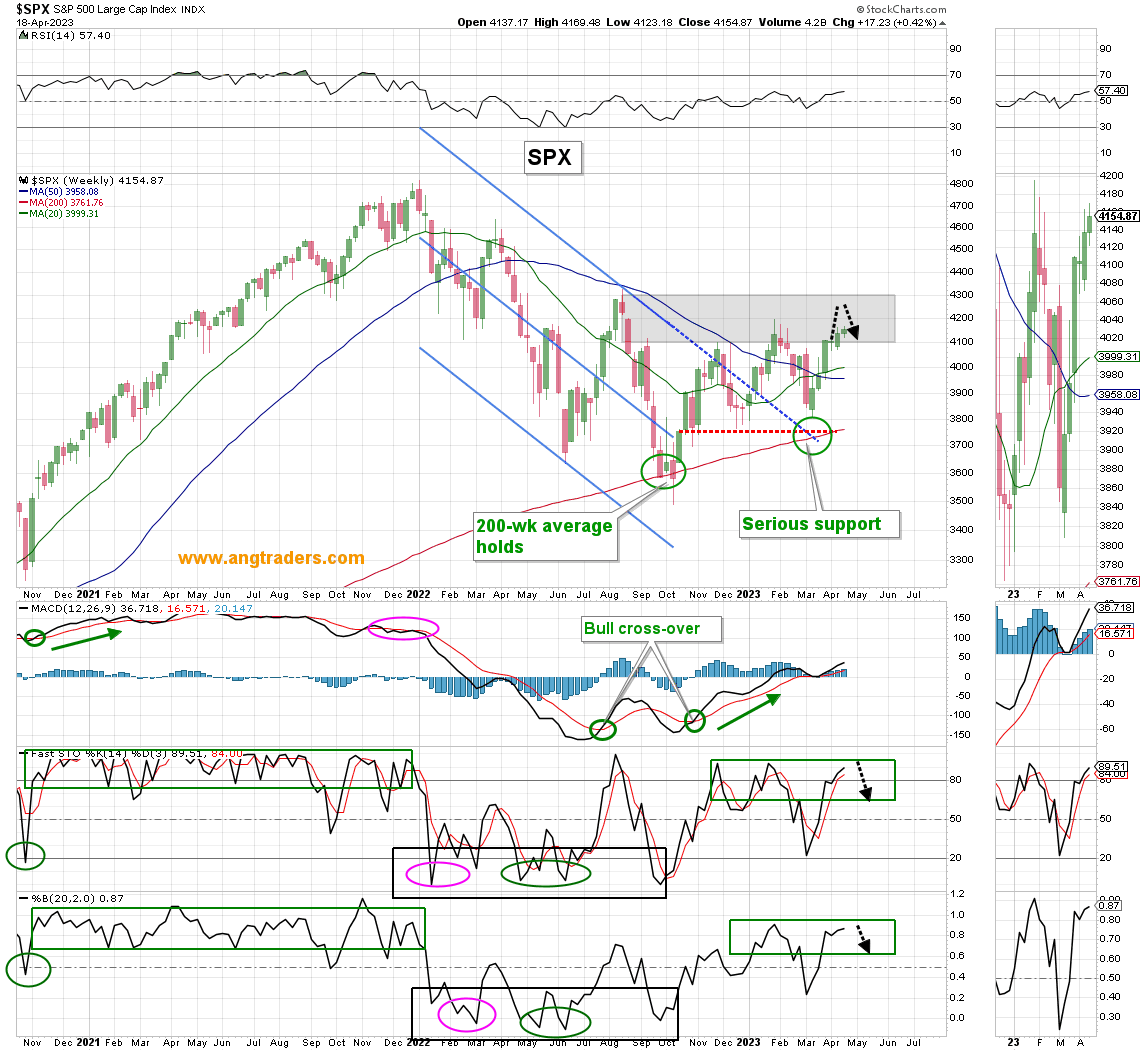
At the daily-scale, the SPX has remained above the 200-day and 50-day MA, and above the lower channel trend-line. The index is approaching resistance at 4200 (the February high) and the momentum technicals are elevated, which means we could get a "buy-the-dip" opportunity this week around the tax-collection (red-arrows on chart below).
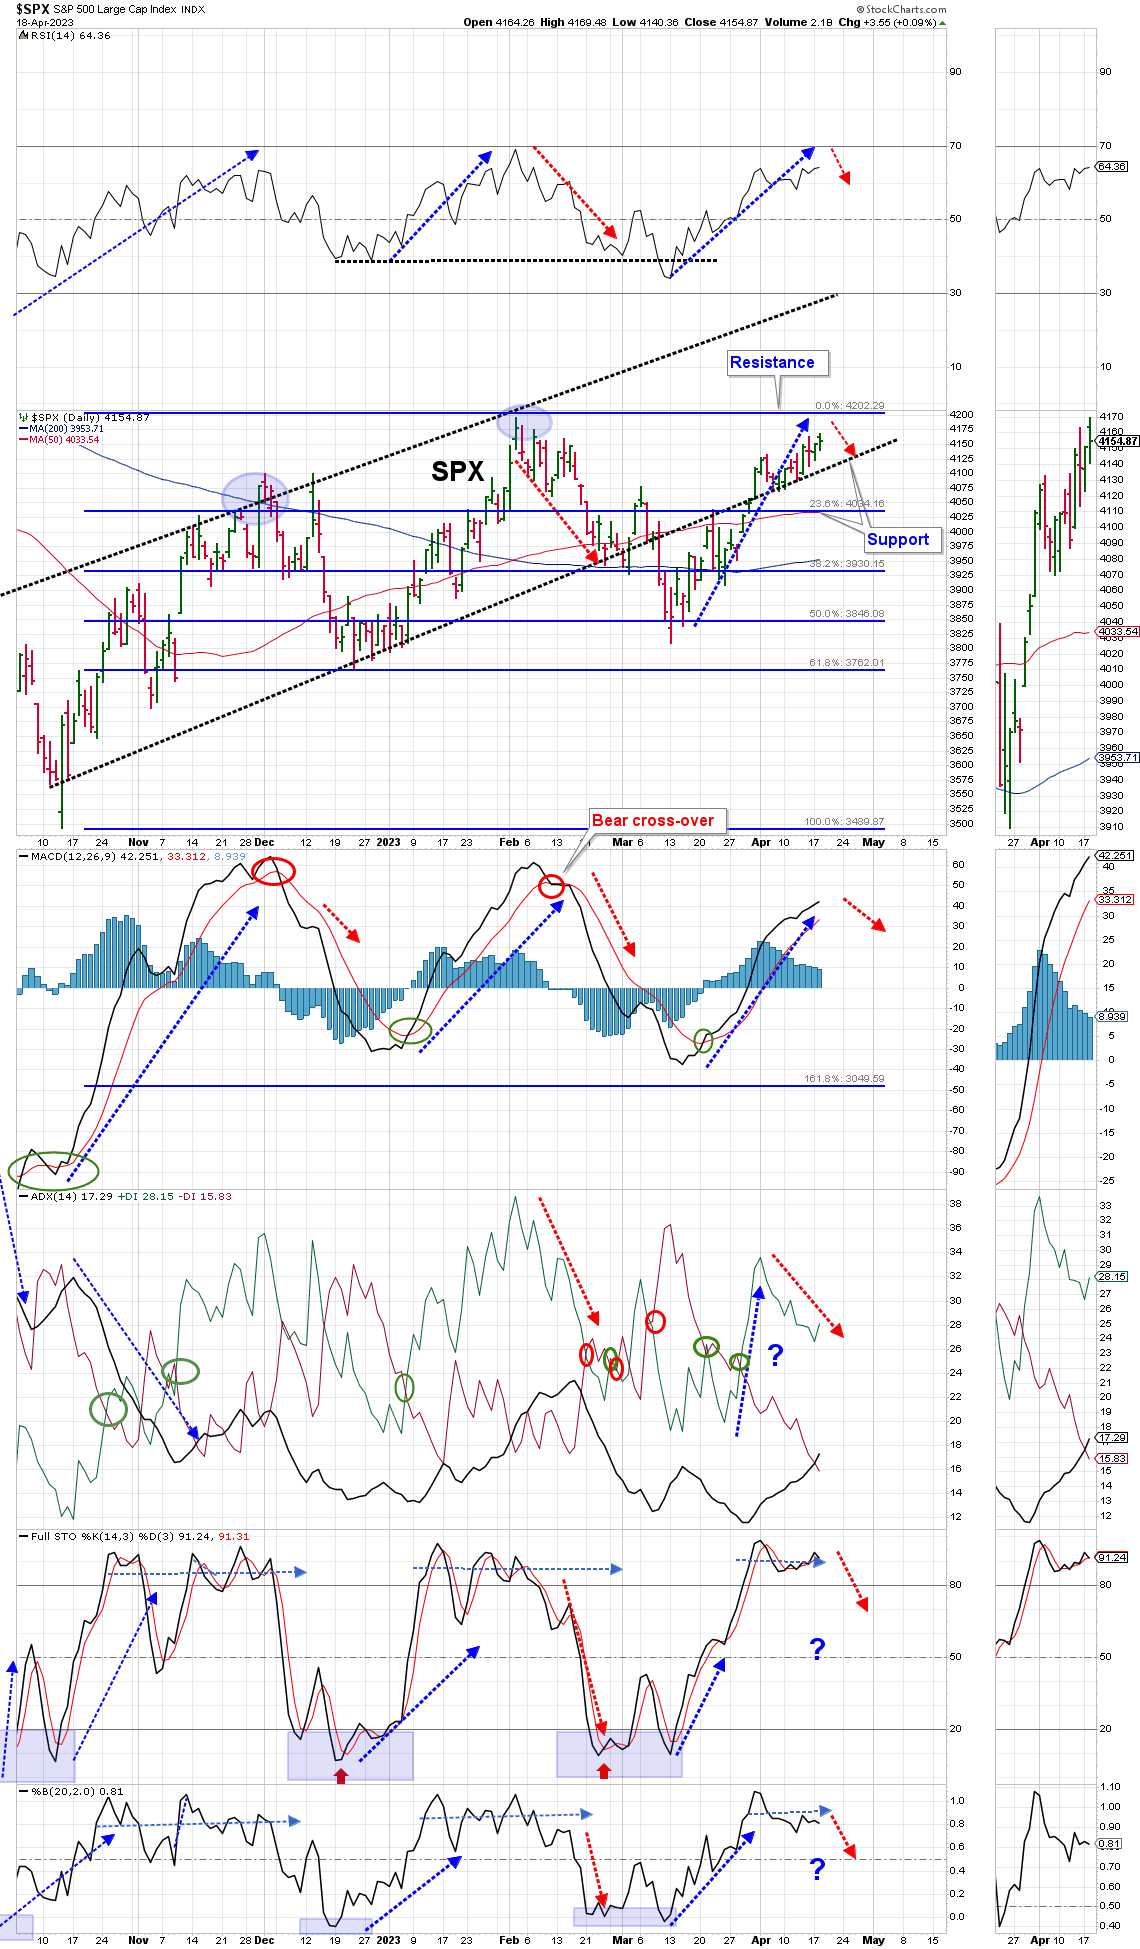
The thrust has dropped out of the topping-zone (blue-area), but it has a distance to go before it reaches the bottoming-zone (red-area). Normally, the SPX moves lower along with the thrust, but so far it has continued to move higher. Of course, this being a tax-collecting week means we could still see a drop in the SPX (chart below).
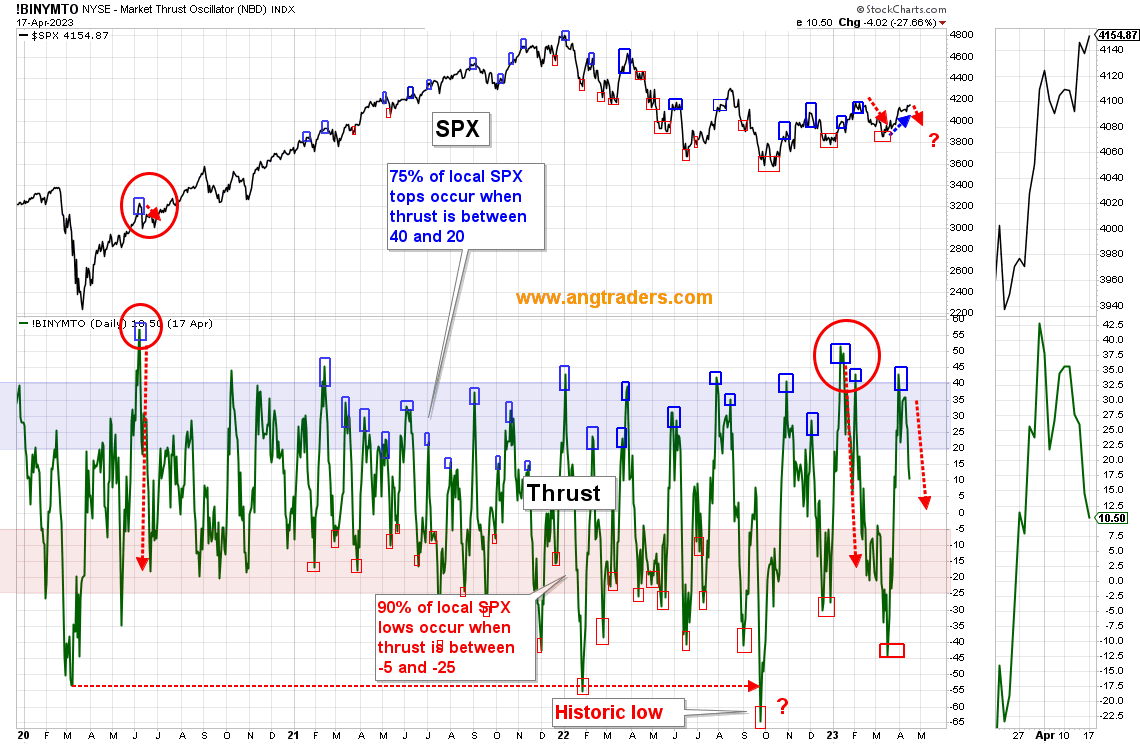
The IT volume oscillator RSI has crossed above 70 which means the chances of a pullback in the SPX have increased, although there is room for it to rise further (chart below).
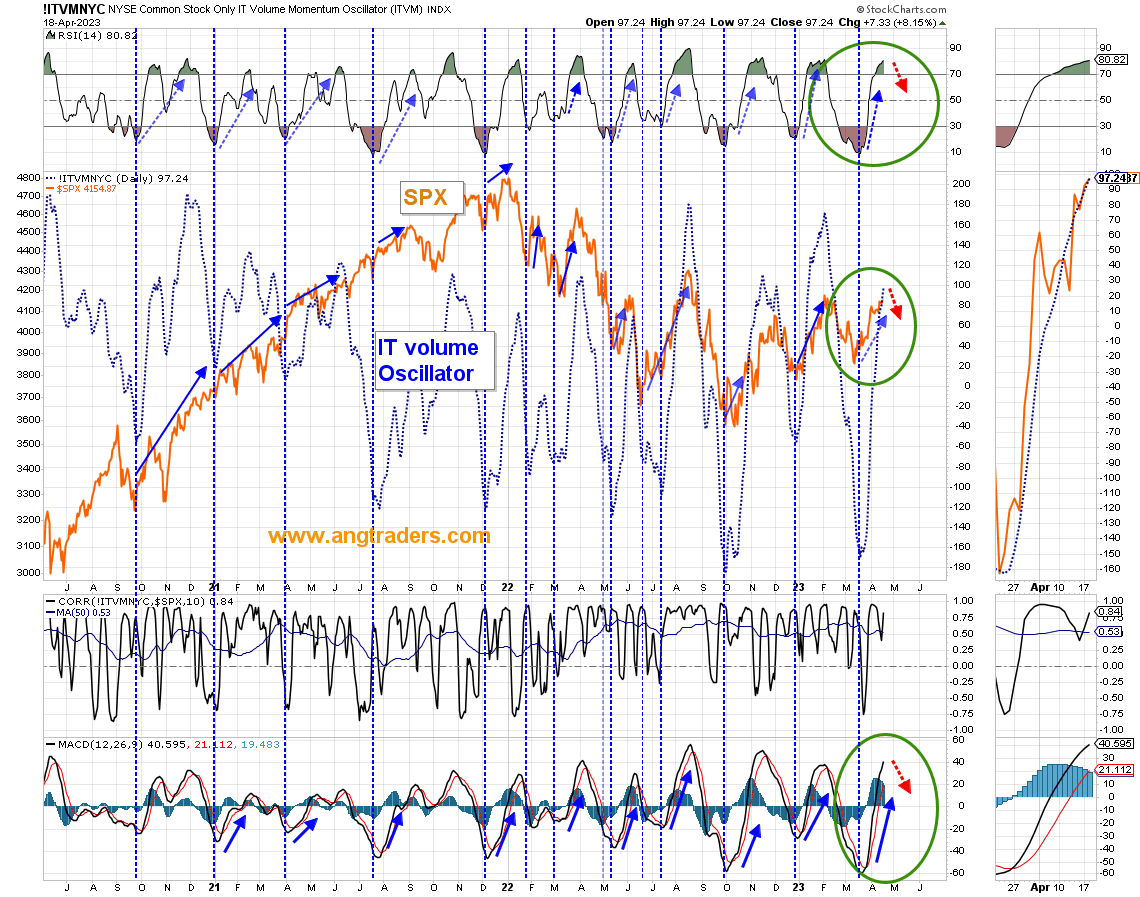
The McClellan summation RSI is over-bought above 70. This means the SPX is close to a short-term pullback (chart below).
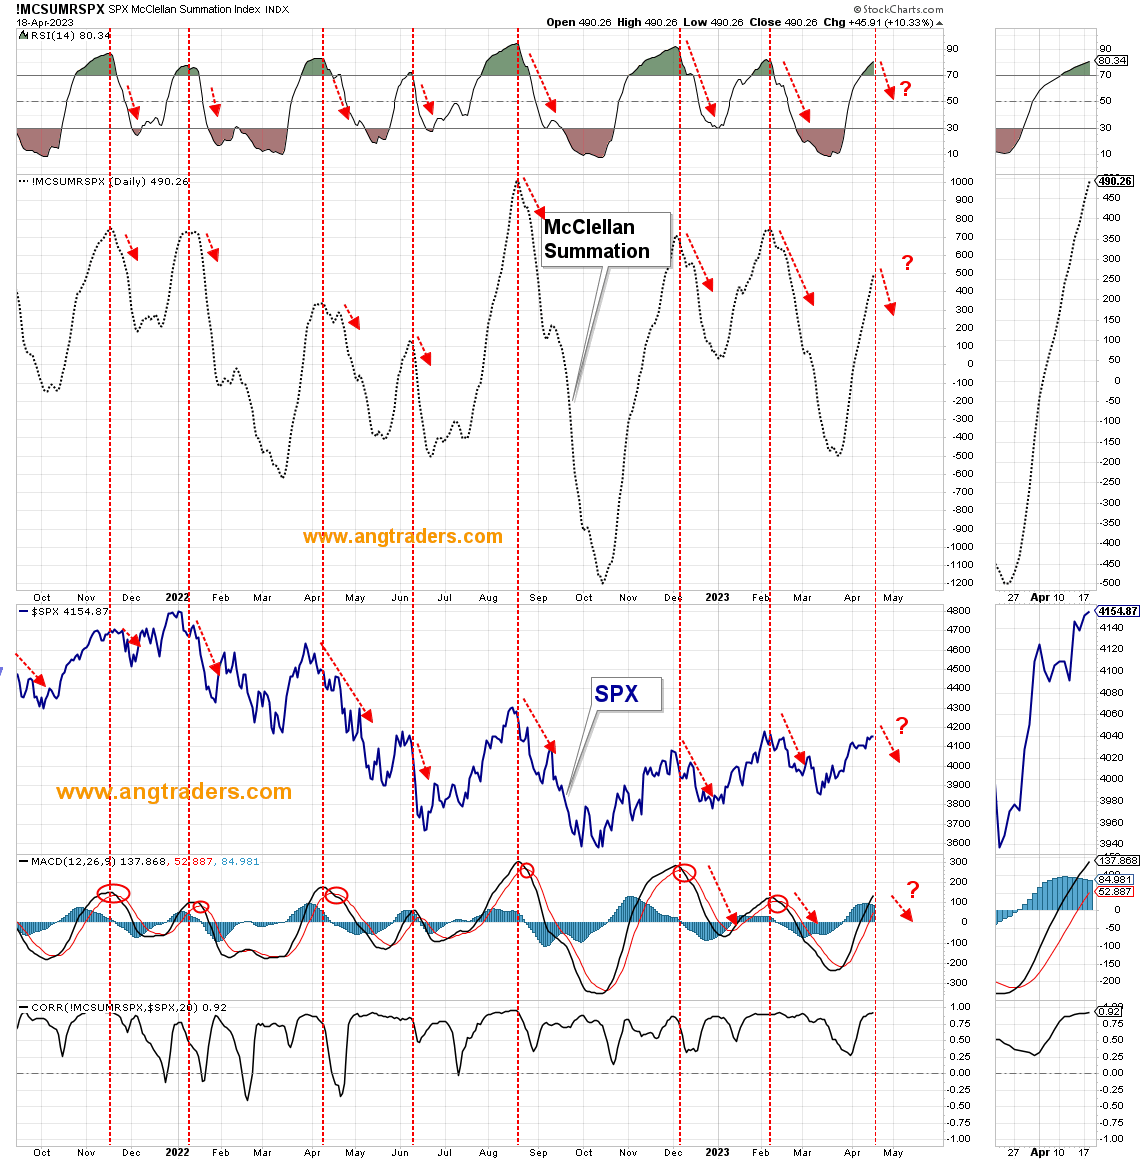
The hi-lo differential is starting to turn lower. This implies short-term weakness for the SPX (chart below).
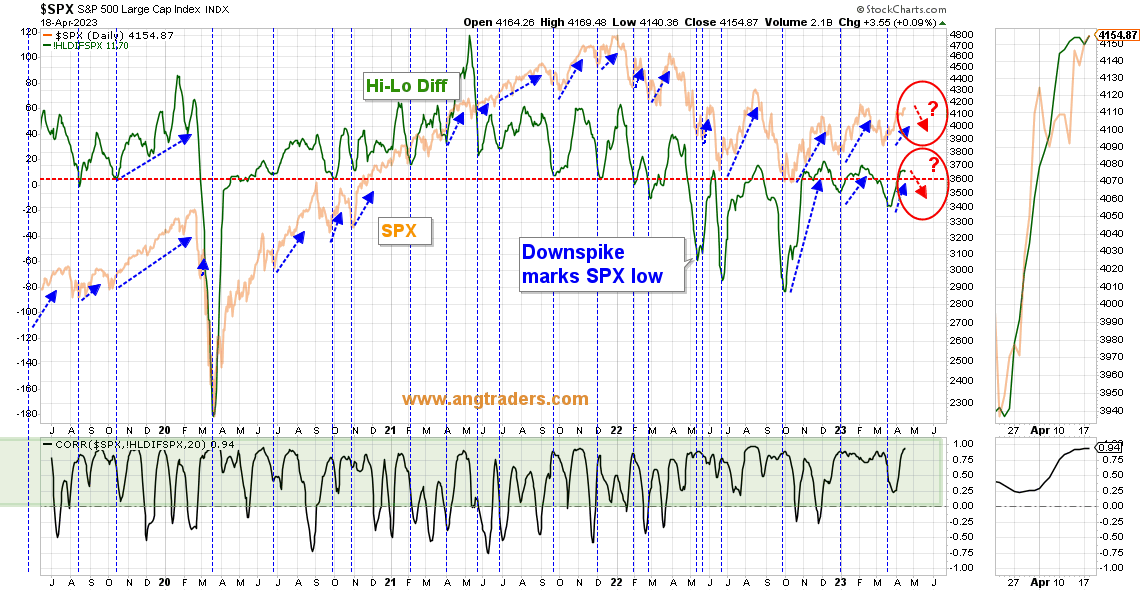
In summary: The long-term primary trend remains bullish. The SPX is bouncing off of the bottom of the fractal trading-range and is likely to breakout into new highs later in the year. Over the next week, the market is expected to weaken (but not break down) and this should provide a 'buy-the-dip' opportunity to add long positions in broad -spectrum ETFs such as SPY, QQQ, and IWM.
For further details see:
A Technical Check-Up On The Stock Market (Technical Analysis)