ASO - Academy Sports and Outdoors: Strong Trends Indicate Long-Term Potential
2023-03-07 11:56:44 ET
Summary
- Overall ratio analysis trends towards a highly competitive sporting goods store.
- ASO is a clear dominant player when compared to a competitive peer group.
- It's currently trading on the lower side of fair value as determined by multiple models.
- The stock is a hold for risk averse investors due to lack of margin of safety.
- It's a buy for growth oriented investors due to strong outperforming trends, high beta, and fair valuation.
Thesis - Hold-Buy
Academy Sports and Outdoors, Inc. ( ASO ) shows positive trends and attributes for investors based off multiple quantitative parameters like ratio analysis, DCF analysis, and when compared to their peer group. They have a high beta indicating more correlation to the overall market and a case can definitely be made for establishing/reinforcing a position in a portfolio depending on the investor and their portfolio needs.
The firm trades overall around the fair value range in their peer group with a few lower comparable multiples. ASO is a hold for risk-averse portfolios due to a lack of a margin of safety, but a buy for investors looking to move into this sector with a strong firm that seems to be developing a competitive advantage.
Business Profile - Snapshot Of Business Information
ASO is a full line sporting goods & outdoor recreational retailer located across 16 states in the U.S. They operate as a Specialty Retailer in the Sporting Goods Store TRBC classification. They have a current enterprise value trading around $6.2 billion and a market capitalization of approximately $4.6 billion. They trade with a historical beta of 1.61 meaning that they portray substantially more volatility than the overall market which could imply an appeal to more growth focused investors.
Business Profile (Author)
Ratios - Providing Context To Recent Trends
When analyzing ASO, utilizing ratio analysis can provide powerful insights into their recent performance. A peer group of comparable companies was also utilized to provide perspective for the ratios and metrics analyzed and is referenced throughout the analysis. The companies incorporated into this analysis are DICK'S Sporting Goods ( DKS ), Five Below ( FIVE ), Sportsman's Warehouse Holdings ( SPWH ), and Big 5 Sporting Goods ( BGFV ).
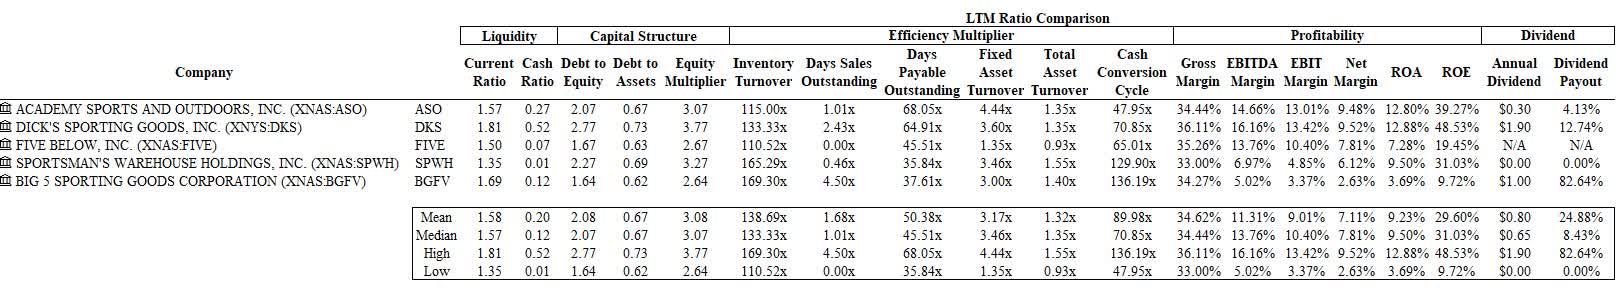
Liquidity Ratios - Mixed Results
Take-away: ASO liquidity ratios shows potentially mixed readings. A current ratio above 1, a growing cash position, and competitive metrics to their peer group indicate a good trend while a growing inventory, decreasing current ratio, and lower cash ratio vs. 2022 could signify future stress on their balance sheet.
The ASO current ratio has declined from 1.72 to 1.57 since 2020. While the balance sheet has grown overall, this ratio compression is due predominantly to a larger increase in current liabilities proportionality to current assets. ASO also has a larger inventory position which could be a concerning leading indicator for their demand assumptions moving forward. Their cash holdings have increased from $149 million in 2020 to $318 million LTM which when placed into the cash ratio show a slightly increased ratio since 2020 (0.2 vs. 0.27 LTM) though it has declined from 2022 values. According to the most recent 10Q , ASO believes their cash requirements will be sufficient for at least the next 12 months. The ASO liquidity ratios discussed also are around the median in comparison to their peer group which shows competitive strength for investors.
It is important for the firm to mitigate liquidity risk moving into a more uncertain future macro-environment and while ASO has trended in a mixed way, their short-term requirements do seem to be adequately met when benchmarked against their industry.
Liquidity Ratios (Author)
Capital Structure Ratios - Decreasing Leverage Trend Builds Confidence For Investors
Take-away: The capital structure ratios of ASO show a movement towards a less leveraged capital structure indicating a more conservative balance sheet. This could potentially hurt profitability since debt acts as a tax shield, but if not strategically optimized it contrarily decreases risk to the firm.
Evaluating the capital structure of ASO shows a decreasing amount of leverage across all the ratios. The debt/equity ratio has moved from 3.38 to 2.07 signifying a faster growth in equity and decreasing liabilities. The debt/assets ratio decreased from 0.77 to 0.67 from increasing assets and decreasing debt. The equity multiplier decreased from 4.38 to 3.07 meaning that the equity grew faster than the assets of the firm. These ratios will affect the profitability of the different shareholders and the tax burden of the company as determined by their capital structure. What this could signify is that ASO is decreasing their leverage which decreases their solvency risk (really important) though it could also result in decreased profitability for shareholders if it is not optimized appropriately. When comparing their LTM capital structure ratios to their peer group, they are trending appropriately around the averages.
Capital Structure (Author)
Efficiency Ratios - Tough To Beat 2022, But Overall A Good Trend
Take-away: The efficiency ratios show large improvements in the firm's ability to turn sales into cash and in their increased ability to utilize their assets for sales dollars since 2020. The efficiency ratios of ASO highlight 2022 as a strong performing year and hopefully the decreased LTM ratios are a temporary setback.
The inventory turnover ratio has increased from their 2022 low (89 days vs. 115 days LTM) highlighting the decreased demand for their inventory which is a worrisome reversion. However, the days sales outstanding remained around 1 day while the days payable outstanding increased from 46 days to 68 days. These are both positive aspects over the longer trend which have helped decrease the cash conversion cycle from 75 days to 48 days since 2020. The 2022 cash conversion cycle was at 27 due to the large demand and low inventory turnover ratio. What this means for investors is that the company is taking less days to produce cash between 2020 and the LTM which is a positive trend though the inventory and turnover should be monitored closely moving forward.
The firm showed an increasing asset turnover and total asset turnover which is a result of their proportion of sales to net fixed assets and total assets. This is also a positive trend for investors and typically results in better profitability (all else remaining equal).
ASO also maintains above average metrics in efficiency compared to the peer group discussed and has a much more efficient cash conversion cycle which is a good competitive advantage for investors.
Efficiency Ratios (Author)
Profitability Ratios - Strong Metrics For Investor Confidence
Take-away: ASO has done a phenomenal job positively trending their margins across the board since 2020 though there is a slight decrease in some of the LTM vs. 2022 metrics. The ROE and ROA are very strong and great metrics for investors overall.
ASO has been generally improving the margins of the firm since 2020 which is impressive considering the supply-chain and inflationary effects that have plagued the margins of many businesses. What is noticeable is how their gross margin aligns with the industry but they improve competitively as the income statement flows. According to ASO, some of the drivers of their strong performance are attributed to enhanced omnichannel capabilities, new stores, and inventory management. However, in their most recent 10Q, they attribute the slight decrease in their gross margin to increased inventory shrinkage, shipping costs, and freight costs. Considering the current macro-environment, it is possible that a few more contractionary periods will be experienced over the near term. The strong ROE and ROA could signal that the capital structure ranges referenced earlier may be more optimal for this business presently and the strong values are a great sign for investors.
Profitability Ratios (Author)
Dupont Equation - Shows Strong Performance Overall
The DuPont Equation can be utilized to help identify how the key drivers of shareholder return can be isolated independently (operating efficiency, financial leverage, and asset use efficiency). Breaking ASO into the relevant key drivers of net profit margin, equity multiplier, and total asset turnover, we can easily identify how the shareholder's ROE is changing. The net profit margins have remained around the 9% to 10% range while the equity multiplier decreased. This combined with an improving total asset turnover reveals a strong but slightly decreased ROE compared to 2022. The decreasing leverage was counteracted by better sales in relation to their assets and a better bottom line.
Dupont Analysis (Author)
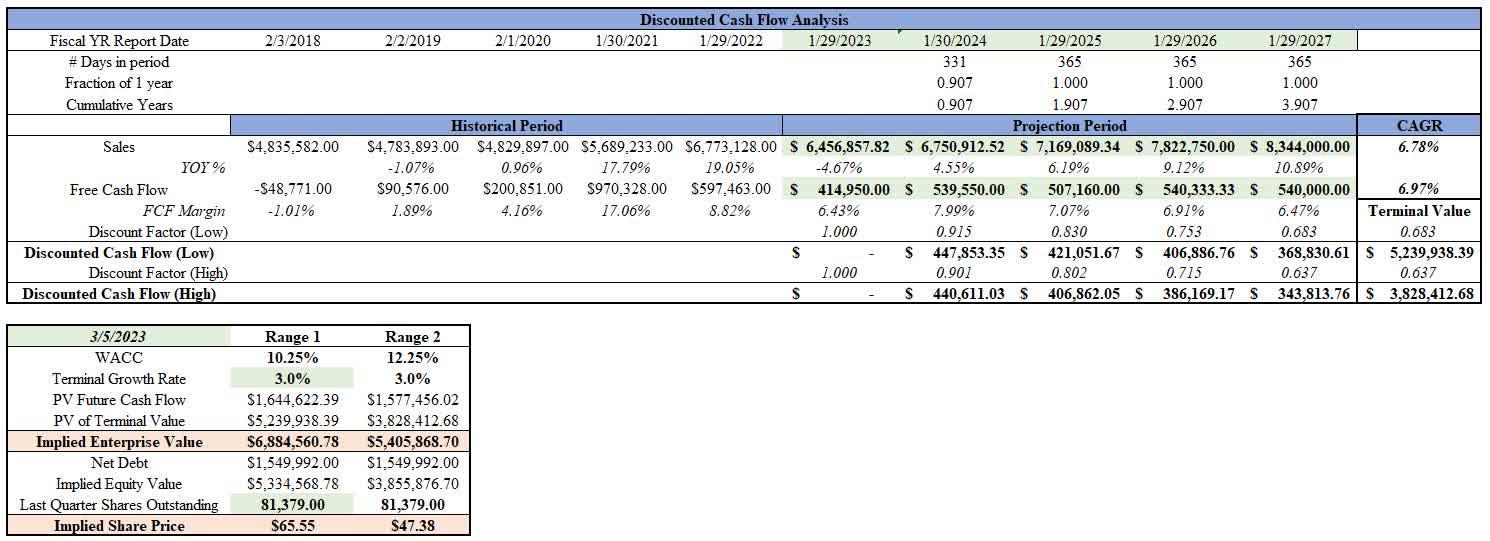
Discounted Cash Flow - Trading In The Appropriate DCF Range
Utilizing a Discounted Cash Flow DCF Model for ASO allows investors to take a set of assumptions from the cash flow of the firm and determine an intrinsic value range. Utilizing analyst assumptions for growth, margins, and the derived WACC ranges as sourced from Finbox produces an implied intrinsic value for ASO between $47 and $66. This is a large range due to the WACC (discount rate) spread and does not incorporate a margin of safety, as it is the estimated fair value of ASO. As of this writing, ASO was trading at approximately $60 signaling a current fair valuation.
Discounted Cash Flow Model (Author)
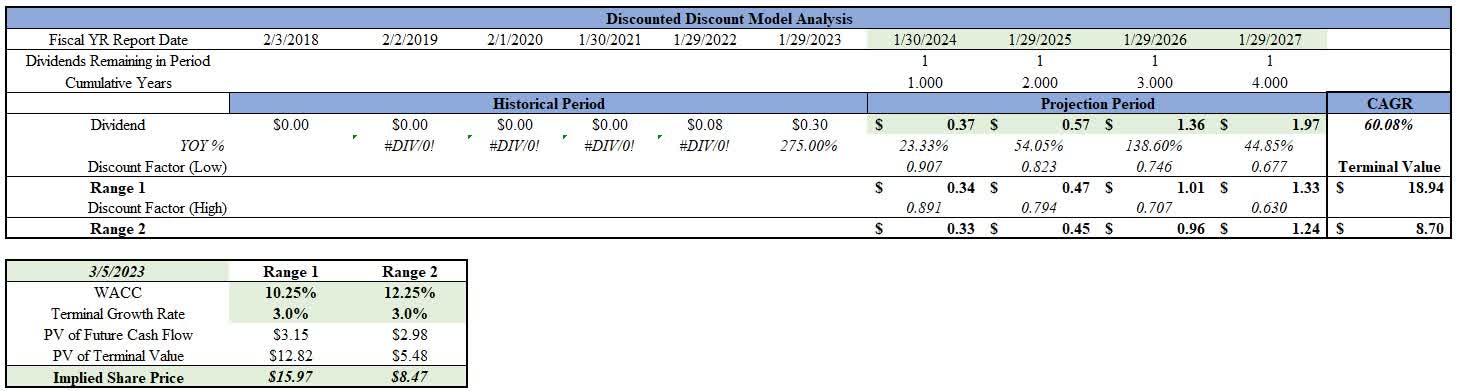
Dividend - Cherry On Top
ASO has only been a public company over the past few years and initiated their dividend payments in 2022. Analysts expect a growing dividend as referenced in the dividend model. The dividend payout ratio is healthy and a dividend theoretically decreases the risks for investors.
Dividend Discount Model (Author)
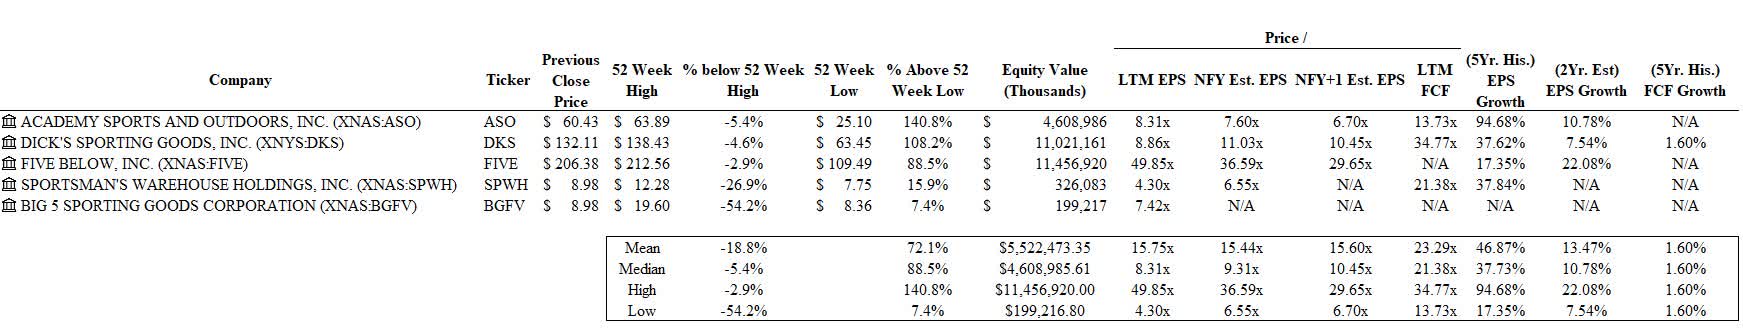
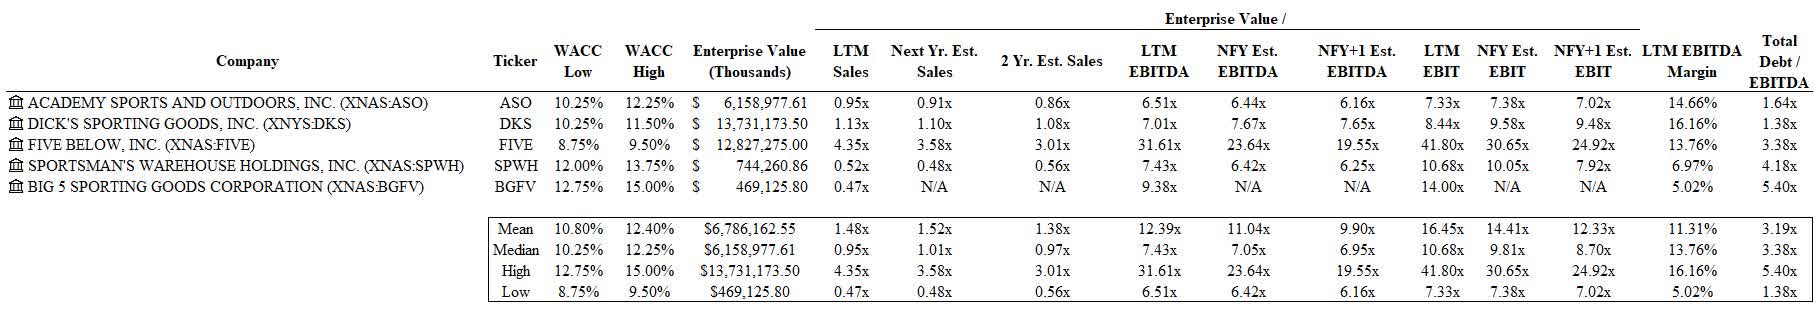
Comparable Company Analysis
ASO trades around the undervalued - fair valued range based on most equity multiples.
Analyzing the equity values of the group as a whole helps portray valuable insights into the multiples at which ASO trades. ASO is one of the middle sized firms by market capitalization and currently trades at a LTM P/E of 8.3x which is in line with the median value. Forecasting into the Next Fiscal Year (NFY) and above (NFY + 1) shows that the analyst predictions of ASO move to a lower P/E ratio of 7.6x and 6.7x compared to their industry median (which increases) largely due to a growing EPS (GAAP). ASO does trade at 13.7x their LTM free cash flow which is a respectable metric. *Note that ( FIVE ) equity multiples are relatively high and this creates a skew of the results given the sample size which is why the median values were selected. ASO also has grown its EPS over the past 5 years by a CAGR of 95% and is expected to grow by a CAGR of 11% over the next two years.
Equity Value Comparable Company Analysis (Author)
ASO trades around the undervalued - fair valued range based on most enterprise multiples.
Analyzing the enterprise values and the relative multiples of the group as a whole helps portray valuable insights into the price at which ASO trades. ASO trades fairly according to the LTM EV/Sales multiple (0.95x vs. 0.95x median) and lower in the forecasted values compared to the peer group analyzed. They also trade below average in the past and predicted EV/EBITDA and EV/EBIT ratios while showing a strong LTM EBITDA margin and very health Debt/EBITDA ratio when compared to their peer group.
Enterprise Value Comparable Company Analysis (Author)
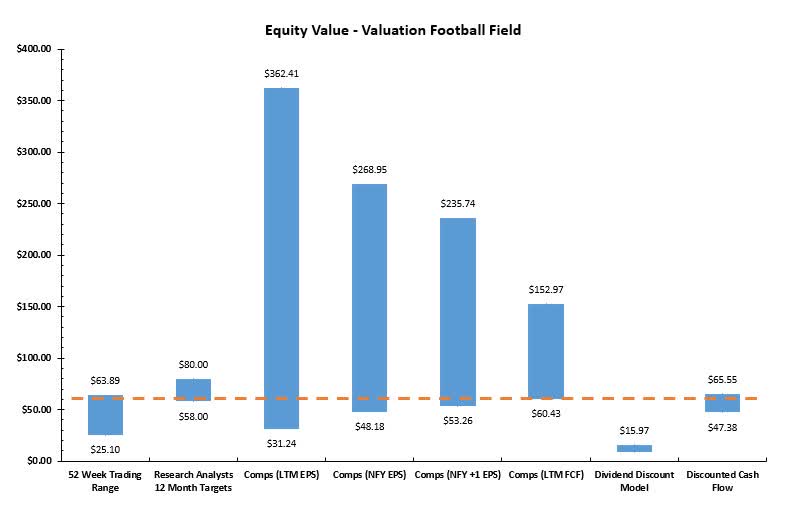
Valuation Ranges
Equity Valuation Football Field
The Equity Valuation Football Field shows a visual representation of the value ranges based on a variety of equity metrics. According to the data, ASO is trading within its fair value based on its 52-week trading range and analyst 12-month targets. Using the comparable metrics discussed prior, ASO is trading generally in their fair value range in comparison to the peer group represented above. According to the Equity Discounted Cash Flow Model, ASO is trading at fair value. Summarily, according to the equity valuation metrics, ASO is currently trading between their fair value and the cusp of their undervalued range.
*Note that ( FIVE ) equity multiples are relatively high which is why certain comparable ranges are so vast.
Equity Value Football Field (Author)
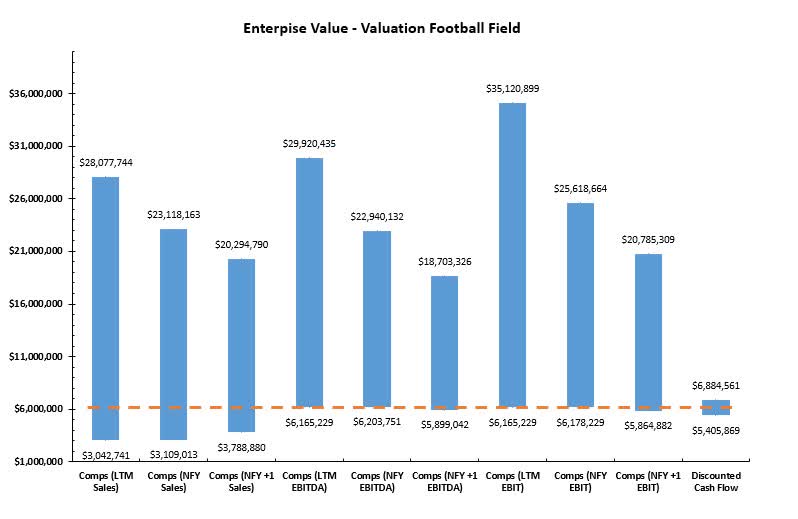
Enterprise Valuation Football Field
The Enterprise Valuation Football Field shows a visual representation of the value ranges based on a variety of enterprise metrics. The enterprise valuation theoretically provides a different perspective as it negates certain effects of capital structure that would be seen in the equity valuation. According to the data, ASO is trading within the discount to fair value range of its peer group regarding the comparable metrics. ASO also seems to be trading at a fair value according to the Enterprise Discounted Cash Flow Model.
Enterprise Value Football Field (Author)
Risks
ASO has many potential risks that can be expanded upon and read in their annual 10-K reports. This risk ranges from the uncertainty of the macro-environment, regulation & policy, operational, technology related, and based on whether the industry itself is in a declining market.
The results of this analysis were based on historical assumptions, analyst estimates, and inputs derived from other relevant research. Investors should consider their own risk profiles and utilize a margin of safety when investing to help mitigate these speculative characteristics and variance from their own opinions.
This article was also researched utilizing certain parameters that should not be concluded as all-encompassing. The perspective provided is largely quantitative and investors should add breadth to their research before they invest.
Conclusion
The quantitative analysis of ASO shows a firm quickly becoming a best in class performer. The ratios show strong improvement and metrics across the board as both independent values and in comparison to a benchmark peer group. They have started a dividend, have a long runway of markets to enter, and have plenty of upside potential.
The negative outcomes for ASO are going to be due to systematic risks that affect the broader economy since their products are based largely on discretionary spending.
However, the firm trades at a fair value currently (depending on the investors discount rate).
ASO is a hold-buy depending on the return expectation of investors. It is a hold for risk averse investors who seek more margin of safety and a buy for investors who are willing to establish a position with growth in mind from a company that seems to be trending in the right direction and outperforming multiple direct competitors. ASO is a firm to keep track of and a potential position/addition case could be established with a margin of safety if the market's voting machine pushes it to the $45 to $50 range (again).
For further details see:
Academy Sports and Outdoors: Strong Trends Indicate Long-Term Potential