ACU - Acme United's Growth Comes At A Price
2023-12-12 20:00:55 ET
Summary
- Acme United has experienced significant revenue growth since 2011 and CEO Walter Johnsen remains optimistic about future growth.
- The company projects revenue of $300 million by 2027, driven by innovation and successful acquisitions.
- However, an analysis of Acme's cash flow and working capital management raises concerns about the company's value creation and acquisition strategy.
Since this post back in 2021, shares of Connecticut-based Acme United Corporation (ACU), a supplier of safety solutions and cutting technology, have made a round trip from about $38 to below $22 and back to around $40 recently. Several promising operational developments were present back in 2021, but high valuation multiples prevented a buy recommendation on the shares at that time.
Now more than two years later, CEO Walter Johnsen continues to be optimistic about growth. Revenue of approximately $300M is projected by 2027, from around $200M in 2023. This almost 15% annual compound growth projected for the next three years comes despite the waning boon to operations from the COVID pandemic and the recent divestiture of the company's hunting and fishing business.
At the Sidoti Micro Cap Virtual Conference in November, Mr. Johnsen stressed Acme's sustained record of revenue growth over 13 years, with a possible 14th consecutive year of record revenue in 2023, assuming that results for Q423 (ended 12/31/23) are in line with expectations.
He attributed the revenue growth (9.25% compounded annually since 2011) to innovation, and also to successful acquisitions, which have been frequent.
In response to a question about the company's track record on acquisitions, Mr. Johnsen said, "You never want to say all your deals work because then you'll do one that doesn't. But let me just say that we've been buying accretive companies consistently for the last 10 years, and they've all worked. And that's where this cash flow's coming from."
Also, on the company's most recent quarterly conference call in October he said, "In summary, we believe we are strongly positioned for growth."
This may very well be the case, but should Acme pursue a revenue growth strategy as it has done historically?
Answering this question will inform an opinion about the long-term attractiveness of Acme's shares, and also give some context around the claim of successful acquisitions over the past decade or so.
A deeper dive into the drivers of cash flow via the Growth Cash Profile model may provide clues about the value created by Acme's past operations, including its acquisitions, and the implications for its stated goal of increasing growth.
But first some higher-level observations:
As stated, revenue growth from 2011 through 2022 (the period that CEO Johnsen referenced in his comments at the Sidoti Micro Cap conference) was 9.25%, which far exceeds the almost 3.0% compound annual growth of Operating Cash Flow ('OCF'). This wide disparity suggests either declining profitability, increasing inefficiency of working capital, or some combination of both.
Also worth noting is the fact that the market cap for Acme grew at a faster compound annual rate (about 12%) over the 12 years than did revenue. This would seem to be favorable for an assessment of the company, but net debt increased by almost 17% compounded annually (as of the year ended 2022), which resulted in the market cap being just 66% of enterprise value at the end of 2022 (using the year-end share count and the midpoint of the stock's high price and low price for the year) compared to about 76% at the end of 2011 using the same inputs. In other words, the acquisition strategy is increasing the size of Acme's enterprise via debt accumulation rather than generating cash and creating shareholder value.
The lagging OCF growth and reliance on growing debt (during a low borrowing cost regime by the way) imply suboptimal value creation in the past. As the following analysis will show, weak working capital utilization holds the lion's share of blame for poor cash flow generation which leads to increasing use of debt to fund revenue growth.
Revenue Growth
The first driver of cash flow is the ability of the company to grow its revenue. As we have seen, revenue growth has not been a problem for Acme as it has achieved more than 9% compound annual growth since 2011 via its acquisition strategy.
More recently, revenue grew by 1.4% y/y to $50.4M in Q323 (ended 9/30/23) which significantly lags the historic growth rate. The company is optimistic that full-year 2023 revenue will be flat to slightly up from the $193.9M in 2022, with revenue growth increasing to above historic trend through 2027, as previously noted.
Profitability
Like revenue growth, gross profit margin and operating expense each directly impact cash flow. Since 2011 gross margin has averaged 35.8% in a range of 32.7% (2022) to 36.9% (2018). Operating expense as a percentage of revenue has averaged 29.7% since 2011, within a range of 28.7% (2014) to 31.5% (2018), leaving the operating margin at an average of 6.1% since 2011. The peak operating margin was 7.0% in both 2020 and 2021 while the trough was 3.2% in 2022.
Gross profit margin improved to 38.7% in Q323 from 32.0% in the prior year quarter and to 36.1% for the trailing twelve months from 32.8% in FY22 (ended 12/31/22). On the recent earnings call, this improvement was noted as "primarily due to productivity improvements in the Company's manufacturing and distribution facilities, as well as lower inbound freight costs."
Working Capital Management
Moving from the income statement to the balance sheet, analysis of the company's accounts receivables, inventory, and accounts payable, i.e., its working capital, is critical for assessing its cash flow generation.
Inventory
For a manufacturing company like Acme, management of inventory is the paramount working capital consideration as it is typically the largest current asset. Inventory has averaged more than 31% of revenue since 2011 whereas accounts receivable have constituted less than 18% during that time.
Inventory turnover has averaged more than 171 days since 2011 with 2020 being the best year at 157.3 days. This metric has shown improvement in each of the last 4 years at less than 170 days turnover from more than 180 days in 2011, 2012, and 2013. However, as a percentage of revenue, Acme has achieved a rolling three-year average of 31.0% or 30 bps below the longer-term average.
Accounts Receivable turnover has averaged 63 days since 2011 which means the company's customers are being given more than two months to make their payments. Acme has been able to improve this metric over the past 3 years with each year below the average.
Accounts Payable have turned over in 33.7 days on average since 2011 with the slowest turnover being 40.8 days (2017) and the fastest being 25.0 days (2020). More recently, Acme has been unable to extend its payments to suppliers beyond the long-term average with both 2021 and 2022 at less than 27.5 days, or more than 18% below the historical average.
Other Accrued Liabilities primarily include customer rebates and contingent liabilities related to acquisitions. These have consistently averaged more than 5% of revenue since 2011 and are relevant to the cash cycle as a form of financing similar to the company's payables. Turnover of this metric has averaged 29 days since 2011 within a range of 22.1 days (2018) to 33.6 days (2020).
Putting these components together gives us the cash conversion cycle which is an expression of how long the company takes to cycle through the initial outlay of cash to purchase its raw materials all the way to the collection of cash for the sale of finished products.
Since 2011, Acme has operated on a cash conversion cycle of 200 days and an adjusted cycle of about 172 days when factoring in the Other Accrued liabilities as a source of cash in the cycle. The trend in the overall cycle has followed that of the inventory turnover with modest improvement over the entire period to around 166 days average in 2020, 2021, and 2022 from more than 178 days in each of 2011, 2012, and 2013.
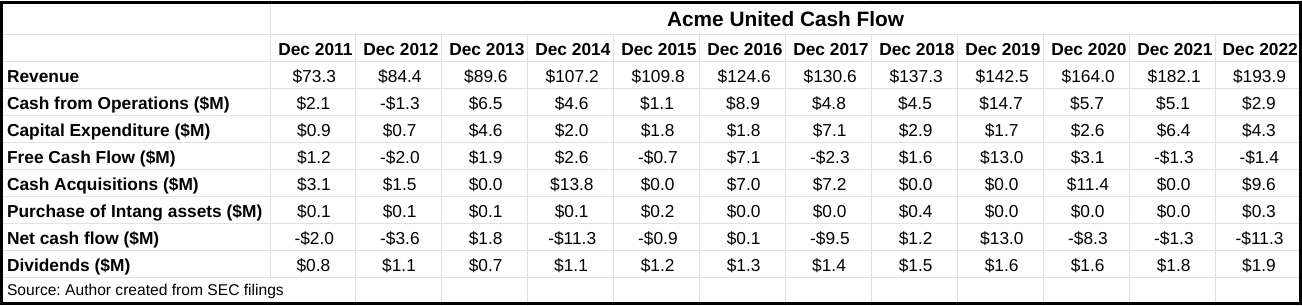
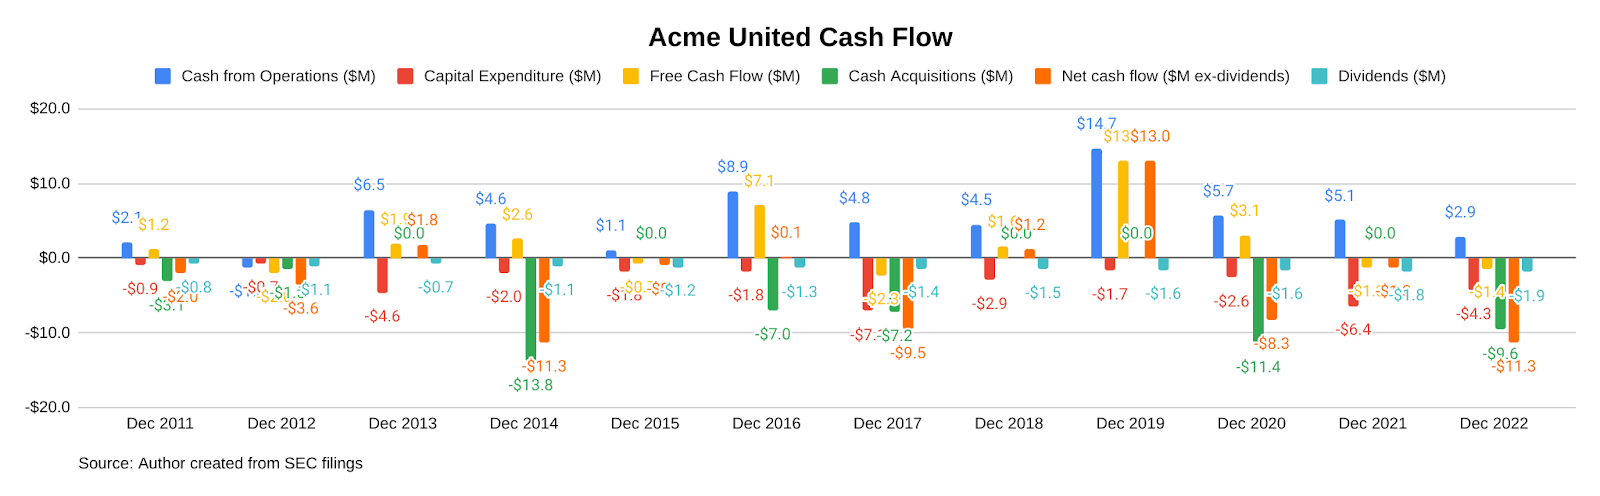
Capital Expenditures
The final driver of cash flow which can shed some light on the value created by Acme's past operations is its capital expenditures and, because the company has been a serial acquirer, its cash is used for acquisitions.
CAPEX has averaged 2.3% of revenue since 2011 within a range of 0.8% (2012) and 5.4% (2017). Note that the discussion of the Growth Cash Profile in the following section incorporates depreciation and amortization as a proxy for CAPEX. Since 2011 depreciation and amortization have averaged 2.0% of revenue with the 0.3% delta indicating the growth component of CAPEX above the replacement component of depreciation and amortization.
Acquisitions
Acme has been an active acquirer of other companies during Mr. Johnsen's tenure and he has stated an intent to continue the strategy.
From 2011 through 2022, Acme used $53.6M or 3.5% of revenue to acquire companies it sought to integrate and therefore add value to its operations. This dollar amount and share of revenue exceeds CAPEX ($36.8M and 2.4% of revenue) and is approaching par with OCF at $59.6M and 3.9%, respectively.
Free Cash Flow ('FCF') has totalled $22.8M and averaged just 1.5% of revenue since 2011, and as a result, FCF after acquisition cost has actually been negative over the entire 12-year span. Thus the company has been swapping equity for debt to grow its enterprise value.
Note that because it is not a driver of cash flow, dividends have not been included in the analysis, but totalled $14.1M or 0.9% of revenue and grew at 8.6% compounded annually from 2011 to 2022.
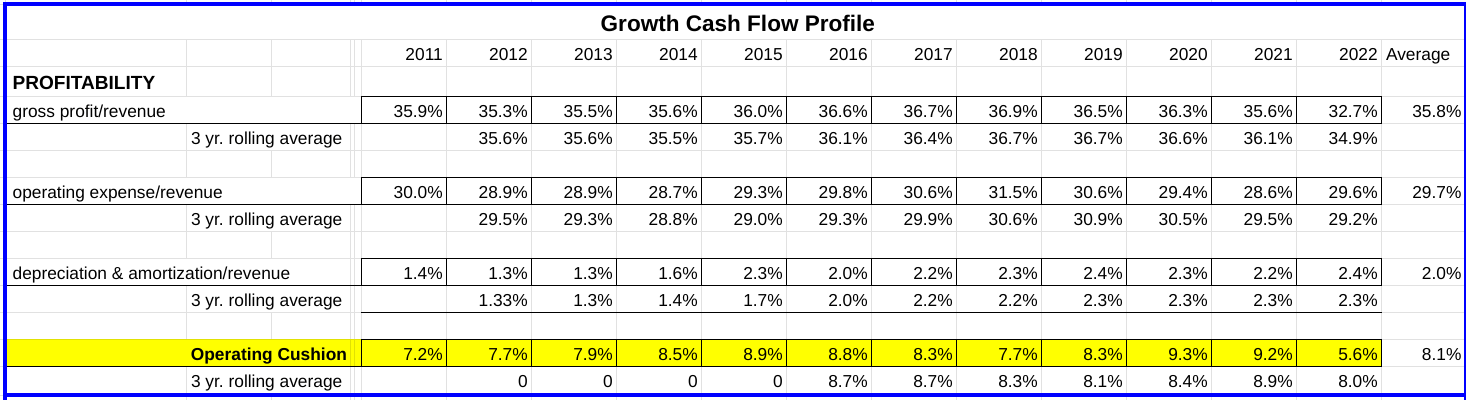
Growth Cash Profile
The Growth Cash Profile ('GCP') was developed by Professor Charles Mulford to measure the amount of core operating cash flow that is consumed or generated by each dollar increase in revenue using the concepts of an operating 'cushion' and an 'efficiency ratio'. Putting cushion together with the efficiency ratio yields the core growth cash profile.
Essentially, cushion expresses the components of profitability as a percentage of revenue while the efficiency ratio expresses the working capital components as a percentage of revenue. A positive cushion is a source of cash flow and a positive efficiency ratio is a use of cash flow. Conversely, a negative cushion consumes operating cash flow while a negative efficiency ratio generates cash flow for the business.
Looking at Acme's GCP, the operating cushion has averaged 8.1% from 2011 through 2022. Specifically, the cushion consists of an average gross margin of 35.8%, an average operating expense percentage of 29.7%, and an average depreciation and amortization of 2.0%. The 8.1% cushion indicates that the company generated 8.1 cents of cash from its profitability for every dollar it increased revenue during the period.
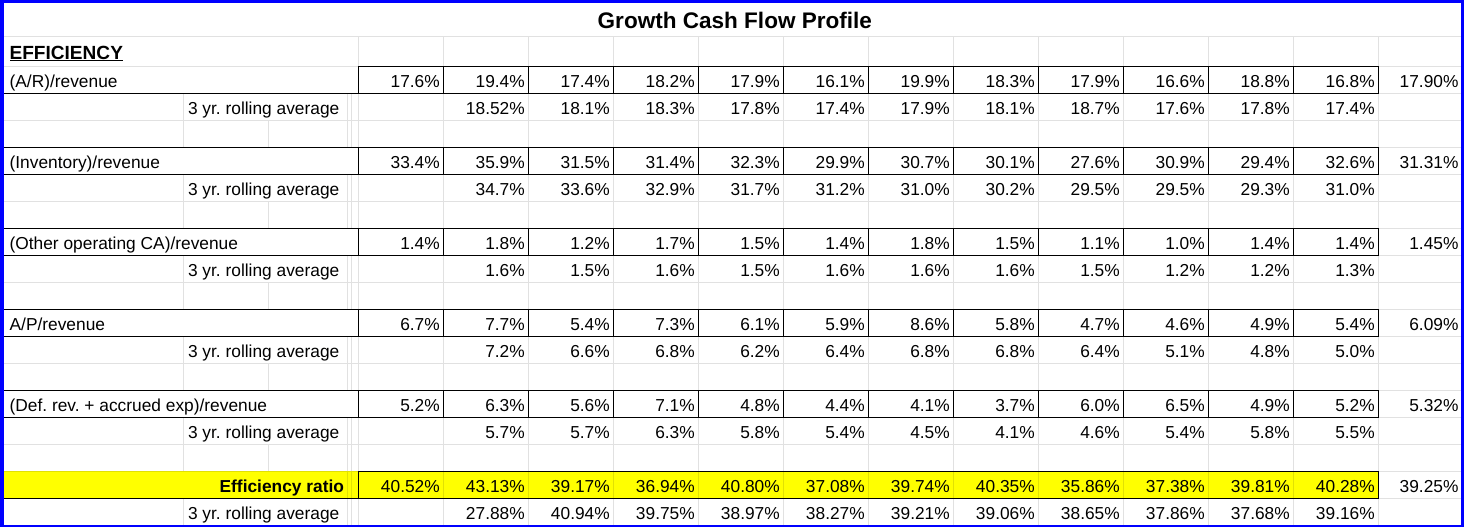
The efficiency ratio is the second component of the core growth cash profile, and it helps to discern which working capital accounts impact operating cash flow most significantly. Like its counterpart "cushion", the efficiency ratio expresses the working capital components as a percentage of revenue and measures the amount of cash that is consumed or generated by each dollar increase in revenue.
Acme's efficiency ratio indicates a net use of operating cash flow since 2011 at an average of 39.3%. This means that Acme's working capital management has consumed more than 39 cents for every dollar of revenue growth.
Specifically, inventory, at 31.3% of revenue has contributed most significantly to the efficiency ratio while A/R was almost half as much at an average of 17.9% since 2011. Prepaid expenses contributed just 1.5% on average to the cash drain since 2011.
Offsetting these assets were accounts payable at 6.1% of revenue on average since 2011 and other accrued liabilities (customer rebates and contingent liabilities) at 5.3%.
Putting cushion together with the efficiency ratio yields the core growth cash profile. In summary, the GCP averaged -31.1% on average since 2011, derived from the 8.1% cushion less the 39.3% efficiency ratio. For every dollar increase in revenue, Acme has consumed about 31 cents of cash.
For context, the Georgia Tech Financial Analysis Lab publishes a Cash Margin Index report. For Q421, the most recently available period, all non-financial industries had an average GCP of 4.04%, cushion of 12.7%, gross margin of 38.4%, and operating expense percentage of 19.8%.
As for working capital management, all non-financial industries had an A/R turnover of just under 57 days, an inventory turnover of just more than 23 days, an accounts payable turnover of 28.5 days, and a cash cycle of 50.6 days.
Clearly, Acme lags most companies in both profitability and efficiency in generating operating cash. But of course, there are differences in these metrics between industries.
The Consumer Durable industry, a sub-industry of the Consumer Discretionary sector in which Acme resides, had a GCP of 4.22% in Q421, which was above the average for all non-financials. In fact, this metric was above the average of the entire set of non-financial companies in each of the 8 quarters of 2020 and 2021. Once again it seems that Acme has a lagging cash generation capability.
The Takeaway
Previous assessments of Acme were generally positive with high multiples acting as an impediment to a 'buy' recommendation. However, flags were raised when the company had to request relief in filing its 10-K's in both 2022 and 2021 for the 2021 and 2020 fiscal years.
In 2021 the delay in filing was reasonably attributed to "managerial and administrative employees of the Registrant working remotely" during the COVID-19 restrictions. Again in 2022, staffing shortages "exacerbated by the COVID-19 pandemic" were cited, this time as causing "delays in the completion of managements (sic) evaluation of the Company's internal control over financial reporting…".
While it is generally concerning that the company was unable to remediate its staffing issues during 2020 and 2021, it is of more concern that the company chose instead to devote resources to completing two significant acquisitions in 2020.
It is a matter of priorities that Acme was able to consummate acquisitions during the COVID restrictions of 2020 (First Aid Central for $2.1M in January and Med-Nap for $9.3M in December) but was twice unable to devote these same COVID-restricted resources to completing its SEC filings in a timely manner.
This discovery sparked a deeper look into Acme's acquisition strategy which revealed the lack of value creation from its long-standing strategy of buying revenue growth.
At this time, because the company has demonstrated a preference for growing revenue and enterprise value over generating operating cash flow and meeting its filing compliance obligation, shares are to be avoided.
For further details see:
Acme United's Growth Comes At A Price