ACWI - ACWI: A Stellar End To 2023 Eyeing Early 2024 Election Year Risks
2023-12-24 11:00:00 ET
Summary
- Global stocks have experienced a remarkable rally, including US equities and foreign stocks since late October.
- Foreign stocks are currently at its best mark since February 2022 on a total return basis.
- ACWI has a hold rating, with a fair valuation and encouraging price action, but investors should be cautious of early-year volatility in election years.
- I highlight key price levels to watch on the chart of ACWI as we put the finishing touches on 2023.
It has been quite a year for global stocks. Large-cap US equities led the way through July before a garden-variety correction took place in the final two months of Q3 and to begin the fourth quarter. Then, in a remarkable rally, stocks took flight after notching a low on October 27. The last eight weeks have indeed featured non-stop gains in the S&P 500, but also from areas such as the once left-for-dead US small and mid-cap space.
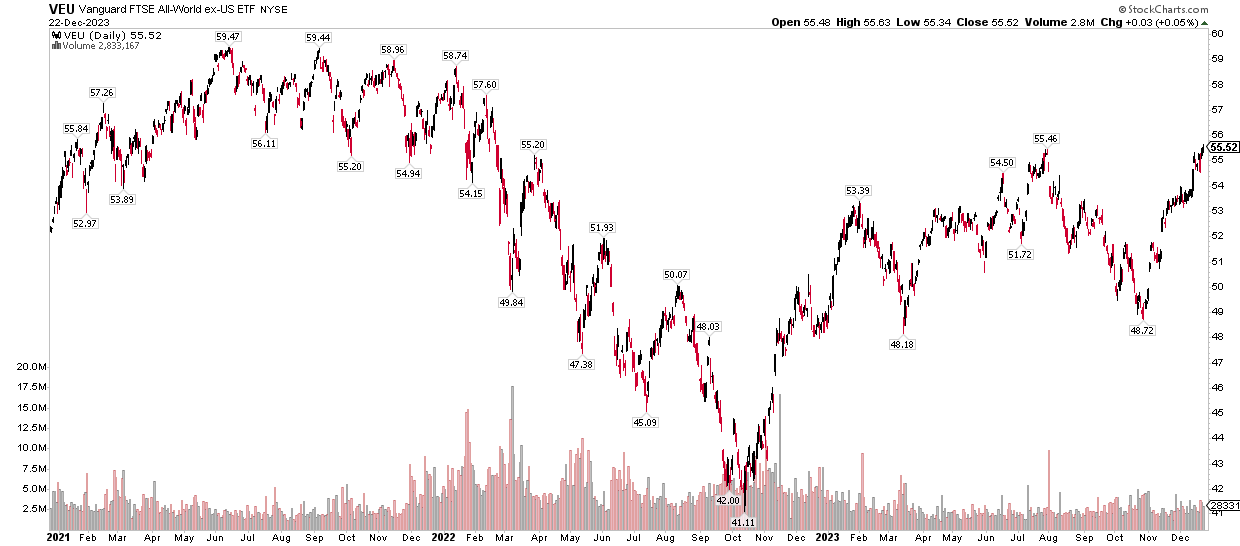
Also turning the bullish corner may be foreign stocks. I noticed that on a total return basis, the Vanguard FTSE All-Worl Ex-US ETF ( VEU ) ended last Friday at its best mark since February 2022. It’s an all-skate right now as the vaunted Santa Claus Rally gets underway (the final five trading days of the calendar year and the first two sessions of the new year).
Let’s go global. I have a hold rating on the iShares MSCI ACWI ETF ( ACWI ). I see its valuation as reasonable but will later note key Q1 risks on the horizon.
VEU Foreign Stocks: Fresh 22-Month Highs
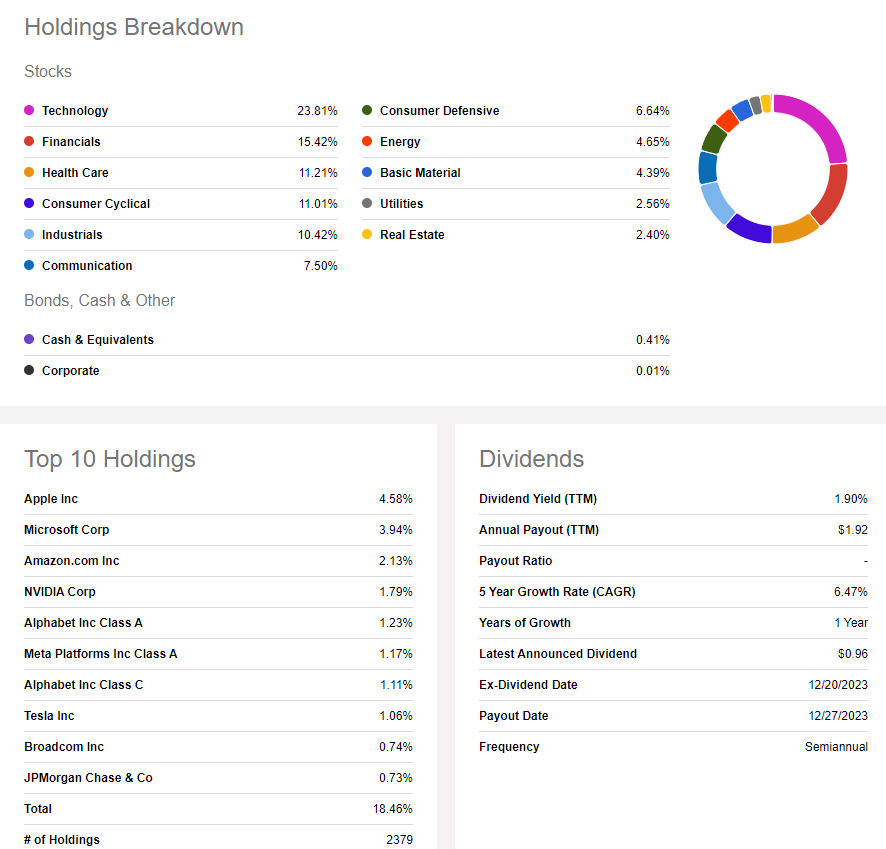
For background, ACWI aims to track the performance of the MSCI ACWI index, which includes large- and mid-capitalization companies from developed and emerging markets. It’s a large fund with almost $19 billion in assets under management and it pays a dividend yield of 1.9% as of December 22, 2023. Share-price momentum is solid right now, earning ACWI a B ETF Grade by Seeking Alpha, while its 0.32% annual expense ratio is modest, though you can find other broad index ETFs with even lower costs. Still, it is not a very risky ETF and liquidity is very high given average daily trading volume of more than 3.7 million shares and a 30-day median bid/ask spread of just a single basis point, according to iShares .
ACWI currently sells for a smidgen more than 16 times forward earnings estimates. That is roughly on par with its long-term average. Moreover, with interest rates now settling back near their 25-year normal range, the valuation appears fair to me, further underscoring the hold rating. Long-term investors should consider sticking with the fund while active investors should be on guard for pullbacks over the next few months – I will back up that claim later in the article.
ACWI: 16.1x Forward Earnings, Near the LTA
Goldman Sachs
Consider that we are just now wrapping up ACWI’s best 3-month period on the calendar, per BofA’s seasonality chart below.
ACWI: Bullish Year-End Trend Played Out
BofA Global Research
ACWI: Holdings & Dividend Information
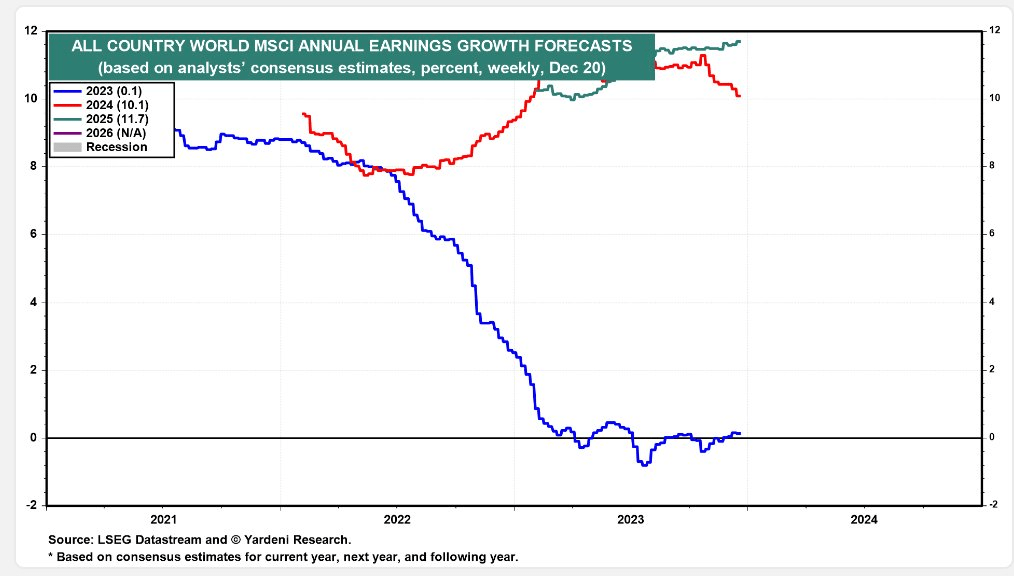
ACWI: 0% EPS Growth in 2023, +10% in 2024 (Expected)
Seasonally, the global stock market tends to struggle from mid-January through mid-March, according to data from Equity Clock . Recall how the first 10 or so weeks of the year have historically featured some volatility (2009, 2020, 2022, 2023), with selling climaxes occurring in mid-March. Will that happen again in 2024? That is always challenging to figure, but after a steep rally in the last two months, some near-term digestion may be due, particularly as we enter an election year.
ACWI: Weak Early-Year Positivity Rate
Equity Clock
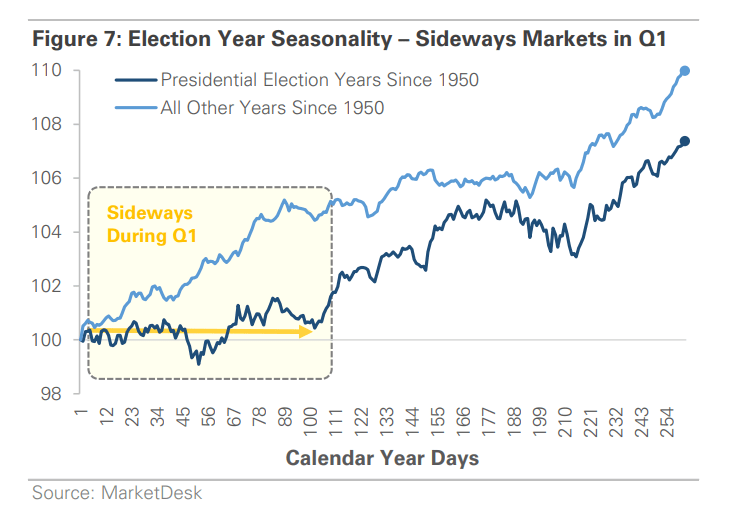
Taking the seasonal theme a step further, MarketDesk noted last week that volatility is commonplace over the first handful of weeks during election years. The Q1 stretch has in fact been tough on S&P 500 bulls, and that undoubtedly could carry over to the global stock market and ACWI ETF. This is just one trend to keep tabs on amid this politically charged macro landscape.
Dangerous Q1 Ahead? Volatile Start to Election Years.
The Technical Take
Back in the summer , I noted that ACWI had key resistance at $102 while $93 was support. Notice in the chart below that the ETF indeed paused at the $102 mark last week, but a new pivot area has emerged at $99.50 - that was the high from last July and where shares found near-term support a few sessions ago. The fund did shake out the bulls in a pullback to $88.33 at the October nadir as it dropped significantly below its 200-day moving average. Still, that long-term trend indicator remains firmly in an uptrend, suggesting that the bulls are in control. What’s more, ACWI is working off overbought conditions, as evidenced by the RSI momentum oscillator at the top of the graph (the caveat there is that we are in year-end distribution time, so major dividend payouts can make the chart look a bit wonky).
Nevertheless, with a high amount of volume by price now under last week’s closing value of $101.18, I assert that buying pressure should be apparent on pullbacks. Keep your eye on a price gap near $94 (which has confluence with the rising 50-day moving average) - that could be a good entry point if we see some of that usual Q1 volatility. Of course, $93 remains a key support point, too. In terms of upside targets, we can project a measured move price objective off the bottom formation from late last year through early 2023 - $110 is the height extension from the $17 range ($76 to $93). Also, I see the same target based on the $99.53 to $88.33 pullback and breakout.
Overall, the chart is generally constructive.
ACWI: $102 Resistance, $93 Support. Eyeing $110 Upside Target, $94 Downside Gap.
The Bottom Line
I reiterate my hold rating on ACWI. I see the valuation today as fair while price action is encouraging. Still, we often see early-year volatility emerge during election years which could offer buying opportunities for the bulls at better prices.
For further details see:
ACWI: A Stellar End To 2023, Eyeing Early 2024 Election Year Risks