ADDDF - Adidas: Taking A Bearish Stance On Amid A Gloomy Industry Forecast
2023-09-05 07:48:48 ET
Summary
- I anticipate a 13.8% decline in Adidas shares with a target price of $172.5 by the end of November.
- The footwear industry faces a bleak 2023 outlook, and Adidas appears to be losing market share in key markets.
- The stock trades above industry multiples with greater financial leverage and smaller liquidity levels.
- This trade includes a stop-loss order to limit potential losses to 3.5%, potentially securing a 10.0% gain, and opening up the possibility of a further 13.8% gain after the release of Q3 earnings.
Thesis
I anticipate a 13.8% decline in Adidas ( ADDDF ) shares, with a target price of $172.5 by the end of November. This outlook is grounded in several key factors.
The foremost concern is the expected economic downturn in China, the U.S, and Germany, which are major revenue contributors for Adidas. As these economies slow down, consumer spending on discretionary items, like Adidas products, is likely to decrease.
Additionally, the outlook for the footwear industry in 2023 is grim, and this gloominess could extend into the first half of 2024 due to the macroeconomic challenges mentioned above. Notably, Adidas appears to be losing market share in critical markets like the United States and China to its primary competitor, Nike ( NKE ).
Furthermore, Adidas currently trades above industry median multiples, carries higher financial leverage, and exhibits lower liquidity compared to its industry peers. Adding to the concerns, the company’s management has set a negative target for FY2023 Sales, which is the first time they have done so in five years, and this is quite worrisome.
Therefore, the short-term prospects are unfavorable for the stock. I recommend initiating a short position on Adidas. Start with a stop-loss order set at the resistance level of $207, and adjust it if the stock price breaks below the first support level at $180. The position can be closed off between the first and the second support levels, which averages at a price of around $172.5.
This strategy offers a way to limit potential losses to 3.5%, potentially secure a 10.0% gain at first support ($180), and opens the possibility of a further 13.8% gain ($172.5) after the release of Q3 earnings in early November.
Macro headwinds
United States
Adidas sales come from three key regions: North America (25%), Greater China (20%), and EMEA (37%), with the United States, China, and Germany being the largest economies in these regions. I have the following concerns about the recent developments in these economies.
Firstly, in the United States, competition from established brands is a major challenge, and Adidas faces difficulties entering the basketball market, the country’s second most popular sport, which negatively affects revenue growth. Secondly, China’s recent yuan devaluations hinder its ability to import German goods, affecting Adidas, given China’s status as the key importer of German goods. This brings us to Germany, the largest economy in EMEA and Adidas’ headquarters location. Half of the economy depends on exports which is susceptible to yuan devaluations, which therefore poses a systematic risk to Adidas shares on the Frankfurt Exchange.
These regions constitute 82% of the company’s revenue, with the largest economies on the brink of recession per Leading Economic Indicators. This presents a challenging FY2023 for Adidas.
Fundamentals
Industry Ratios
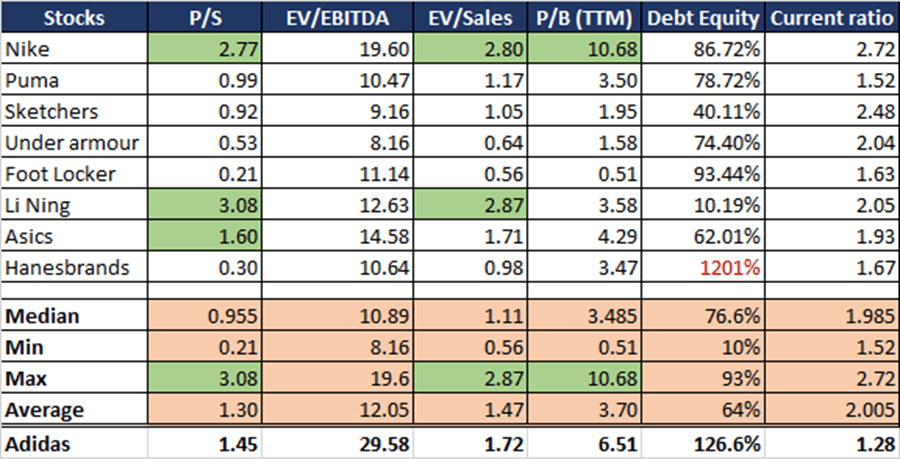
In Table 1, labeled as “The Fundamentals,” you will find four key valuation metrics: P/S (Price-To Sales ratio), EV/EBITDA ( Enterprise Value-to-Earnings Before Interest, Taxes Depreciation, and Amortization ratio), EV/Sales (Enterprise Value-to-Sales ratio), and P/B (Price-to-Book ratio). This table also provides insights into the Debt/Equity leverage metric and the widely used liquidity metric, the current ratio.
Within this table, you will find a comparison of Adidas with its competitors, with Nike standing out as the dominant player in the industry. The areas highlighted in green indicate where Adidas outperforms its competitors in these metrics.
The key takeaway here is that Adidas appears to be relatively more expansive, with higher leverage and lower liquidity compared to both the broader industry, and on some metrics, when measured against the industry giant, Nike.
Table 1: The Fundamentals (Created by author with data from Yahoo Finance)
Leading Competitor Analysis
Direct-To-Consumer Sales
Both Adidas and Nike share a strategy aimed at reducing reliance on wholesale sales and instead focusing on direct-to-consumer ((DTC)) sales to boost revenue and profitability. Table 2 below illustrates how effectively each company has executed this strategy. It reveals that Nike has maintained steady DTC sales as a percentage of total sales growth, rising from 35% in 2020 to 42% in 2022. In contrast, Adidas experienced a 2-percentage-point decline in DTC sales as a percentage of total sales, dropping from 41% in 2020 to 39% in 2022. This suggests that Adidas has faced challenges in increasing its DTC sales as a percentage of overall sales compared to the industry leader, Nike.
Table 2: DTC Sales % of total sales (Created by Author with data from annual reports)
Geographical Revenue
Although Adidas experienced a substantial 25% sales growth in North America compared to Nike’s 7% in 2022, Nike still maintained a dominant position, generating three times more revenue in that region. In Greater China ((GC)), Adidas faced a significant 31% decline in sales, whereas Nike’s decline was 9%, resulting in Nike earning 2.4 times more revenue in that region. These figures underscore Nike’s leading role in critical footwear markets. The market where the revenue difference was relatively small, Nike earning 1.5 times more revenue, was the home market EMEA, with Adidas achieving 10% growth and Nike a 9% growth. Nevertheless, Nike remains a formidable challenger for Adidas in penetrating the two key markets: North America and Greater China.
Earnings per share
Over the 2017 to 2022 period, Nike’s Diluted EPS demonstrated a healthy 8.4% Compound Annual Growth Rate ((CAGR)), while Adidas experienced a notable decline of 29.1%. This contrast underscores the greater resilience of Nike’s brand compared to Adidas, which I think will be further highlighted by the upcoming recession. When we consider a longer 10-year period, the trend remains consistent, with Nike showing a modest negative growth of 2.3% and Adidas experiencing a more substantial decline of 10.5% CAGR. It is worth noting that this negative growth is primarily attributed to the challenging year of 2022, which affected the industry as a whole.
Research and Development
Nike’s prominent position in the footwear industry can be attributed to its first-mover advantage. Notably, the company’s research and development (R&D) expenditures are twice that of Adidas. This substantial investment in innovation enables Nike to consistently stay ahead of fashion trends and produce top-notch equipment for its athletes. As mentioned earlier, Adidas faces a considerable challenge in breaking into the U.S. basketball market. I this task is made even more challenging due to the significant disparity in R&D spending between these two companies.
Outlook
Industry Outlook
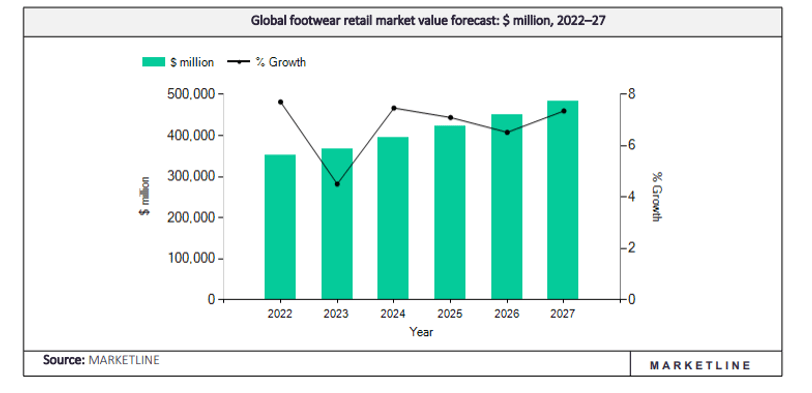
The Footwear industry is expected to experience steady growth at a CAGR of 6.6% from 2022 to 2027, as shown in Figure 1. However, 2023 is projected to be a challenging year with the slowest growth rate at 4.5%, potentially extending into the first half of 2024 if macroeconomic challenges persist, which I think seems likely. Despite these short-term concerns, the long-term prospects for the market remain promising. The primary contributors to the market are as follows:
- The United States, with a 26.1% market share.
- China, accounting for 21.3%.
- Followed by the United Kingdom at 3.8% and Germany at 3.5%.
In 2023, China and the United States together make up almost half of the market share, making them strategically important target markets for Adidas. However, as mentioned earlier, Adidas faces challenges when entering the U.S. market, particularly in its largest sports segment, basketball. Additionally, its Chinese revenue has been declining more than that of its main competitor, which raises concerns about the company’s presence in these markets. I believe these challenges to significantly impact the upcoming Q3 earnings.
Figure 1: Global footwear retail market value forecast (www.Marketline.com)
Management Outlook
Management has a steady track record, hitting 3 out of 5 targets, with 2018 being a notable lower-side hit (highlighted in yellow), as shown in Table 3. Over the past five years, targets have not been exceeded, but when missed, they are missed by a wide margin. The 2023 target is concerning, marking the first negative target set by management in five years with a mid-single-digit sales growth decline and a $450 million operating loss. This raises red flags, as hitting this target would mean a drop in sales and share value, and missing it would result in an even larger decline.
Table 3: Currency Neutral Sales Targets (Created by Author with data from annual reports)
In my forecast, I anticipate that the revenue for 2023 will be reported at € 21.39B, reflecting a conservative 5% decrease compared to the previous year. Specifically, in Q3, I expect revenue to be € 5.53B, which would be a 4.3% miss when compared to the € 5.78B analysts’ estimation . This variance is largely attributed to the unfolding macroeconomic developments mentioned earlier.
The highest estimated value of the stock comes at around $183, 8.5% lower than the current price, based on the median EV/Sales ratio. However, it is worth noting that other metrics suggest a lower valuation. Also, during the Q2 earnings call, the management emphasized that their focus for 2023 is not necessarily on generating substantial profits but rather on addressing and resolving the issues at hand, hinting at worsening financial performance.
Technical analysis
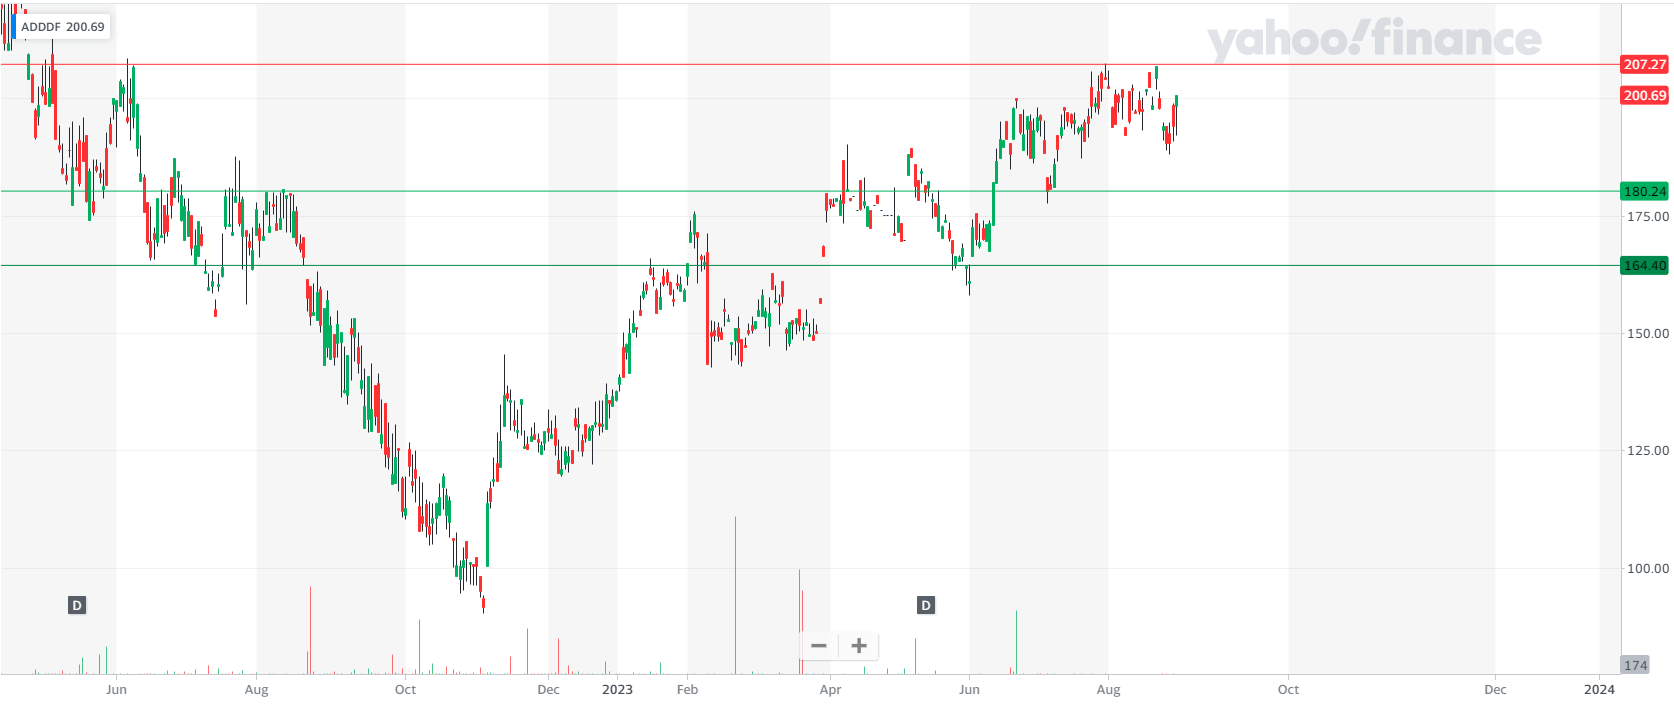
Currently, the stock is trading at around $200, with the resistance level at $207. The first support level is at $180, and the second support level is at a price of $165, as depicted in Figure 2 below.
Here is the trading strategy: Initiate a trade with a stop-loss order set at the resistance level (around $207). Once the price breaks below the first support level at $180, adjust your stop-loss order to this new level, this will lock in 10.0% profits. You might wait until the price comes closer to the second support level, which is highly unlikely, I advise you to take profit in between the two support lines ($180 and $165)
By employing this method, you limit your potential loss to a maximum of 3.5%, could secure a 10.0% gain at the first support level, and ultimately might realize a 13.8% profit when you close your position at $172.5, a price that falls between the two support levels.
Figure 2: Technical analysis (finance.yahoo.com)
Catalysts
1. Poor Economic Data in the U.S., China, and Germany
The weakened economic conditions in the United States, China, and Germany could have repercussions on future Adidas revenues. Any news indicating a deterioration in these economies might have a negative impact on stock prices. Of particular significance is the poor economic data from Germany because the state of this economy poses a systematic risk to stocks on the Frankfurt Stock Exchange. Additionally, the economic developments in China are noteworthy as it is one of the largest importers of German goods, making it a leading indicator of the German GDP, which consists of 50% of exports .
2. Q3 Earnings Report
The Company is set to release its 9-month report in early November, covering the first 9 months of the financial year. This report will include the earnings for Q3. Although both management and analysts have communicated their expectations of a revenue drop, I believe that this expected decrease will continue to cast a shadow on the stock price until the end of November. If the company fails to meet the analysts’ estimations, the impact is likely to be even more pronounced.
3. Inflationary Pressures
Closely tied to the first catalyst is inflationary data. Inflation appears to have stabilized in the U.S. and the Eurozone somewhat after its peaks, but it remains significantly above the 2.0% target. If it becomes evident that core inflation is more persistent than anticipated, this will compel central banks to maintain elevated rates for longer duration or potentially raise them further. Such a development is expected to reduce consumer spending on discretionary items like Adidas’ products.
Risks
1. Strong Brand Image
In the realm of footwear, where Nike holds the lion’s share, Adidas secures a solid second position. The company has secured endorsements from global icons such as Lionel Messi, Damian Lillard, and David Beckham. Furthermore, their lineup of timeless classics like the Adidas Superstar, the soon-to-be-discontinued Yeezy’s, and the enduring Adidas Samba, has cemented a robust brand image. This is expected to propel the price upwards in the long run.
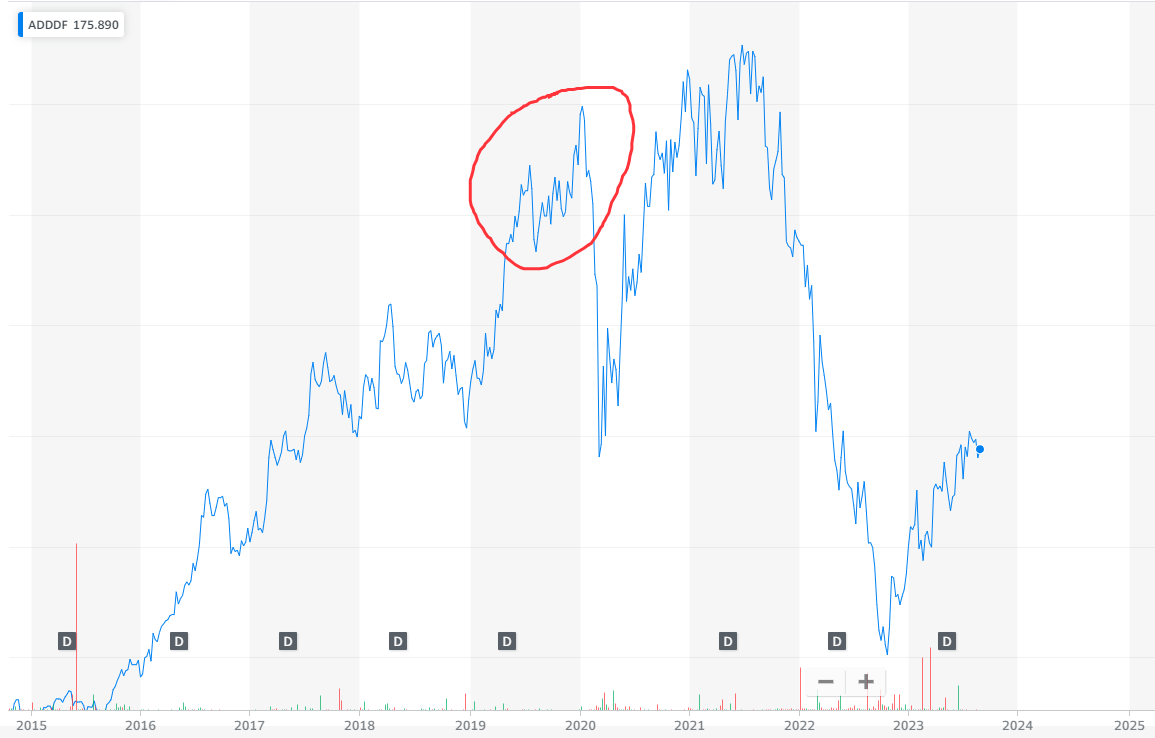
2. Recovery from Pandemic Lows
Adidas has yet to regain its pre-pandemic peak stock price levels, as shown in Figure 3. The stock has been on an upward trajectory since October 2022. This presents a potential risk, as investors might interpret the chart as an opportunity to buy at a low price or speculate on the stock’s upward momentum. While I believe Adidas has the potential for long-term recovery, I anticipate short-term depreciation due to impending headwinds. To mitigate these risks, employing a stop-loss order as outlined in the Technical Analysis chapter is advisable.
Figure 3: Share price chart (finance.yahoo.com)
Conclusion
In conclusion, with the worsening of the economies that contribute to the majority of Adidas' total sales, the poor outlook communicated by the Management, and the grim footwear industry outlook. The stock is still trading at higher valuation metrics than the industry median. Also, it possesses higher risk due to substantially bigger leverage and lower liquidity levels than the industry. Furthermore, the company seems to be losing market share in critical markets like the United States, and China to its main competitor, Nike.
The stock might depreciate In the short term due to headwinds like worsening economic data published in one of the mentioned economies. The company’s Q3 report might depreciate the stock further in November. The great brand image and the long-run upward momentum of the stock pose a risk to this trade. To minimize these risks, I recommend initiating the short position with a stop-loss order set at the resistance level. Additionally, consider adjusting the stop-loss order to the first support level if the stock breaks below that threshold. This will limit potential losses to 3.5%, while also potentially securing a 10.0% gain at $180 with the opportunity for a 13.8% profit at $172.5 by the end of November.
For further details see:
Adidas: Taking A Bearish Stance On Amid A Gloomy Industry Forecast