SBIGY - Admiral: Reviewing Competitor Results Ahead Of H1 Report
- Admiral shares fell 26% in three trading days in July after two competitors warned on profits; it reports H1 results next week.
- Competitors' H1 results showed large claim cost inflation, profit margin declines and relatively flat volumes. Admiral is likely similar.
- Competitors have raised their pricing to fully reflect inflation and kept their old margin targets, implying a benign market for Admiral.
- Ultimately, the sector is cyclical but long-term profitability is intact, and Admiral should gain when the rebound comes.
- With shares at 1,965.9p, we expect a total return of 104% (26.9% annualised) by 2025 year-end. The Dividend Yield is 7%+. Buy.
Introduction
Admiral Group PLC ( AMIGY ), the #1 U.K. motor insurer which has been Buy-rated in our coverage since October 2020, is scheduled to release its H1 2022 results next Wednesday (August 10).
Admiral shares fell 26% (in GBP in London) between July 14 and July 18, after profit warnings at competitors Sabre Insurance ( SBIGY ) and Direct Line ( DIISY ), but have regained 13% since. (Hastings, now part of Sampo ( SAXPY ), reported its H1 results on August 3.) Admiral shares currently stand at a loss of 16% (after dividends) since we upgraded our rating to Buy in October 2020:
H1 results reported by Admiral’s competitors show significant claim cost inflation, material profit margin declines and relatively flat volumes. We believe Admiral will likely have a similar H1. More encouragingly, competitors have now raised their pricing to fully reflect inflation, and maintain their old margin targets, implying a benign market. We believe the structural profitability in U.K. motor insurance to be intact.
Relative to pre-COVID 2019, when Admiral was insuring 12% fewer vehicles, shares are currently trading at a 13.2x P/E and a 7.1% Dividend Yield. Our forecasts show investors can potentially double their money (with a 26.9% annualized return) by 2025 year-end. Buy.
Admiral Buy Case Recap
Admiral is a U.K. insurer with a market capitalization of £5.9bn ($7.1bn). It generates most of its Profit Before Tax ("PBT") in U.K. motor insurance, where it is the market leader. It also offers household insurance, travel insurance and personal loans, and has small presences in Italy, France, Spain and the U.S.:
| Admiral PBT By Business (2014-21) Source: Admiral company filings. |
Our investment case centres around the U.K. Motor business, where:
- The sector has continued to grow structurally, with the number of vehicles historically increasing at 1-2% annually, and premiums rising over time due to growing claim costs for both vehicles and medical treatment
- Admiral has continued to gain market share and generate solid profits because its lower Expense Ratio (from scale and efficiency) enables it to offer insurance at lower prices than competitors but achieve higher profits
- Admiral's growth differs during different parts of the insurance cycle, but we believe it can achieve a high-single-digit EPS CAGR. During 2015-19, which we believe represent an entire cycle, U.K. Motor had CAGRs of 6.8% in vehicles and 8.2% in both total premiums and profits
- 2022 regulatory reforms requiring insurers to offer the same prices to new and existing customers will lead to higher pricing on new business, improve sector profitability and entrench leaders like Admiral
Admiral's other businesses are small and generated just £5.2m in PBT in aggregate in 2021; some are loss-making. They can potentially create significant value in the long term, but this is not in our investment case.
COVID-19 boosted profitability for the whole motor insurance sector, because less driving meant fewer accidents, more than offsetting lower premiums and higher cost inflation. Admiral’s group PBT grew 52% between 2019 and 2021, primarily driven by higher profits in U.K. Motor. However, since 2021, driving frequency has begun to normalize while claim cost inflation has become even more elevated, creating pressure on industry profits.
As we described in our June update, U.K. motor insurance pricing appeared to have started to increase for new policies, but they were still down year-on-year for renewing policies, leading to a 5% year-on-year decline in the overall average premium in Q1 2022. There was anecdotal evidence of further price increases in April.
However, it is now clear that claim cost inflation accelerated significantly in Q2 2022, impacting the whole sector.
Claim Cost Inflation Accelerated in Q2
Claim cost inflation accelerated significantly in Q2, surpassing levels expected by many insurers.
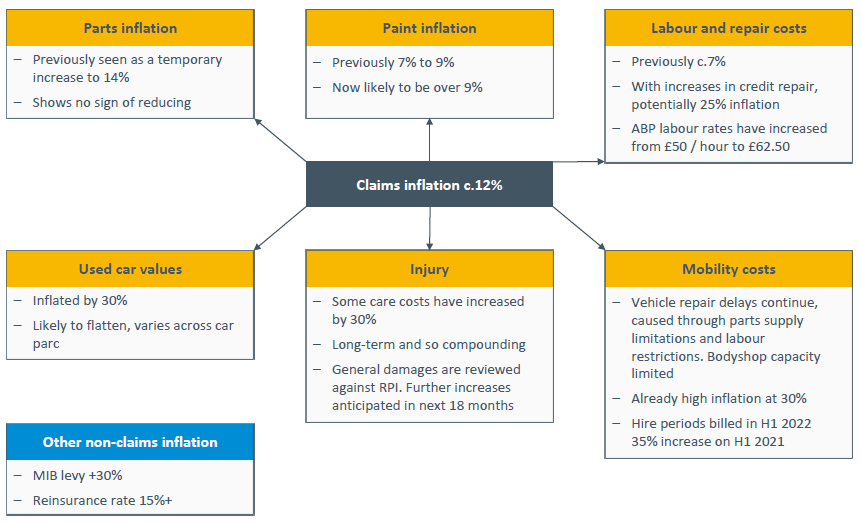
Claim cost inflation was driven by multiple factors, including used car prices, supply chain disruption affecting repair times and costs, higher labor costs and higher reinsurance costs, as this slide from Sabre Insurance shows:
| U.K. Motor Claim Cost Inflation by Component (Estimated) Source: Sabre Insurance update presentation (H1 2022). |
Sabre estimated claim cost inflation to be at 12% this year, while Direct Line estimated a figure of 10% and Hastings estimated one of 10-12%. (Hastings’ figure is for their whole business, but their business is predominantly motor.)
The acceleration in claim cost inflation was described as concentrated in Q2 and a surprise by Direct Line CFO Neil Manser on their H1 earnings call , as delays in repairs also delayed insurers’ awareness of higher prices:
The combination of progressive ways of inflation together with settlement delays, particularly on third-party claims, has reduced visibility. We knew inflation was there, and we've been pricing for it, but the real extent has only come through in the second quarter.”
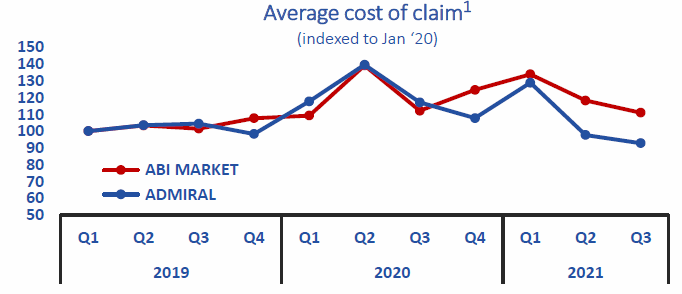
Actual claim cost inflation will be different for different insurers, depending on the profile of their claims, their cost control, and their reinsurance arrangements. Notably, Direct Line stated that its own garage network managed to do much better than external providers, for example on key-to-key times (with a 19% increase, vs. 29% externally) and total-cycle times (36% vs. 62%). Admiral had described similar advantages in its claims handling processes, and stated that these led to an almost 20 ppt advantage over the market in claim cost inflation in 2019-Q3 2021:
| Average Cost of Claim – Admiral vs. Market (2019 to Q3 2021) Source: Admiral results presentation (2021). |
We expect Admiral’s claim cost inflation to be the most similar to Direct Line, i.e., at around 10%.
Material Margin Shrinkage This Year
Admiral’s competitors reported a material shrinkage in their underwriting margins.
The margin shrinkage is at least partly a mathematical result of claim cost inflation accelerating unexpectedly. Direct Line, Hastings and Sabre Insurance all claimed to have raised prices ahead of the market, for at least part of H1. However, as U.K. motor insurance policies are typically annual, H1 2022 claims can be on polices priced as much as a year ago. Claim cost inflation was much lower last year - Direct Line, for example, talked of a medium-term claim cost inflation range of 3-5% last August.
Claim frequency has also increased this year as driving behaviour normalized from the pandemic. Direct Line stated that driving hours have returned to pre-COVID levels, but claims frequency had stabilized at 10-15% lower than before. It is not clear whether insurers have priced in the rebound in claims frequency correctly.
In any case, both Direct Line’s Motor business and Sabre Insurance reported H1 2022 Combined Ratios that were approximately 25 ppt worse year-on-year, and worse than in H1 2019; Hastings’ Combined Ratio was 16 ppt worse year-on-year (its pre-2021 figures are not comparable since it was acquired in November 2020):
| Underwriting Ratios – Admiral & Competitors (Since H1 2019) Source: Company filings. NB. Approximately 90% of Hastings’ policies are in Motor. |
A higher Current Year Loss Ratio was the main driver for the higher Combined Ratio, though reserve releases were also lower year-on-year. Expense Ratios increased at Direct Line Motor as its premiums shrunk year-on-year.
We expect Admiral’s Combined Ratio to also show a deterioration in H1 2022, though this is hard to predict as Admiral has traditionally had more reserve releases in its reported Combined Ratios.
Relatively Flat Volumes
Admiral’s competitors had flat or slightly down volumes in H1, due to both above-market price increases and a general increase in customer retention as a result of FCA “price laddering” reforms.
| Policy Count & Premiums – Admiral & Competitors (H1 2022 vs. Prior Year) Source: Company filings. |
Direct Line Motor policies fell 0.8% year-on-year in H1, and Gross Written Premiums (“GWP”) fell 6.5% due to the lower policy count, a lower risk mix and “structurally lower claims currency”. Management stated that customer retention in its Motor business was up 6 ppt year-on-year.
Hastings’s total policy count was up 3.2%, but the growth was “largely” in Home. Motor policies were “largely constant” year-on-year, and Motor GWP was “lower” compared to H1 2021.
Sabre Insurance reported high-teens growth in both policies and GWP, but this was entirely due to its new taxi and motorcycle businesses. In Motor, the policy count was down 6.1% and GWP was down 10.9% year-on-year.
We expect Admiral to also have maintained pricing discipline, so its policy count should be roughly flat in H1, while its GWP should be slightly down due to the reduction in average premium across H1.
Profitability Expected To Recover
Both Direct Line and Sabre Insurance have raised their pricing to fully reflect inflation:
During July, we've returned to writing our target margins based on our latest view of claims, following pricing action taken and through deployment of new pricing models”
Neil Manser, Direct Line CFO (H1 2022 earnings call)
“Following pricing adjustments to catch up with exceptional inflation in 2022, current policies are being written within our target CoR (Combined Operating Ratio) range”
Sabre Insurance Management (H1 2022 presentation)
Direct Line now expects to return to the high end of its 93-95% Combined Ratio target range in 2023, after an anticipated 96-98% in 2022. Sabre Insurance expects to achieve Combined Ratios in the mid-80s in 2023 and around 80% in 2024, after an anticipated mid-90s figure in 2022 (compared to a mid-70s target historically).
The prospects for a recovery in profitability also helped by tentative signs that other insurers are also raising their prices more aggressively, as Direct Line CEO Penny James commented on the call (on U.K. insurance in general):
We did see some limited upward price movement in the second quarter and have started to see bigger steps taken by some key players in the last two weeks”
A market where competitors are raising prices and maintaining old margin targets should represent a benign environment for Admiral, enabling it to also return to the previous levels of profitability.
Sector Profitability Is Intact
We believe sector profitability in U.K. Motor insurance remains intact.
Claim cost inflation itself is not the issue; it is the lagging of premium price increases that caused underwriting profit margins to shrink. We have now seen Admiral’s peers pricing in inflation fully and targeting a return to previous Combined Ratio targets – these bode well for long-term sector profitability.
We do not have the same visibility on Admiral’s smaller peers, who are often private or small subsidiaries of listed non-U.K. insurers. However, these are often weaker players with much less efficient cost structures, many of them are much less well-capitalized, and claim cost inflation is a global phenomenon. We believe the pressure on them to raise prices to recover profit margins will be at least as acute.
As we described last time, U.K. Motor Insurance is a cyclical industry, and periods of price weakness are often followed by strong and prolonged price increases, such as the double-digit rebound in 2016-17:
| U.K. Motor Insurance Premiums Year-on-Year Change (2014-19) Source: Admiral results presentation (H1 2020). |
Admiral has been a key beneficiary of such “up” cycles, as it can gain significant market share by increasing prices less quickly than competitors, though this also means a delay before its earnings also expand significantly:
| Admiral UK Motor Growth Rates (2015-19) Source: Admiral company filings. |
We believe Admiral will again be the winner in U.K. Motor in the next few years.
Valuation: 7%+ Dividend Yield
With shares at 1,965.9p, relative to 2019 financials, Admiral is trading at a 13.2x P/E and a 7.1% Dividend Yield:
| Admiral Earnings & Valuation (2019-21) Source: Admiral company filings. |
Relative to 2021 financials, Admiral is trading at a 10.0x P/E and a 9.5% Dividend Yield:
2019 financials are more representative, as 2020 and 2021 benefited from lower claims frequency due to COVID-19; 2021 also included cash proceeds from the Price Comparison Website (“PCW”) disposal. However, Admiral now insures 12% more vehicles in the U.K. than in 2019.
Admiral targets paying out 65% of its EPS as regular dividends, and has paid special dividends every year. Including special dividends, the Payout Ratio has been near 90% in recent years. 2022 will also see the final of three 46.0p additional special dividends that were funded by the PCW disposal.
Illustrative Return Forecasts
We keep the assumptions in our forecasts unchanged:
- 2022 Net Profit of £437m
- From 2023, Net Profit to grow at 8% annually
- Share count to grow at 1% annually
- Dividends to generally be 90% of EPS
- For 2022, the third 46p dividend from the PCW sale will also be paid
- 2025 P/E of 20.0x, implying a 4.5% Dividend Yield
Our 2025 EPS forecast is unchanged at 177.2p:
| Illustrative Admiral Return Forecasts Source: Librarian Capital estimates. |
With shares at 1,965.9p, we expect an exit price of 3,544p and a total return of 104% (26.9% annualised) by 2025 year-end.
Conclusion: Is Admiral Stock A Buy?
We reiterate our rating on Admiral Group PLC stock.
For further details see:
Admiral: Reviewing Competitor Results Ahead Of H1 Report