AFT - AFT: Deep Discount Persists As Do The Distribution Boosts
Summary
- AFT is at an attractive and compelling deep discount.
- However, it lags peers, so the larger discount could be warranted if, in the future, the weaker performance persists.
- The fund has raised its distribution five times this year, with more to come potentially.
Written by Nick Ackerman, co-produced by Stanford Chemist. This article was originally published to members of the CEF/ETF Income Laboratory on December 20th, 2022.
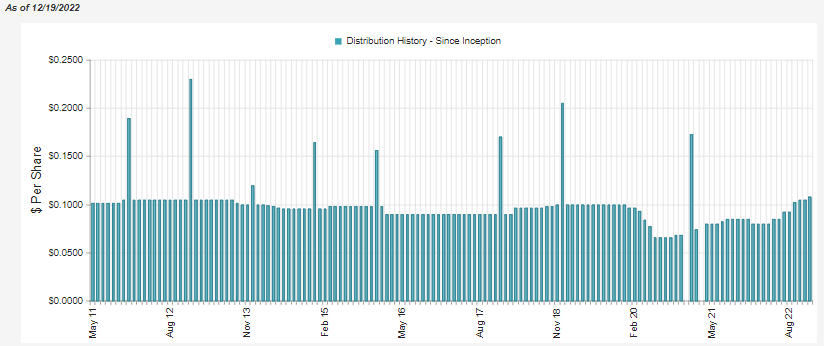
Apollo Senior Floating Rate Fund ( AFT ) has provided five distribution raises this year. Taking the distribution from $0.08 per month to $0.1080. I'd even suspect that we have more boosts to go before all is said and done.
So the fund has put up some strong results in the form of income generation to be able to boost its payout to shareholders. It's also been able to fall less than other fixed-income asset classes due to its senior loan focus.
Yet, it has only been rewarded with an ever-increasing discount. The last time we covered the fund in September, the discount was ~13.5%. This has now moved out to 14.85%. This was also a fund that began the year at around a 2% discount.
It isn't all risk-free and good news. There is some merit to the declines. For one, it's a leveraged fund, so any downside move is amplified. The reason for the downside is that senior loans aren't completely immune to interest rate sensitively. While severely reduced, it isn't zero.
Additionally, senior loans - while being safer than bonds - are still generally junk-rated. Heading into a potential recession next year could pressure these companies to which the loans are given.
Speaking of higher interest rates being a benefit, higher interest rates can only benefit a floating-rate-exposed fund for so long. That also includes business development companies that primarily invest in floating-rate loans too. The problem is that with financially weaker companies, there is a point where yields get too high.
You can't go from paying ~6% floor rates to 10%+ without at least some companies struggling with the added loan interest. Not to mention that rates are expected to go higher from here. So what is a direct benefit can sometimes become too overbearing for the payer.
With that caveat out of the way, I think AFT is relatively attractive. The discount seemingly is already discounting at least some of these major headwinds that will be faced in the next year.
The Basics
- 1-Year Z-score: -1.19
- Discount: -14.85%
- Distribution Yield: 10.55%
- Expense Ratio: 2.36%
- Leverage: 36.66%
- Managed Assets: $354.6 million
- Structure: Perpetual
AFT's investment objective is "to generate current income and preservation of capital through a disciplined approach to credit selection." To achieve this, the fund will invest "at least 80% of its managed assets in floating rate senior loans and investments with similar economic characteristics."
I've said it before, and I'll say it again, the expense ratio here is a huge negative. I'm generally not one to be concerned with expense ratios, either. Apollo ( APO ) is a private equity firm, and they are acting as if AFT is one of their private funds or something. This is on the upper end, well ahead of peers.
Invesco Senior Income Trust ( VVR ) has an expense ratio more in line with what could be considered standard at 1.53%. BlackRock Floating Rate Income Strategies Fund ( FRA ), which I also own, has an expense ratio of 1.17%. I'll look over high expense ratios if the performance is justified; for AFT, it doesn't seem to be.
When including leverage expenses, it climbs to 3.53%. So while the portfolio also benefits from rising interest rates, the lender to AFT's credit facility is also benefiting in terms of AFT having to pay more on their borrowings as well. They pay an interest rate of LIBOR plus 0.825% . With LIBOR steadily rising due to the Fed raising rates, the 1.30% average annual interest rate they were paying is now pushing to over 5%.
Performance - Attractive Discount, But Performance Lacks CEF Peers
When looking at AFT relative to several unleveraged ETFs, we can highlight how much better senior loans have performed relative to bonds. Bonds are traditionally going to be fixed rates. Senior loans also have a preference when it comes to a potential bankruptcy even.
Below, we look at Invesco Senior Loan ETF ( BKLN ), a representation of the senior loan space. We also have iShares iBoxx $ Investment Grade Corporate Bond ETF ( LQD ) and iShares iBoxx $ High Yield Corporate Bond ETF ( HYG ). If the names weren't clear enough, those represent investment-grade and high-yield bonds, respectively.
YCharts
AFT has come somewhere between BKLN and HYG on a total NAV return basis. This is to be expected as AFT actually carries some exposure to high-yield bonds. It's quite small, but it is there. Additionally, the fund's leverage means that any downside is amplified. The higher expense ratio and portfolio positioning are also going to be factors.
In particular, I think the expense ratio is something worth noting. As mentioned above, VVR and FRA have more moderate expenses. Over the long run, AFT has been the underperformer of this trio. I believe a higher expense ratio and higher relative exposure to high-yield bonds this year are also contributing to some of this underperformance.
YCharts
Where we see that play out more is when we look closer on a YTD basis for the funds. AFT is clearly the laggard. On a side note, the sharp drop in VVR that was being shown didn't really happen.
Well, it did, but it was because they paid a special of $0.1239 , where the ex-dividend was on the 16th. For whatever reason, YCharts (and CEFConnect) aren't showing this special. That makes it seem like a large drop came out of nowhere, when normally it would be tallied in with total returns. With that, the results would be more in line with FRA.
YCharts
Where AFT gets some points over VVR and FRA is the fund's current discount is deeper than the others. At the same time, the fund had a higher valuation heading into the year. All three funds have seen their discounts widen out for the reasons I highlighted at the article's opening.
YCharts
Distribution - 5 Boosts With Potentially More To Come
In our last article, we highlighted that they were raising their distribution, and more distribution raises were likely coming. We got that in October and now another one in December. That's brought the total number of raises to five this year. They've now eclipsed the pre-COVID payout and touched a new all-time high distribution.
With rates only rising further and another 50 basis points announced after their latest raise, there's a good chance we will see more boosts in 2023. They might be more moderate raises rather than the larger raises we saw earlier this year. This also assumes that things don't start breaking down too badly in the underlying portfolio with a collapsing economy.
They haven't posted a new report since our previous update. The next annual report should be available sometime near the end of February for the full year 2022.
AFT's Portfolio
In total, AFT has exposure to 97 different issuers. Of those issuers, they are carrying 138 total holdings, according to CEFConnect. That makes them a relatively more narrowly focused portfolio. High-yield and senior loan funds often have hundreds or even thousands of positions to diversify and potentially reduce risk.
On the other hand, a more concentrated portfolio means they also have a greater chance to outperform peers if they select positions properly. For AFT, that hasn't seemed to be the case with the results we saw above - at least not historically. Going forward, that could always change.
The concentration is reflected in the top holdings. The top ten make up 22.6% of the fund's exposure. For some context, FRA's top ten make up 11.76% or nearly half of what AFT's top ten represents.
AFT Top Ten Issuers (Apollo)
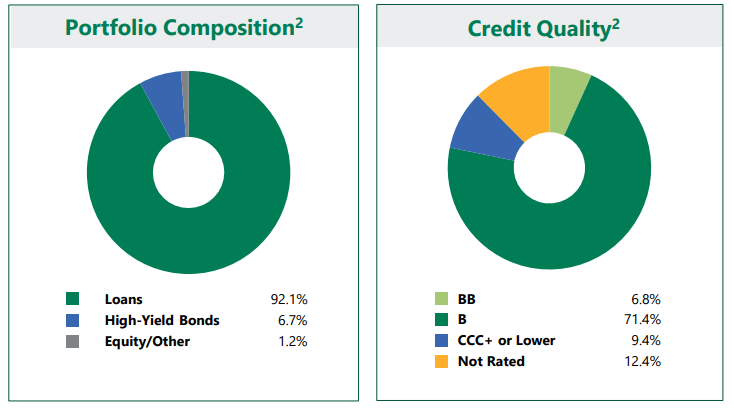
Below, we can see the portfolio composition of AFT. That's where we can see the small weighting to the high-yield bonds in the fund at nearly 7%. We also can see the portfolio is heavily invested in B-rated debt. This is similar to peers, where B is the largest weighting in their portfolios as well. VVR carries a significant weighting to the "not rated" category, but that's after the B slice being the largest.
Sector exposure shows us that they have the highest concentration in high-tech industries, service businesses, and healthcare & pharmaceuticals. This is where trying to compare to other peers is more difficult. Industries are less defined than sectors, meaning that classifications for certain holdings fall into different categories depending on the fund sponsor.
AFT Top Industry Exposure (Apollo)
Conclusion
AFT is at a deep and attractive discount. The discount reflects the headwinds that are on the horizon for the fund. At the same time, the fund should still be able to have more distribution boosts going forward and reduce losses relative to high-yield or investment-grade bonds. At the same time, the fund's higher expense ratio and more narrowly focused portfolio seem to have made it underperform CEF peers. That's where the larger relative discount could compensate for that relatively poor track record. Ultimately, I think I'm quite content with sticking to VVR and FRA.
For further details see:
AFT: Deep Discount Persists, As Do The Distribution Boosts