DE - AGCO: Betting On Higher Margins
2023-11-28 01:56:03 ET
Summary
- AGCO Corporation's margins have improved in recent years, and there are catalysts to keep driving them higher: the Fendt brand, Precision Agriculture, and the global parts business.
- Current PE and Price to Free Cash Flow multiples are lower than historical levels without deterioration of fundamentals.
- Management has set a goal of achieving a 12% operating margin by 2026, which will lead to favorable stock performance.
The 10-Second Thesis
I've had my eyes on AGCO Corporation ( AGCO ) for a while, and obviously have kept tabs on Deere & Company ( DE ) as well since they are the main players in the industry. However, since I tend to favor small and mid-caps (62% of my portfolio), I have been waiting for a good opportunity to invest in the Georgia-based company. I finally did it on November 22 and the rationale is rather straightforward. Margins have been improving since 2016 but there is still a gap between AGCO's and DE's margins that I believe is likely to get narrower in the future. If management's 12% operating margin goal comes to fruition, shareholders can expect an annualized return above 11% over the next decade. No, I do not know how to time the market, but noticing that the current PE and Price to Free Cash Flow ((FCF)) multiples are within the lowest 20% taking a decade of data, this is likely to be a fairly good entry point. If the stock price drops further, I will feel more than comfortable doubling the size of my position.
Cutting To The Chase
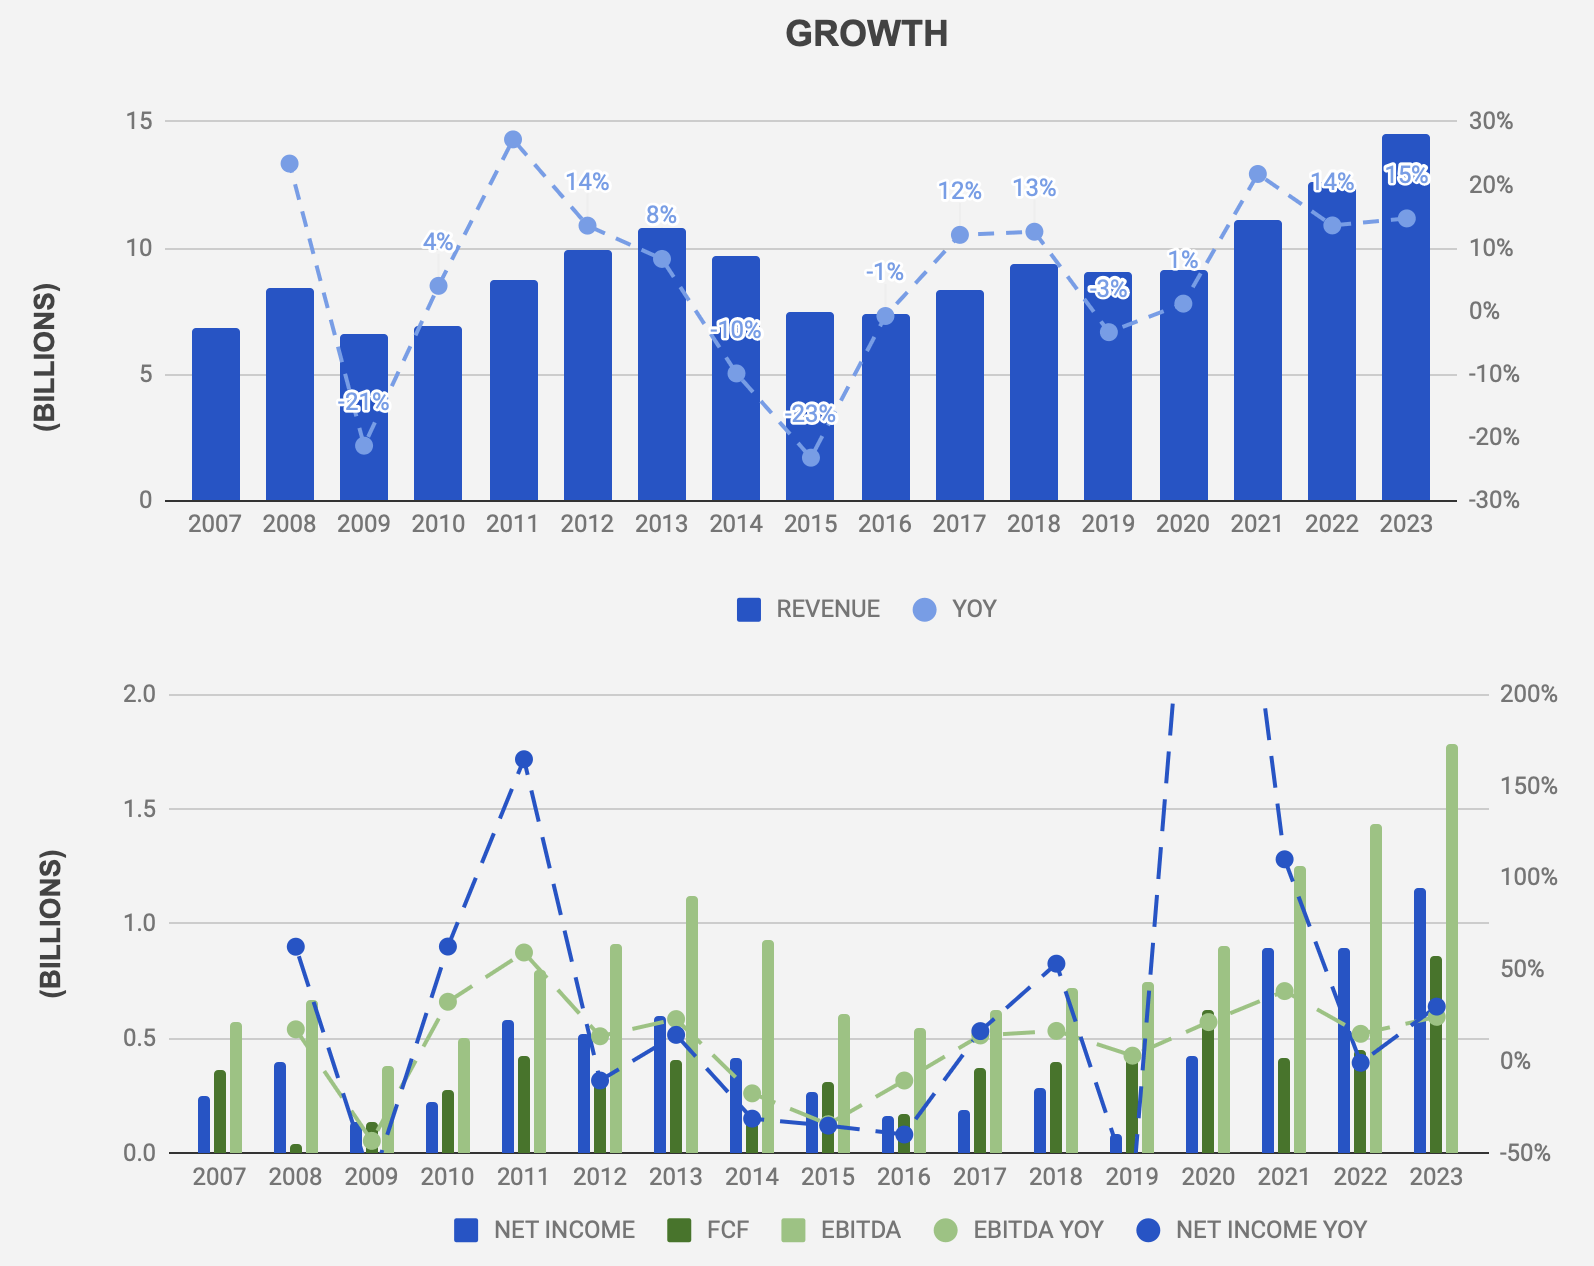
Investors need not worry about AGCO's profitability. The company has not had a single year of negative earnings or negative FCF since 2007 (I have not checked prior years). The question is what profitability has looked like over the years and how likely it is to be in the future. Looking at the data, it's been a bit wavy, mirroring the revenue growth, which in turn mirrors the industry cycles (Figure 1). If one cares to look at DE's numbers, they show similar peaks and troughs. Let's be honest here, none of us know what the cycles will look like in the future. It is likely that we will see at least one low and one high in the next decade, and for that reason, one should not despair if and when the numbers seem to be moving in the wrong direction. Because I do not know how to market hop at precisely the right times, I like to look at the overall picture knowing that at some point my reasoning will prove to be valid. A crude overall analysis is often better than a very detailed one. The more variables thrown into the mix the more errors will likely creep into the numbers.
Figure1: AGCO's Revenue, Earnings and Free Cash Flow Growth (Author)
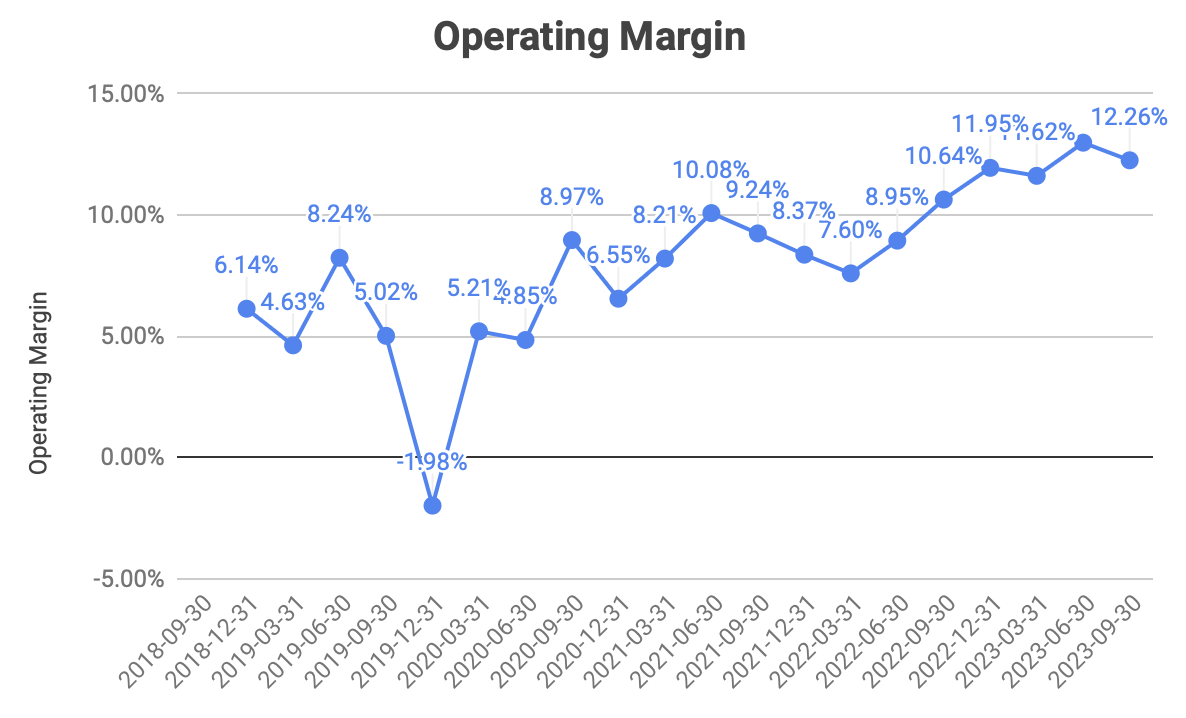
What AGCO has going for it is margin expansion. In addition to growing margins, it is interesting to notice the substantial gap between AGCO's margins and DE's. Although DE's business includes segments that AGCO does not cover (Construction and Forestry), this gap shows that there is room for further improvement. This is something that jumped out when I looked at the numbers, but it is also something AGCO's management is putting emphasis on. During the latest earnings conference call, CEO Eric Hansotia set the goal of achieving a 12% operating margin at mid-cycle by 2026. If we look at the operating margin quarter by quarter, we see hints that the goal is taking shape. The last four quarters' numbers are all above 10%, and we can also see an upward trend starting at the end of 2020 (Figure 2). The negative operating margin during the last quarter of 2019 was due to one-time impairment charges related to the grain and protein segment. If the operating margin is eventually pegged at 12%, the stock performance should respond favorably. And given that DE's average operating margin over the last four quarters is 19.5%, AGCO's 12% goal is likely to be raised again in the future.
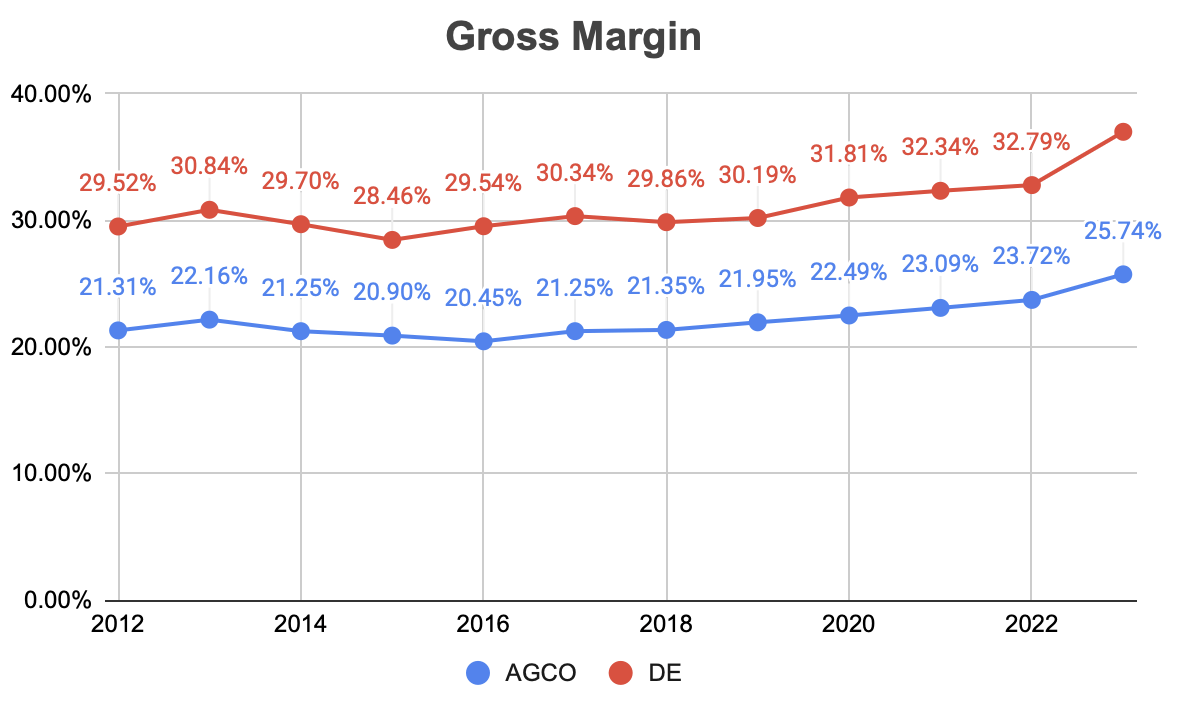
To avoid the noise of one-time expenses, I think it is valuable to start with a gross margin comparison between AGCO and DE to further illustrate the point that further margin expansion for AGCO is likely possible. If gross margin expands, so will the operating and net margins as well. As seen in Figure 3, a consistent gap of about 10% exists between the two companies, and a slight upward trend is in place for both. Unlike DE, AGCO does not break down gross margin by business segment and although there are some differences between the two companies, the similarities would lead us to expect a narrower gap if not similar margins.
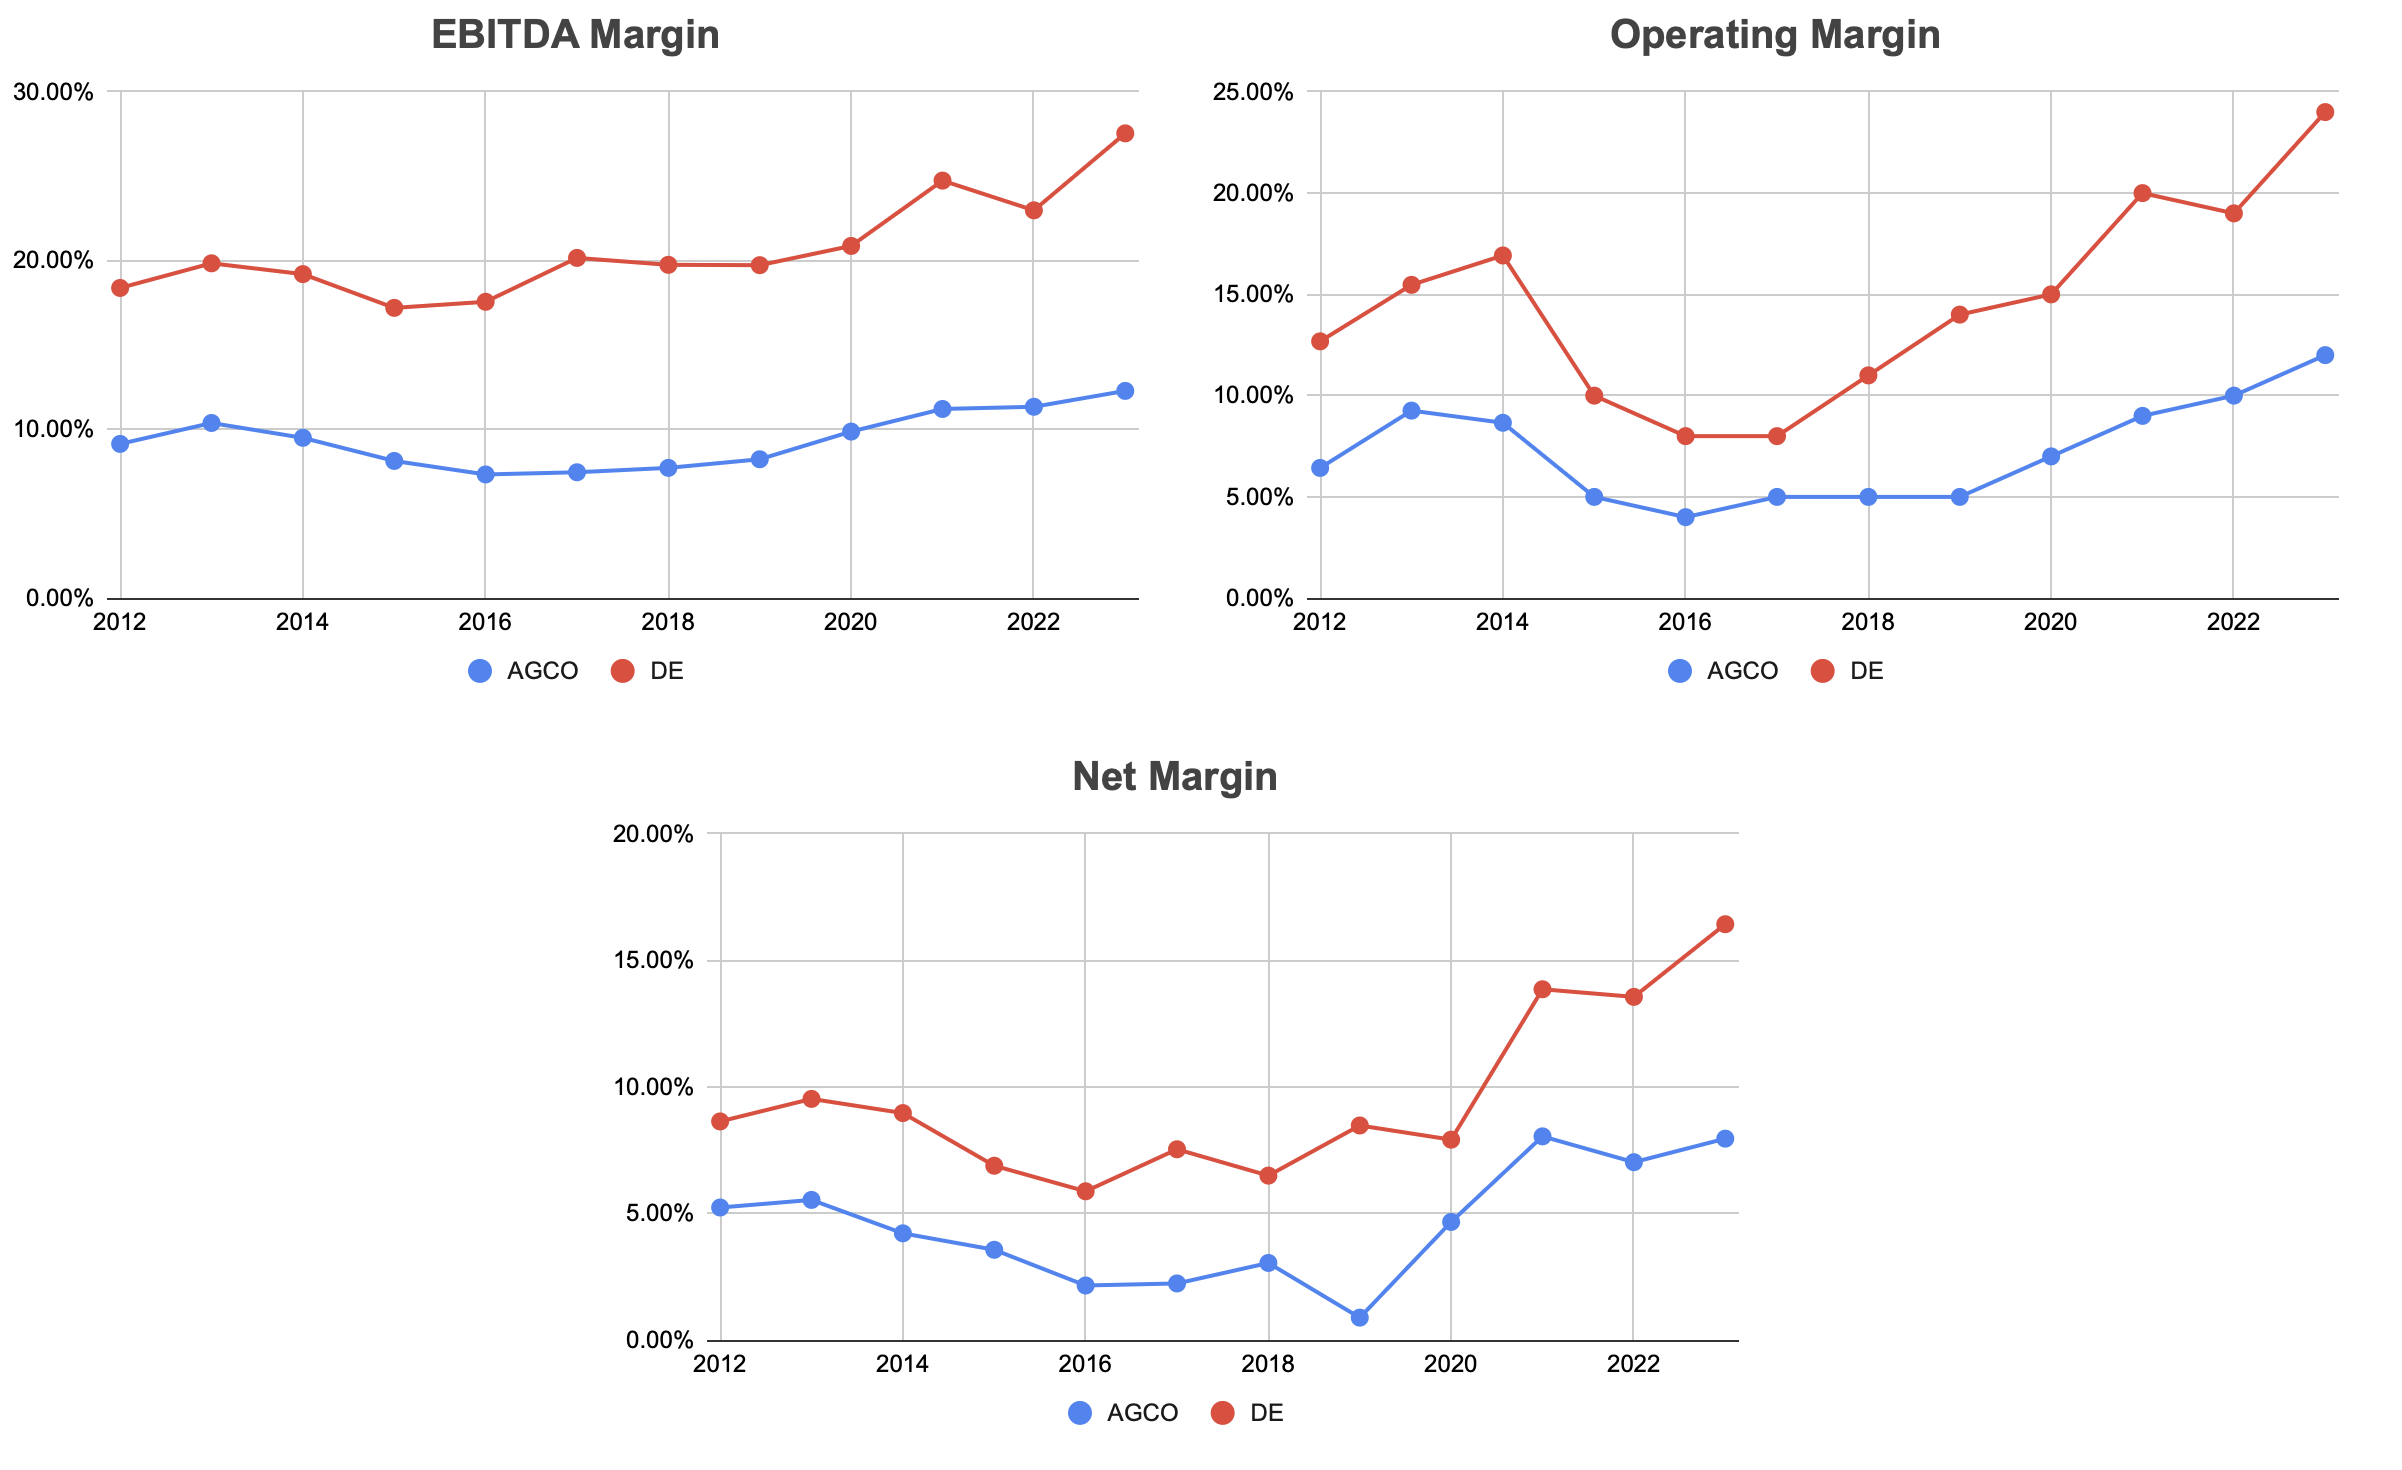
The pattern remains with EBITDA, Operating, and Net Margins (Figure 4). This is likely indicative that one is a better business, but it also hints at the fact that there is ample room for improvement on AGCO's side.
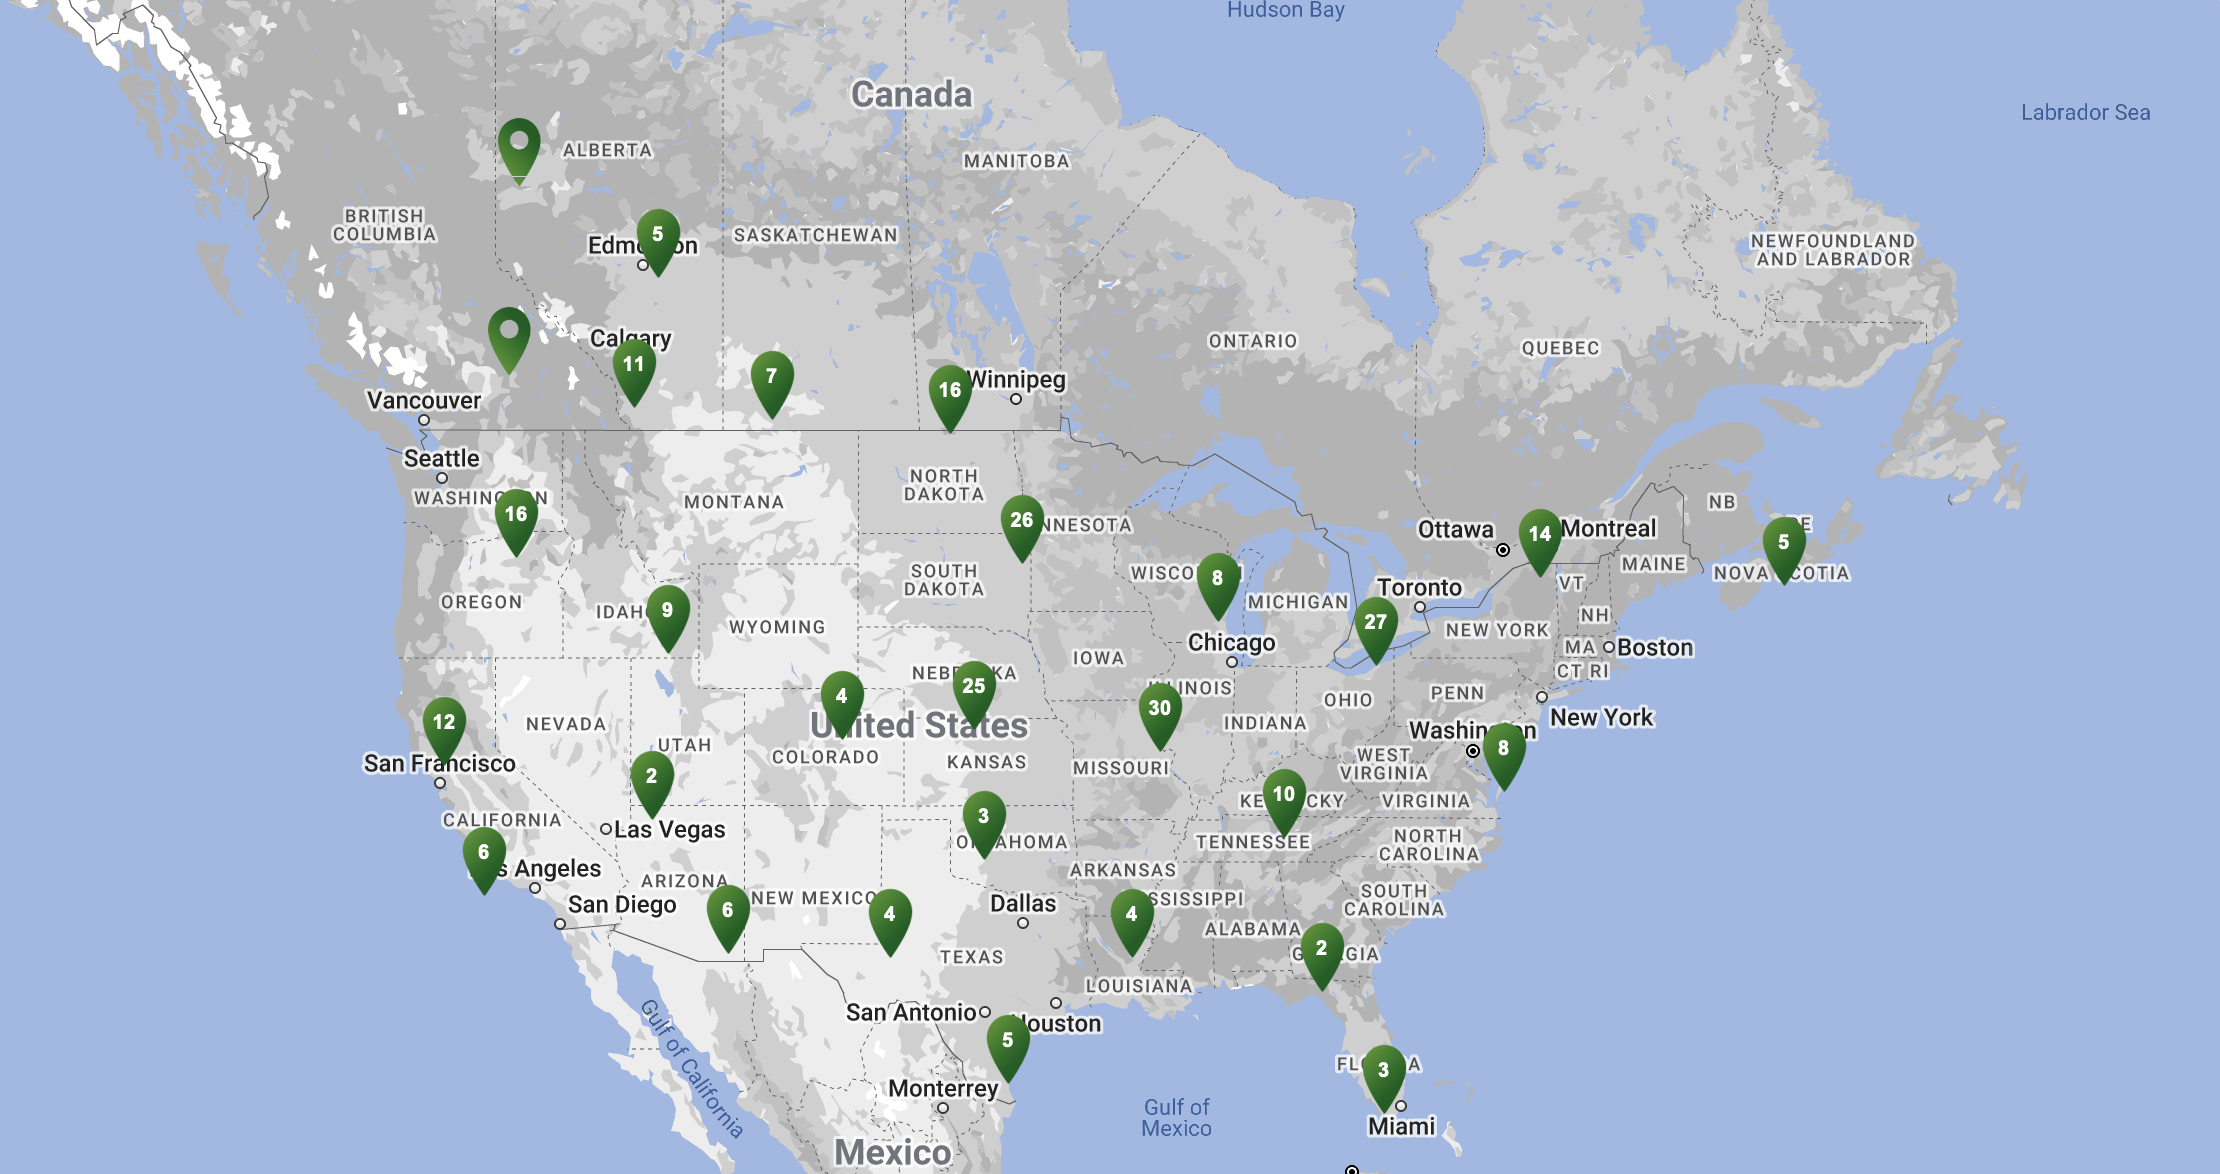
Perhaps I am being optimistic here, but there are signs that support it, one of them being the recent expansion of the Fendt brand in North America which, according to management, is one of the margin drivers. AGCO doubled the Fendt dealership network in 2019 to 189 locations, further expanding it to about 270 today based on Fendt's dealership map (Figure 5). Answering an analyst's question during the latest conference call, AGCO's CEO Eric Hansotia said he expects the current 75% market coverage to further expand to 95% coverage over the next couple of years. Rumors have it that the Goliath DE, 10 times larger than AGCO, has taken notice and has reportedly been incentivizing dealers to disrupt Fendt's expansion . Perhaps it's just the green color that looks so threatening... I am by no means a tractor expert, but John Deere is not the only brand with a good reputation. Fendt and Massey Ferguson are not subpar tractors in comparison. If anything, DE has shot itself in the foot not long ago with the right-to-repair dispute. I will leave that final judgment to farmers though.
I will leave the discussion of other catalysts such as the Trimble joint venture and the growth of the precision agriculture segment for another time.
Why 12% Is Key
To be clear, 12% operating margin is key to my investment thesis only. Without it, the numbers just don't look as attractive. Am I just plugging in the number that suits my wish? Perhaps. But from the arguments I just laid down, 12% actually seems to be fairly conservative. The global farming equipment market is expected to grow at 4.8% per year up to 2028, and AGCO's management thinks the company has enough aces up its sleeves to outgrow the industry by between 4 and 5%. These aces are the continued globalization of the Fendt brand, the global parts business and increased market share of AGCO genuine parts, and the growth of the precision agriculture business. As part of this strategy, AGCO is in the process of acquiring 85% control over Trimble's agricultural business, more on this in a moment.
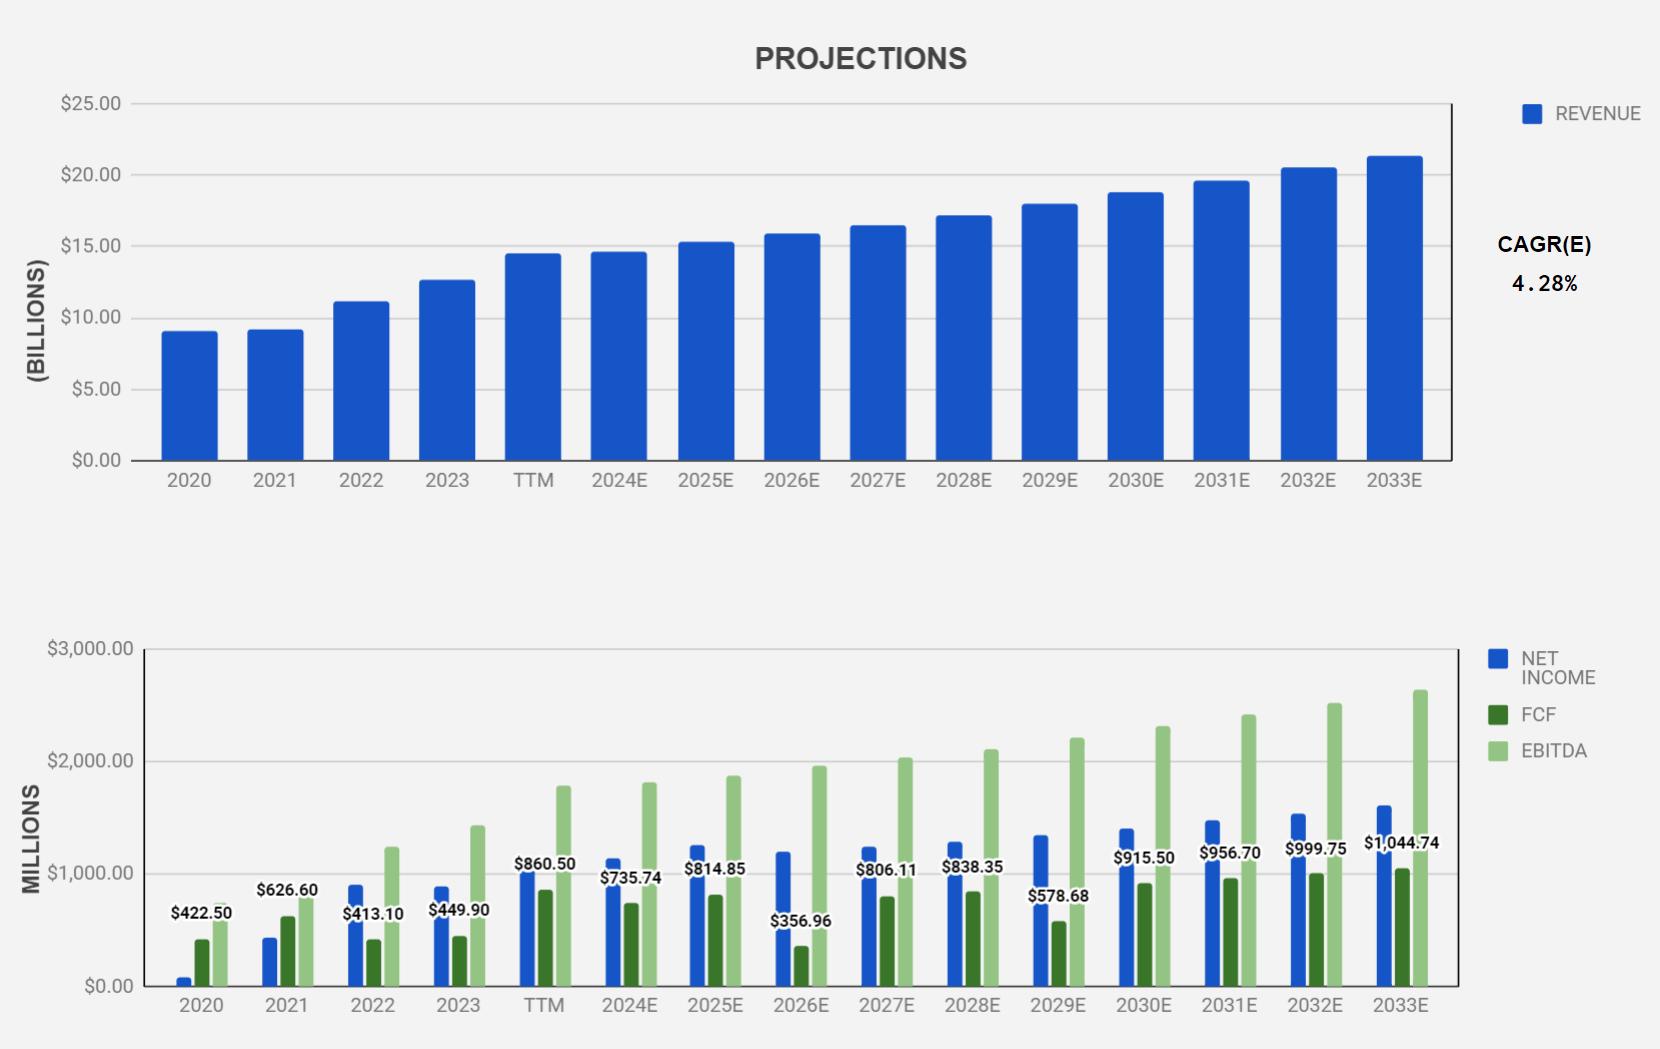
I am a pessimist by nature. Not only I am not projecting revenue growth 4% above the industry, I am assuming a 4.3% growth over the next decade, which is below the expected industry growth. This is where the operating margin becomes key. AGCO is guiding for 75% to 100% FCF conversion from adjusted net income for 2023. I am haircutting that to 65% and using it for the duration of my forecast. The average difference between operating and net margin is 2.88% over 5 years. This is basically the tax and interest expenses, and the latter is going to increase because of the aforementioned Trimble joint venture. AGCO is getting a $2 Billion 365-day bridge loan and expects to finance the transaction with existing liquidity, cash flow from operations, and further debt afterward. If I were to guess based on dividend commitments and past working capital numbers, I would expect new additional debt in the order of $1.2 to $1.5 Billion. I have no idea what the new interest rates are going to be. For that reason, I am going to assume a 4.5% difference between operating and net margin instead of the 2.88% difference. Assuming all debt bears the current EURIBOR rate (which is not the case - based on the latest 10K the interest expense is 0.8% on average), the difference should be closer to 4%, but once again, it does not hurt to add some safety to the numbers. And now it's just simple math: Revenue to net income at a profit margin of 7.5%, 4.5% below the 12% target operating margin, and then a 65% FCF conversion. I do add corrections to FCF in years 2026 and 2029 based on historical FCF conversion - I hate letting the math create a perfect model because reality is never perfect (Figure 6). The internal rate of return ((IRR)) for these predicted cash flows over the next decade ends up at 10.04%. Given the conservative assumptions I made, I expect this to be the floor for the returns of my investment. How conservative are my assumptions? If we take AGCO's expectation of doubling EBITDA in the next 5 years, then my assumptions are extremely conservative since there is no EBITDA doubling in Figure 6. If I decide to put more trust in AGCO's own view of the future, then the IRR becomes 15% to 16%. My "valuation" attempt is more like establishing an expected base return rather than actually trying to pinpoint the likely return.
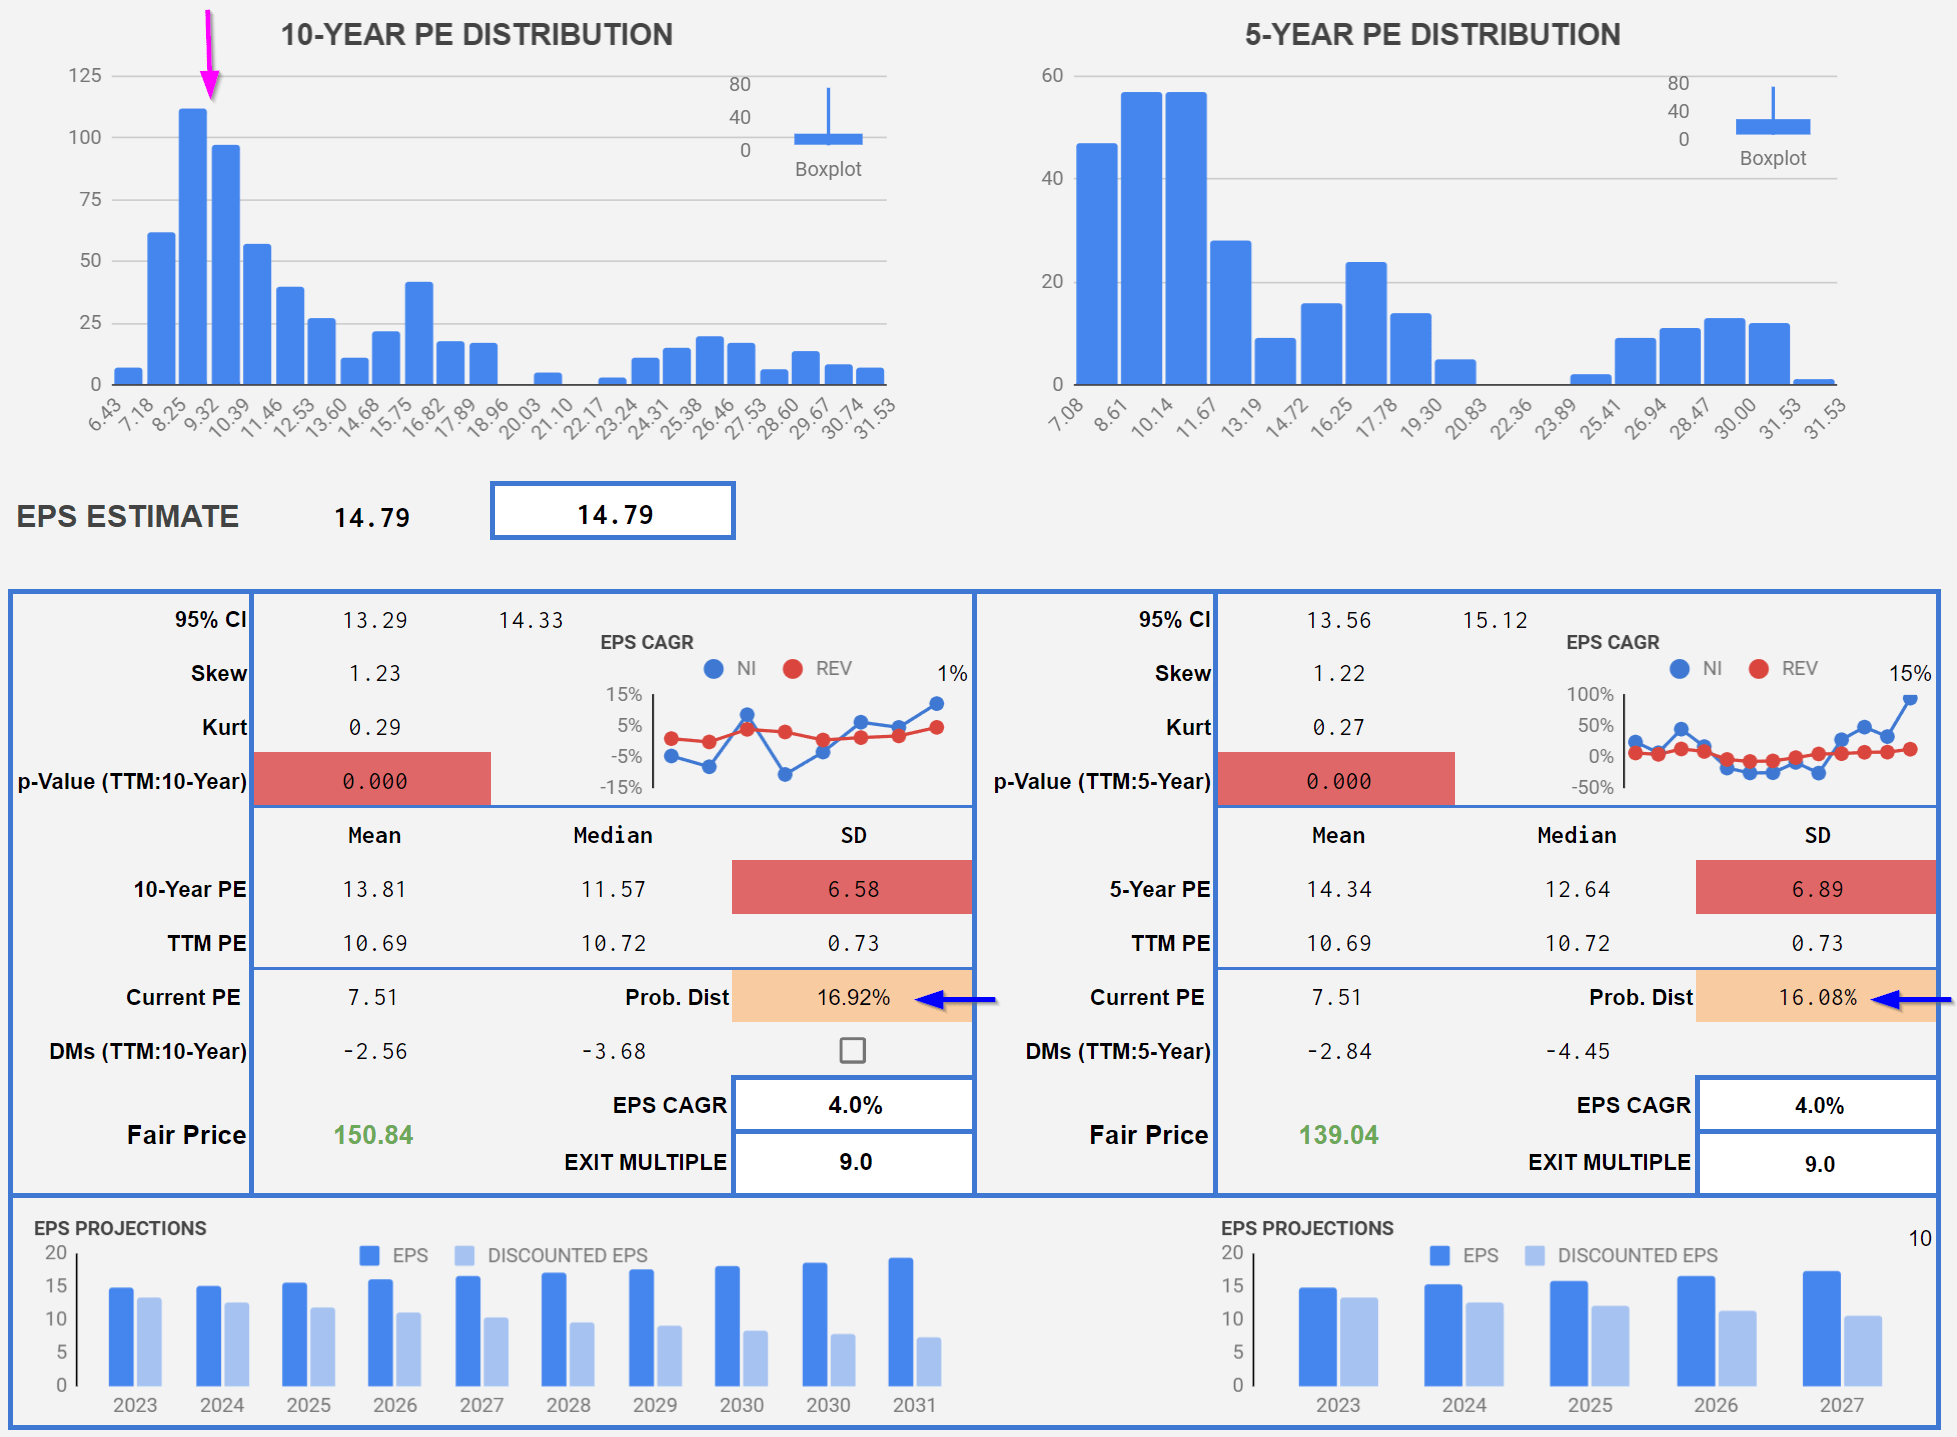
With an IRR of 10%, why do I choose AGCO over an S&P500 index? I might be wrong, but given that the Shiller PE ratio for the S&P500 stands at about 30.8, I reckon that the probability of getting a higher return with AGCO is higher. As I mentioned at the beginning of the article, at the current stock price, the PE ratio is within the lowest 20% in a distribution spanning both a 10 and 5-year period (blue arrows in Figure 7). The distribution appears to be trimodal in either case but even if we ignore any probability calculation, one of the current PE of 7.5 is clearly below the mode around 9 (purple arrow in Figure 7) hinting that the stock might in fact be undervalued. Taking into consideration management's guidance and the expected market growth, I have no reason to believe that the fundamentals are deteriorating, which further supports the undervaluation thesis. If we assume an EPS growth in line with revenue and a multiple expansion from the current 7.5 to 9, the fair price for the stock based on earnings should be around $150 applying the same 10% IRR as our discount rate. Am I out of my mind? If I am, so is Morningstar who estimates AGCO's fair value at $156.
For full disclosure, I initiated my position at an average price of $113.03 per share and have also sold a put contract with a strike price of $105 and an expiration date of January 24, 2024. The investment makes more sense to me between $100 and $115 per share.
What Can Go Wrong?
Many things. The main one is cyclicality really, but I am not able to predict what that will look like nor will I attempt to convince anyone I can. That is why I tend to play safe with assumptions, to begin with. That said, looking at Figure 3, we clearly see that during the down cycle, margins can plunge. Between 2016 and 2018, DE's net margin sunk to between 5.8% and 6.5%. Obviously, AGCO's margins were much worse at about 2 to 3%, a far cry from what I am assuming for the future. I reckon this is a scenario I cannot discard, but, once again, I have no way to tell whether that will happen or not. Cycles are called cycles for a reason. After a low, there is usually a high. The risk I am taking is that of jumping in at the high point. It's not the first time and it will not be the last. With a dividend yield of 1%, that won't do much to soothe the blow.
Higher interest rates do not do any favors to the renewal of agricultural equipment by farmers either, but these seem to be reaching the peak if they have not reached it already.
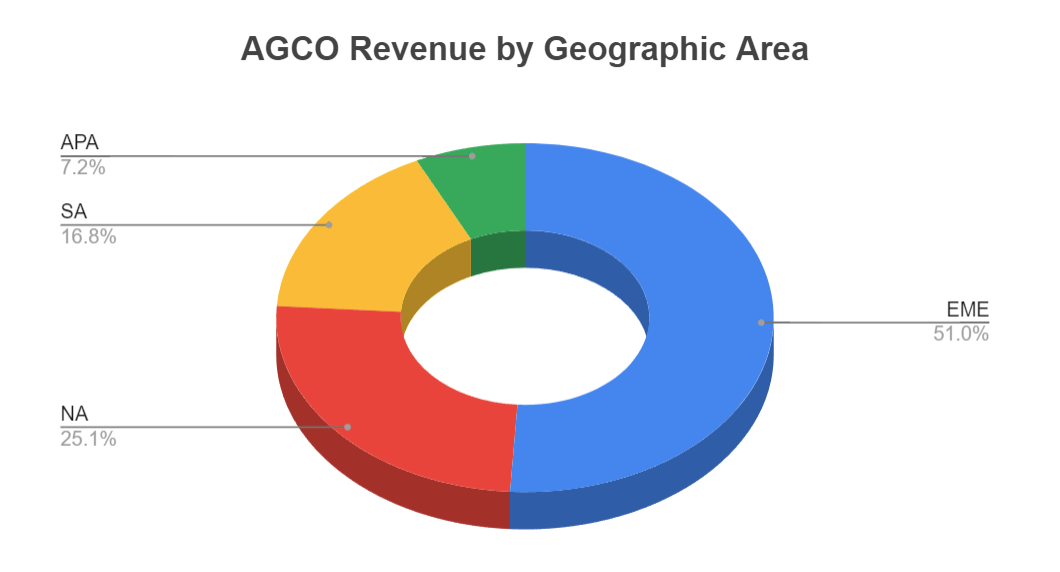
Unlike DE, the majority of AGCO's sales happen outside the US, to be more precise, 75% of revenue compared to 39% for DE (Figure 8). This adds geopolitical, economic, and tax risks that DE does not face to the same extent, although this can also be seen as a catalyst.
Although the 4.3% revenue growth I am forecasting is below the projected global market growth for the industry, it is noteworthy to keep in mind that the current 10-year revenue CAGR is only 3.1% compared to 5.1% for DE. The 5-year growth has expanded to 9.2% and the annual growth over the last 3 years has hit 16.6%. DE has beaten AGCO in all periods. The accelerated growth over the shorter time periods, paired with recent concerns regarding an economic downturn may indeed hint at the fact that we might see a new industry low in the near future. Recent growth has also benefitted from price increases on the back of inflation, which are likely to decelerate in the near future. The 8% price increase for 2023 is likely to go down to 2 to 3% in the coming years according to management.
Final Thoughts
AGCO Corporation has expanded margins in recent years and seems to be well-positioned to keep doing so on the back of expanding its Fendt brand globally, and by investing in its high-margin precision agriculture business. In a scenario where management achieves its 12% operating margin goal and the macroeconomic environment does not deteriorate significantly, AGCO is an attractive investment at the current PE and FCF multiples, which are significantly lower than its historical levels.
For further details see:
AGCO: Betting On Higher Margins