XME - Alcoa: Highly Cyclical And Getting Ready To Run Again
2023-12-04 09:00:40 ET
Summary
- Alcoa Corporation experienced a massive move from $5 to $98 in just two years, and sentiment is now working off the froth from the 2022 high.
- The SPDR® S&P Metals and Mining ETF sector, including Alcoa, may be bottoming and preparing for a strong upside reversal.
- Using the Fibonacci Pinball method, there are likely turning points for Alcoa as the move progresses, providing guidance and risk management.
By Levi at Elliott Wave Trader; Produced with Avi Gilburt.
Talk about massive moves from peak to trough. That is Alcoa Corporation (AA) summed up. After a post-Covid crash panic move to $5, yes $5, it ran all the way to $98 just two years later. A rare 20-bagger for those that rode the entire trip. It has taken some 18 months for sentiment to work off that froth from the 2022 high. Only a few weeks ago, we began to take notice of the possibility for an important low to be forming across the SPDR® S&P Metals and Mining ETF ( XME ) sector with a highlight on AA.
Our weekly videos to members shine the light on either sectors or even specific stocks that appear to be coming into high-probability turning points. We had been paying much more attention to other sectors of the market as XME was recovering form its torrid run up from 2020 to 2022. Where do we find ourselves now?
First, let’s take a look at the fundamental backdrop of the sector with Lyn Alden. Then a specific snapshot of Alcoa at the moment. What is the potential for AA going forward? Where would we turn more cautious? Where could we get more aggressive. We share our methodology that helps us with key levels of support, resistance and targets via the structure of price as it fills out the chart.
Sector And Stock Specific Fundamentals With Lyn Alden
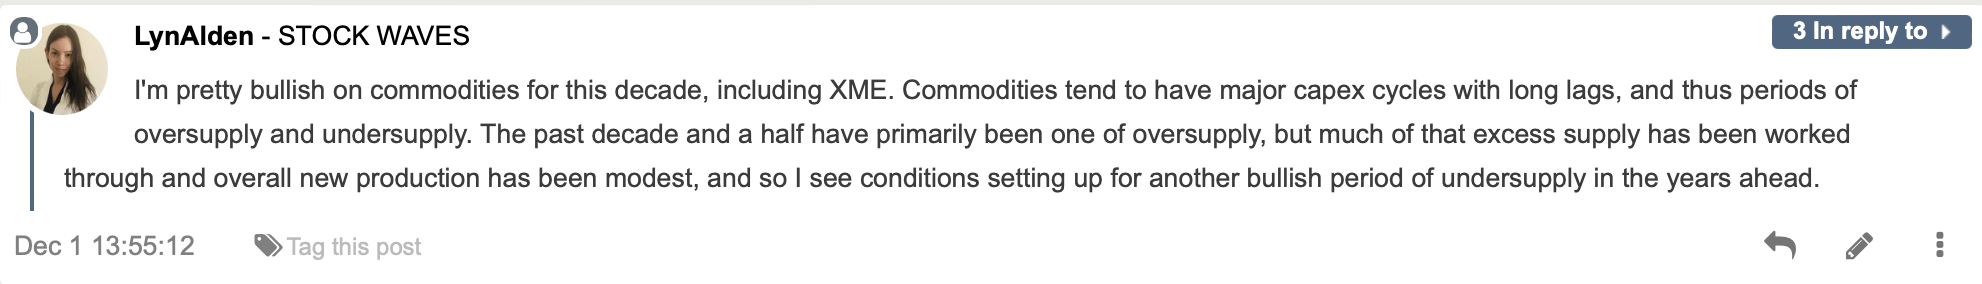
Lyn recently posted this for the membership in regards to XME:
Alright, we’ve got a possible easing of the headwinds. And, it could be a tailwind is coming for this sector. As is always the case, in any sector that begins to run, there will be some tickers that outperform others. What is the fundamental backdrop for Alcoa?
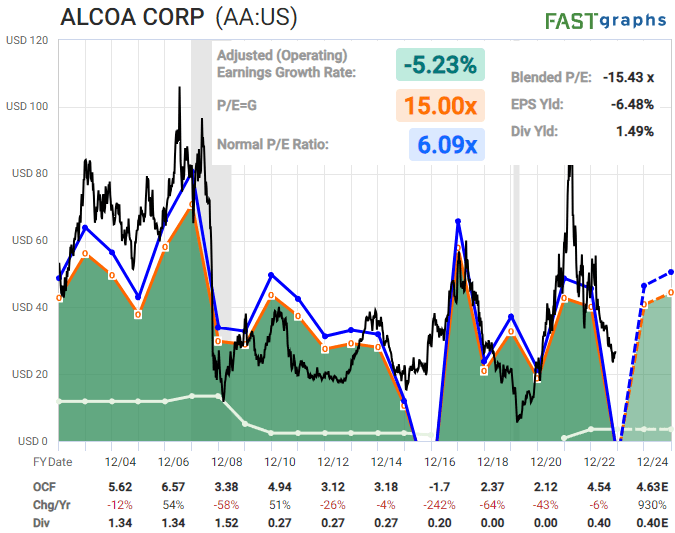
“AA is a good trader's stock based on technicals, but not a great long-term buy-and-hold. It tends not to be particularly profitable, and is not investment-grade in terms of credit ratings.”
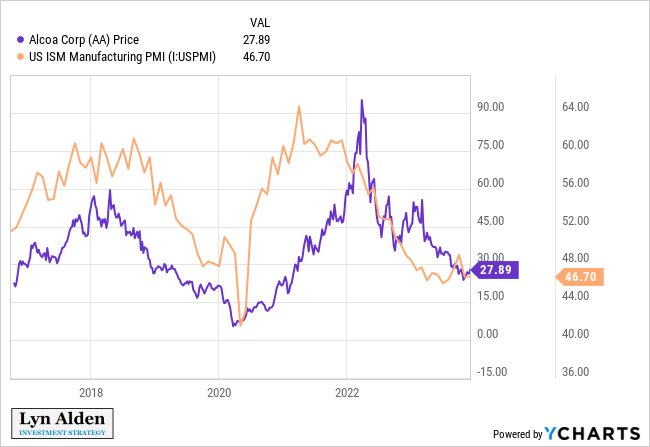
“A useful fundamental check with AA is that its price has correlated with the purchasing manager's index for many cycles to a decent degree.
So if someone wants to trade AA, in addition to the technicals, it also helps to have a view on what the ISM manufacturing PMI is going to do over the next 18-24 months. For the PMI, the next six months are still unclear but are currently low and showing the potential for re-acceleration. I expect PMI to do well over the next two years but I have less conviction on when that uptrend begins.”
We Turn Our Attention To XME And AA
During the video posted on November 9th, it was becoming apparent that the XME sector, and AA in particular, may be bottoming and preparing for a potentially strong upside reversal. Since then, AA has seen a +15% spike, and we think it is just getting started.
XME has seen 10 straight days of up activity, advancing the same +15% from its swing low of 48.77.
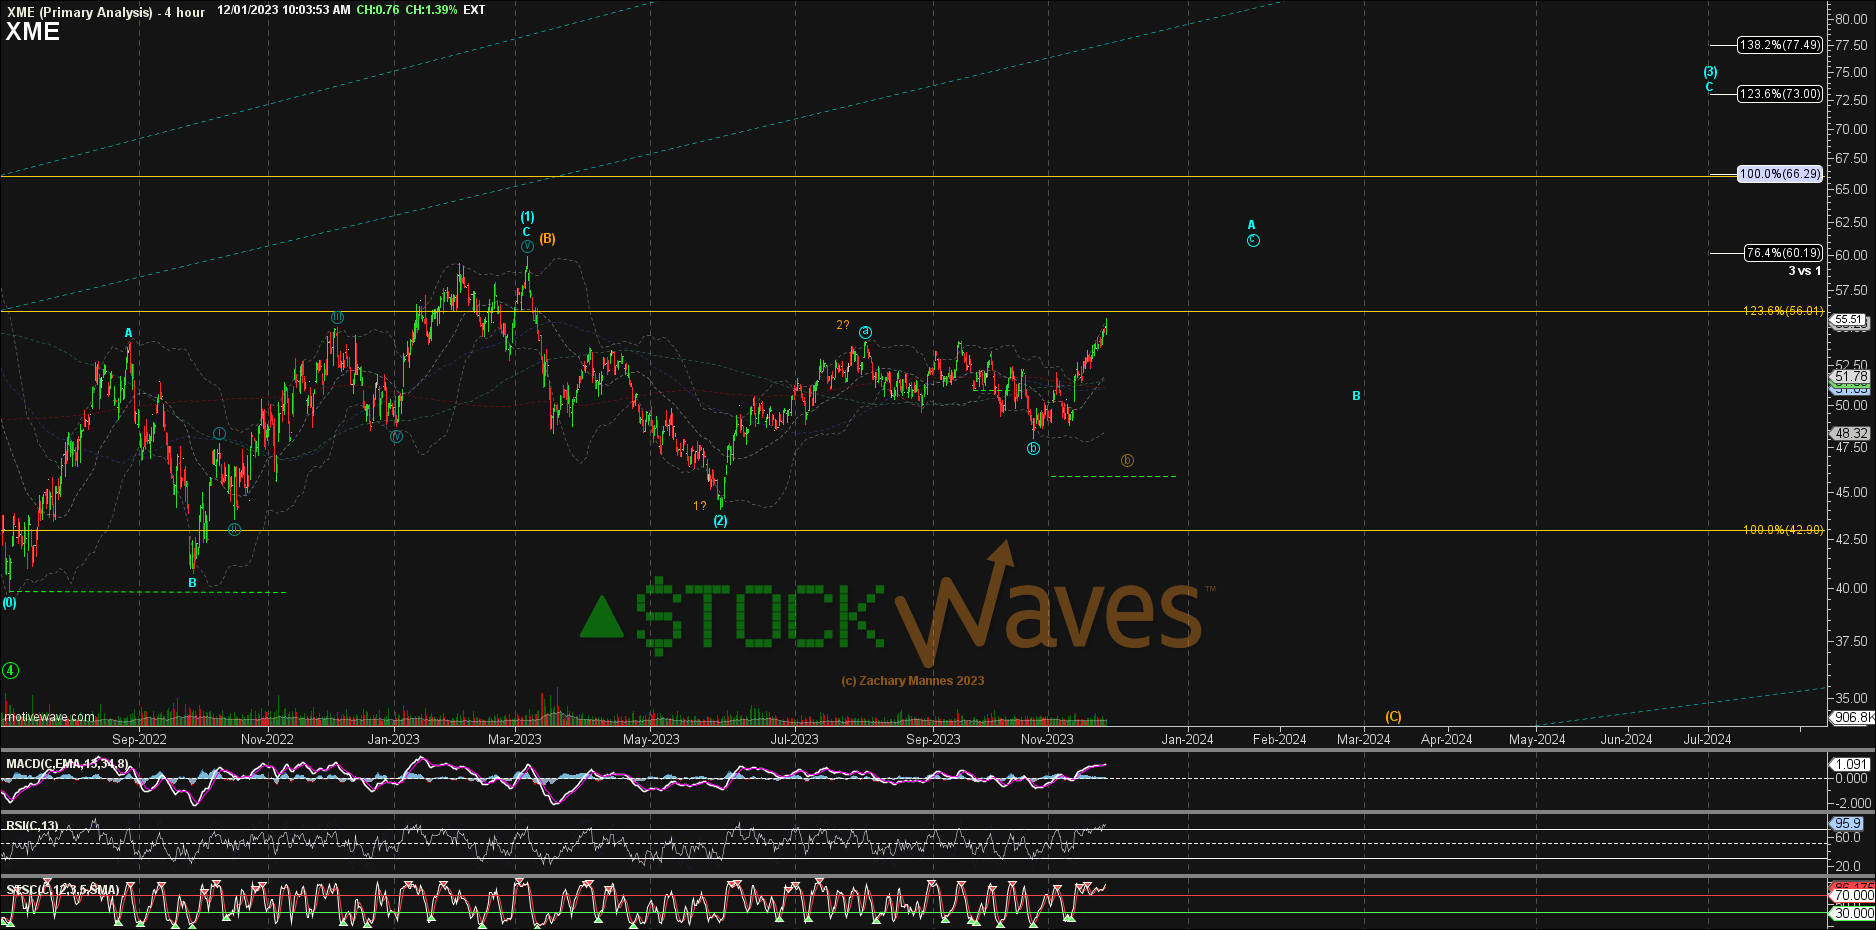
Note that the XME chart is pointing to the 60 area next before a consolidation/pullback sets in. But this is likely just the beginning of a much larger rally structure for that sector.
If price was to move below the 44 level first, though, it would raise a caution flag regarding this current bullish view.
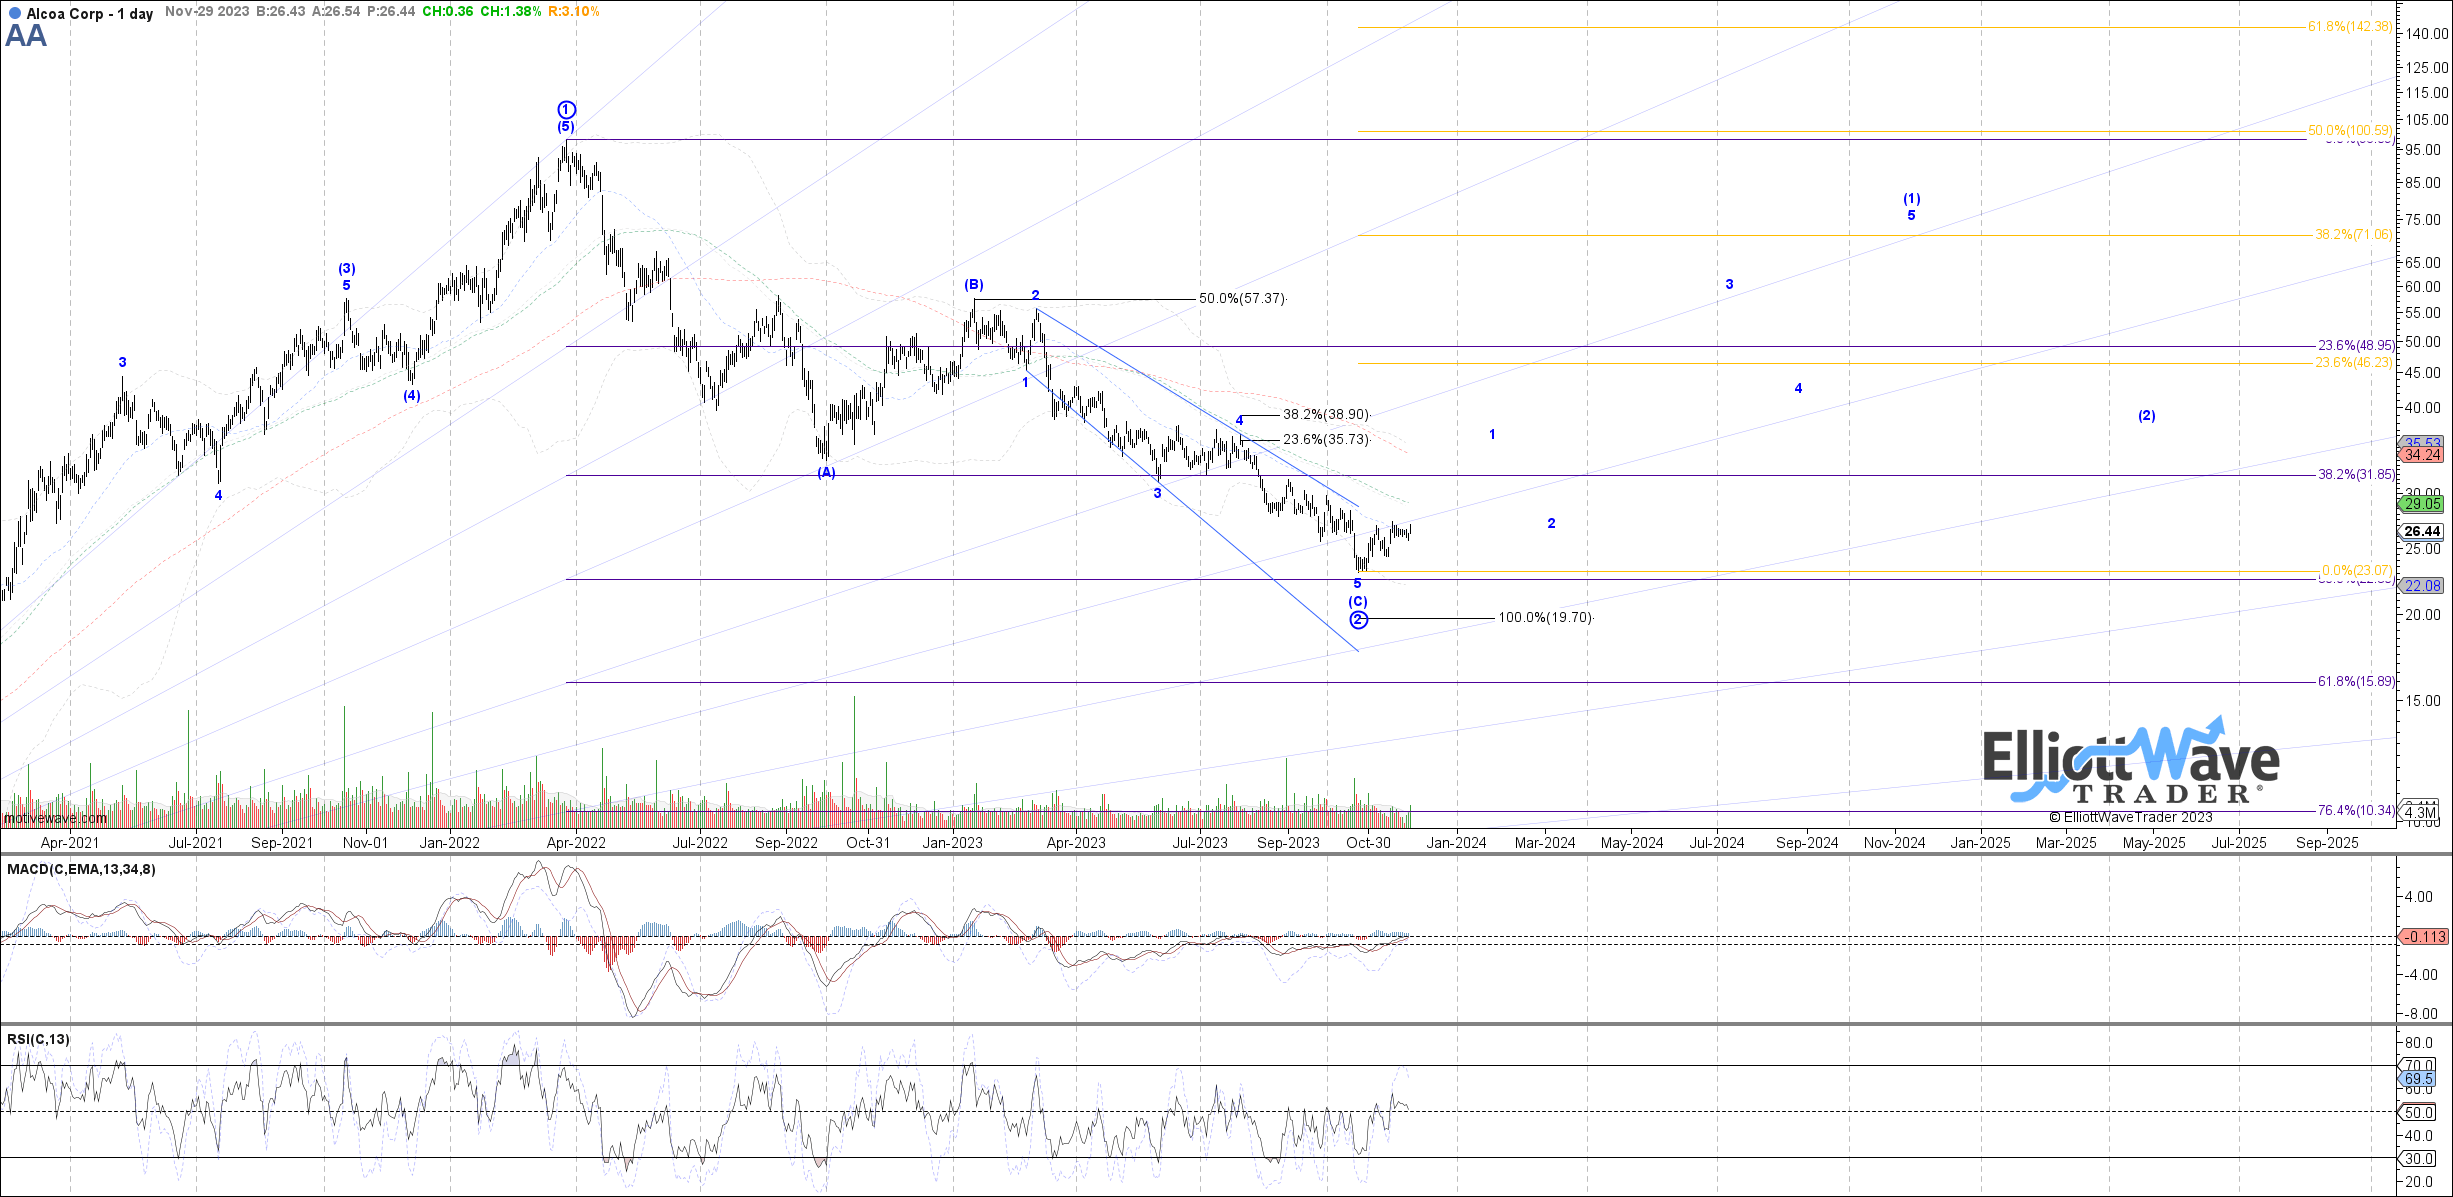
Risk for AA is if price were to break back below 23 before this larger anticipated advance unfolds. That would suggest a move back down to as low as 19 to 20 in a deeper correction. However, given the current strong bullish reversal and the larger structure of price as we are able to see it, it would appear that there is a significant rally taking hold.
As you can see in the chart above shared by Garrett Patten, the rally in AA may just be in its initial stages. Into 2024, price may be attempting a move back up toward the 2022 highs, should the structure continue as illustrated. We will have a much better grasp of this potential once the lesser degree waves 1 and 2 of this larger wave [1] complete.
Fibonacci Pinball - How Can It Help You With AA And More?
Avi Gilburt has shared this many times with with our membership:
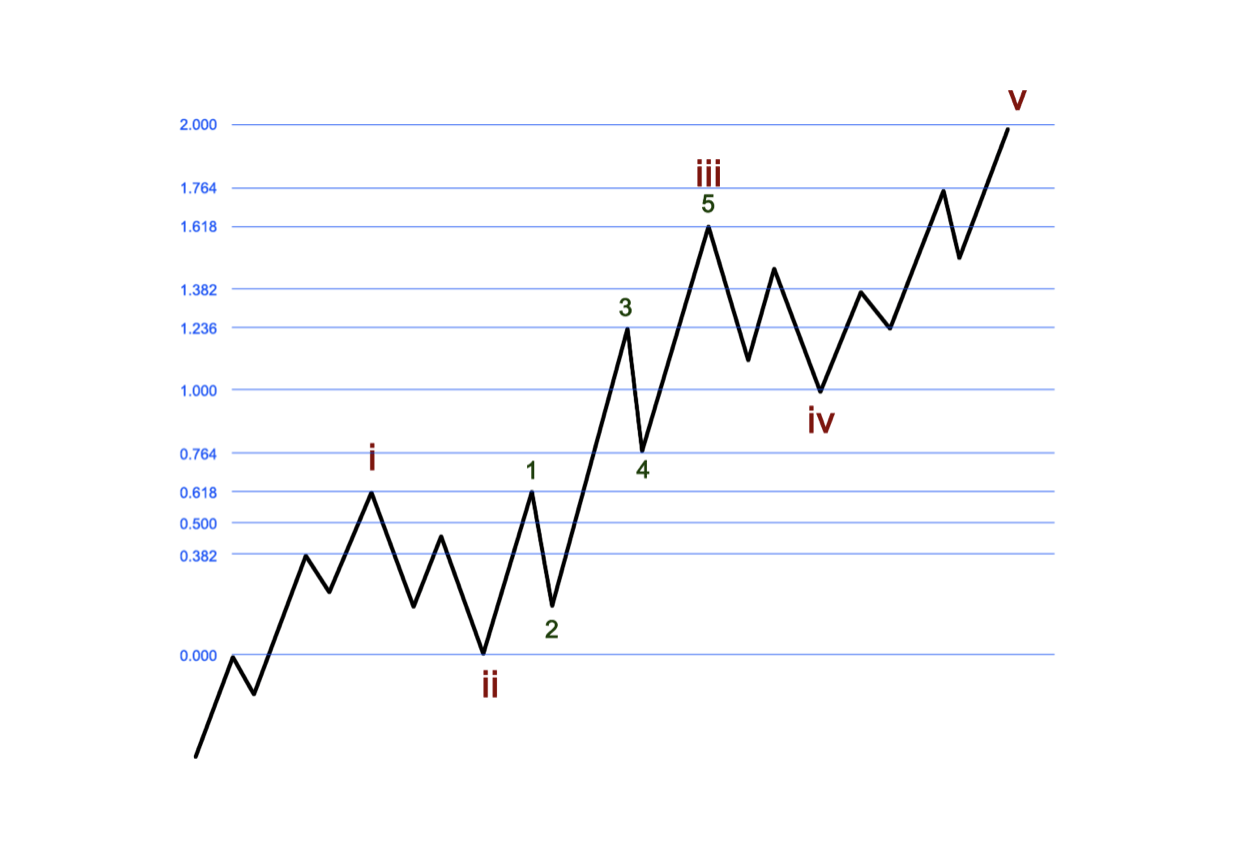
“While I was learning Elliott Wave on my own, I was trying to obtain a more ‘track-able’ and ‘tradable’ understanding of the fractal nature of the markets. This is probably what many struggle with the most. Specifically, it is when we say that within a 5 wave move, each impulsive wave breaks down further into 5 waves each, with some waves becoming extended.
Well, after much analysis and observation, I identified a standardized method to trade waves 3-5, once waves 1 and 2 were in place. Now, remember that this is a standardized method that is a most common phenomenon in the market, but markets can and do vary from this standardized presentation.”
The fractal nature of the market becomes readily evident when you see with your own eyes how structures repeat at all degrees. Simply stated, this means that the larger 5 wave structure will see each of the waves 1, 3 and 5 subdivide into 5 wave forms of their own. As well, inside our Fibonacci Pinball structure we are able to identify high-probability turning points and places to turn potentially more cautious or more aggressive.
Conclusion
Using Fibonacci Pinball, we are now able to track the likely turning points for Alcoa as this move progresses. This is a forward-looking method, not something that explains what just took place.
Yes, there are nuances to the analysis. Once familiar with our methodology, our members discover a powerful ally on their side to provide guidance and risk management in their trading/investing.
We have an extensive Education library available at Elliott Wave Trader. As well, we want to teach others this methodology. Three times a week we have beginner and intermediate level videos where we show the exact way we count the waves and give in-depth analysis techniques. This methodology, if you give it the chance, will change the way you invest forever. More on that can be found here .
There are many ways to analyze and track stocks and the market they form. Some are more consistent than others. For us, this method has proved the most reliable and keeps us on the right side of the trade much more often than not. Nothing is perfect in this world, but for those looking to open their eyes to a new universe of trading and investing, why not consider studying this further? It may just be one of the most illuminating projects you undertake.
(Housekeeping Matters)
If you would like notifications as to when our new articles are published, please hit the button at the bottom of the page to "Follow" us.
For further details see:
Alcoa: Highly Cyclical And Getting Ready To Run Again