ALX - Alexander's Inc.: The Needle Is Pointing Down
2023-08-02 08:00:00 ET
Summary
- Office REITs in urban areas with long commutes will likely continue to struggle due in large measure to the WFH trend.
- Alexander's Inc. owns 5 properties in the New York metropolitan area, including the world headquarters of Bloomberg.
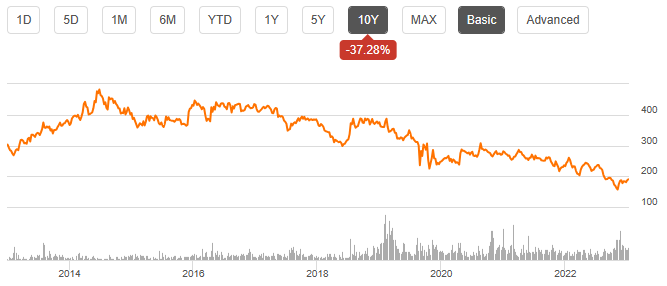
- Shares in ALX have been losing value for nearly 10 years and revenues are declining significantly.
- ALX is in imminent danger of a dividend cut in the face of declining revenues and heavy near-term debt maturities.
Office REITs remain beaten down, due to the WFH (work-from-home) trend, which is here to stay. Of the 18 REIT sectors, only Cell Towers, Cannabis, Self-Storage, and Farmland REITs have fared worse than the (-4.73)% total return posted by Office REITs YTD (year-to-date), while the average equity REIT has returned 3.27%. Meanwhile, the NASDAQ and the S&P indexes have raced ahead at double digits, and even the Dow has returned 6.98% thus far.
Hoya Capital Income Builder
There are a few bright spots in the Office REIT sector. While Hoya Capital believes Sunbelt office REITs have likely bottomed, however, urban markets with long commute times will probably continue to suffer.
Meet the company
Founded in 1928 and headquartered in Paramus, New Jersey, Alexander's, Inc. ( ALX ) was bought by Vornado ( VNO ) in 1995, and to this day is externally managed by VNO.
ALX owns just 5 properties, all in New York City, totaling 2.46 million square feet:
- 731 Lexington Avenue (which includes the world headquarters of Bloomberg),
- Rego Park I and II retail properties in Queens,
- The Alexander apartment tower, and
- a retail property in Flushing.
Although it owns office, retail, and multifamily properties, ALX is usually classified as an office REIT because the majority of its rental revenue comes from its Lexington Avenue property. The company does not provide specific numbers, breaking out the office segment from the retail and multifamily operations.
The occupancy rate on ALX residential properties stands at a healthy 97.1%, but on the commercial properties, including office and retail, occupancy is just 87.3%.
Tenant diversification for ALX is abysmal. Bloomberg alone accounts for 56% of ALX rental revenue, and an even larger share of its office income.
Quarterly results
For Q2 2023:
- Net income for the quarter ended June 30, 2023 was $64.1 million, compared to $14.8 million YoY (year over year). However, that total included $54.0 million from the sale of the Rego Park III land parcel. Net income exclusive of that sale was $14.1 million, a drop of (-4.7)% YoY.
- Funds from operations (“FFO”) came in at $18.2 million ($3.55 per share), down from $22.1 million YoY ($4.32 per share), a drop of (-17.6)%.
- Rental revenues of $53.7 million were up 7.8% YoY. About half this increase was in the form of real estate tax reimbursements.
- General and administrative expenses held essentially even, down (-0.5)%.
- Interest and debt expense soared to $13.2 million, up a whopping 141% YoY, primarily due to increases in LIBOR and SOFR rates on the company's variable-rate notes.
For H1 2023:
- Excluding the sale of the Rego Park III land parcel, net income was $21.4 million, compared to $29.3 million YoY, a drop of (-27.0)%.
- FFO registered $36.8 million ($7.18 per share), compared to $43.9 million ($8.57 per share) for H1 2022, a drop of (-16.2)%.
- Net cash from operations dropped (-29.4)% YoY, to $65.9 million.
- Net cash from investing showed a gain of $319 million, compared to a loss of (-$201) million in H1 2022. This gain was comprised of $264.9 million of proceeds from maturities of U.S. Treasury bills and $67.8 million of proceeds from sale of real estate, partially offset by the purchase of an interest rate cap of $11.26 million and construction and redevelopment investments of $2.9 million.
- Rental revenues of $106.6 million were up 7.6% YoY, mostly due to real estate tax reimbursements.
The company's quarterly 10-Q unfortunately provides no information on leasing activity or leasing spreads. The 10-Q also provides no guidance.
Growth metrics
Here are the 3-year growth figures for FFO (funds from operations), and TCFO (total cash from operations).
| Metric |
| 2019 |
| 2020 |
| 2021 |
| 2022 |
| 3-year CAGR |
| FFO (millions) |
| $99.7 |
| $82.5 |
| $89.8 |
| $87.1 |
| -- |
| FFO Growth % |
| -- |
| (-17.3) |
| 8.8 |
| (-3.0) |
| (-4.4)% |
| FFO per share |
| $19.47 |
| $16.11 |
| $17.52 |
| $16.99 |
| -- |
| FFO per share growth % |
| -- |
| (-17.3) |
| 8.8 |
| (-3.0) |
| (-4.4)% |
| TCFO (millions) |
| $126.1 |
| $78.1 |
| $118.5 |
| $102.5 |
| -- |
| TCFO Growth % |
| -- |
| (-38.1) |
| 51.7 |
| (-13.5) |
| (-6.7)% |
Source: TD Ameritrade, Hoya Capital Income Builder, and author calculations
The bounce-back in ALX revenues in 2021 paled in comparison to the REIT average that year, and overall, ALX revenues and cash flow have not yet recovered to 2019 levels. A further deterioration in revenues is likely.
Meanwhile, here is how the stock price has done over the past 3 twelve-month periods, compared to the REIT average as represented by the Vanguard Real Estate ETF ( VNQ ).
| Metric |
| 2020 |
| 2021 |
| 2022 |
| 2023 |
| 3-yr CAGR |
| ALX share price July 31 |
| $251.79 |
| $278.84 |
| $243.51 |
| $193.37 |
| -- |
| ALX share price Gain % |
| -- |
| 10.7 |
| (-12.7) |
| (-20.5) |
| (-8.4)% |
| VNQ share price July 31 |
| $81.39 |
| $106.29 |
| $98.96 |
| $85.26 |
| -- |
| VNQ share price Gain % |
| -- |
| 30.6 |
| (-6.9) |
| (-13.8) |
| 1.6% |
Source: MarketWatch.com and author calculations
ALX shares have lagged the VNQ in each of the past three 12-month periods. Investors who bought ALX shares July 31, 2020 have realized an average annual loss of (-8.4)%, compared to the VNQ's small gain of 1.5%.
Since bottoming May 26 at $156.92, shares in ALX have gained 23%. However, in the longer term, shares in ALX have been gradually losing value for nearly 10 years, shedding more than half their value since the peak in 2014. This company is in long-term decline.
Balance sheet metrics
Here are the key balance sheet metrics. In a sector characterized by ragged balance sheets, ALX stands out as even worse. The Debt/EBITDA ratio of 10.0 strongly suggests that the company may struggle to cover debts going forward, unless the revenue picture improves considerably.
| Company |
| Liquidity Ratio |
| Debt Ratio |
| Debt/EBITDA |
| Bond Rating |
| ALX |
| 1.23 |
| 54% |
| 10.0 |
| -- |
Source: Hoya Capital Income Builder, TD Ameritrade, and author calculations
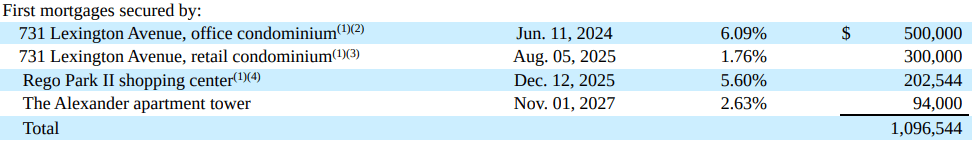
As of June 30, ALX was holding $533 million in cash and equivalents, against $1.096 billion in debt at a weighted interest rate of 4.52%. Payables outweigh receivables by more than 9 to 1. Almost half the debt ($500 million) is due in June of next year, and that debt carries the highest interest of all their notes. ALX recently bought an interest rate cap, so this particular loan is no longer subject to variable interest rates.
If ALX can successfully pay off that $500 million note next year, its weighted average interest rate will fall to just 3.2%. It currently has the cash to do so.
The company's balance sheet is not bond-rated, and parent company VNO has a tenuous bond rating of BBB-.
Dividend metrics
The quarterly dividend paid by ALX has not changed since January 1, 2018. It was never affected during the pandemic, and has remained unchanged since. As share price has eroded, the yield has climbed to a tempting 9.33%.
| Company |
| Div. Yield |
| 3-yr Div. Growth |
| Div. Score |
| Payout |
| Div. Safety |
| ALX |
| 9.33% |
| 0.0% |
| 9.33 |
| 110% |
| F |
Source: Hoya Capital Income Builder, TD Ameritrade, Seeking Alpha Premium
Dividend Score projects the Yield three years from now, on shares bought today, assuming the Dividend Growth rate remains unchanged.
However, this has been accomplished against a backdrop of falling FFO, resulting in a dangerous 110% payout ratio. Seeking Alpha Premium gives ALX an F for dividend safety, indicating imminent danger of a cut. This has all the earmarks of a classic yield trap.
Valuation metrics
Falling revenues and cash flow usually lead to very inexpensive stock valuations. Not in this case, however. The Price/FFO for ALX is almost double the Office REIT average, and very near the REIT average of 17.1.
| Company |
| Div. Score |
| Price/FFO '23 |
| Premium to NAV |
| ALX |
| 9.33 |
| 15.2 |
| (-3.5)% |
Source: Hoya Capital Income Builder, TD Ameritrade, and author calculations
Hoya Capital estimates NAV for ALX at $200 per share. Thus, the discount to NAV for this company is far smaller than the average REIT.
What could go wrong?
As mentioned above, ALX is externally managed by VNO. VNO management interests and incentives may not always align with ALX shareholders, and VNO recently suspended the dividend on their own REIT.
More than half of ALX rental revenues come from one tenant: Bloomberg. If Bloomberg chooses to downsize or office elsewhere, or suffers a significant downturn in their own business, this would have an outsize impact on ALX rental revenue.
ALX is significantly in debt, and much of the debt is secured by its most stable income-producing property. Nearly half the debt comes due next year. They currently have enough cash on hand to pay that note, so chances look good. However, if they are unable to meet their maturities, they may be forced to sell assets, dilute shares, or cut the dividend, especially in view of their extraordinarily high payout ratio.
The WFH (work from home) trend is hardest on office properties in cities with the longest commutes, and that includes New York. Office space in New York will continue to be comparatively hard to rent for some time to come, which weighs heavily against ALX growth prospects.
Investors' bottom line
Alexander's Inc. could be in imminent danger of a dividend cut, which probably would be swiftly followed by a significant drop in the share price. The 9.33% yield appears to be a mousetrap. The ragged balance sheet will not withstand the substantial drop in revenues and cash flow expected in the next two years. Thanks in large part to timely investing activity (treasury bills), the company has a good chance of meeting its debt maturity a year from now. If so, the debt situation will ease considerably. However, in the meantime, revenues keep falling. I rate this company a definite Sell for the longer term (2 - 5 years).
Brave investors may come out ahead by holding in the shorter term, but I believe this company will be a much better investment a year from now than it is today. Meanwhile, there are much better choices, even in Office REITs.
Seeking Alpha Premium
The only Wall Street analyst covering this declining firm has a Sell rating currently, with a price target of $140, implying 28% downside.
The Street, Ford Equity Research, and TipRanks recommend a Hold, as does revisions-sensitive Zacks, while the Seeking Alpha Quant ratings system calls for a Strong Sell.
As always, however, the opinion that matters most is yours.
For further details see:
Alexander's, Inc.: The Needle Is Pointing Down