SWK - Allegion: Successful Acquisition And Lower Multiple Upgrade To Buy
2023-10-15 03:09:51 ET
Summary
- Allegion plc is a provider of electronic and mechanical access control for both business and non-business customers.
- The company recently completed the acquisition of Stanley Access Technologies, a leading manufacturer and installer of automatic doors in North America.
- Allegion's financial results have been positively impacted by the acquisition, with impressive revenue and operating income growth.
Investment Thesis
Allegion plc ( ALLE ) is in the business of providing electronic and mechanical access control for both business and non-business customers. I previously published articles, " Allegion: Excessively High Multiple Remains A Concern ", on Jul. 29, 2021, and, " Allegion: Decline In Multiple Makes For Possible Buy ", on Feb. 23, 2022, both with a Hold rating. Since the Feb. 2022 article, SA premium statistics show the share price has declined by 5.55% and total return is negative 2.86%. Subsequent to the abovementioned articles, the company completed acquisition of Stanley Black & Decker's ( SWK ), Stanley Access Technologies, on Jul. 5, 2022, in an all cash transaction for $900 million. From the media release at the time.
Access Technologies is a leading manufacturer, installer and service provider of automatic doors in North America, primarily in the United States and Canada. Its diversified customer base centers on non-residential settings, including retail, healthcare, education, commercial offices, hospitality and government. Access Technologies generated approximately $340 million in net sales in 2021.
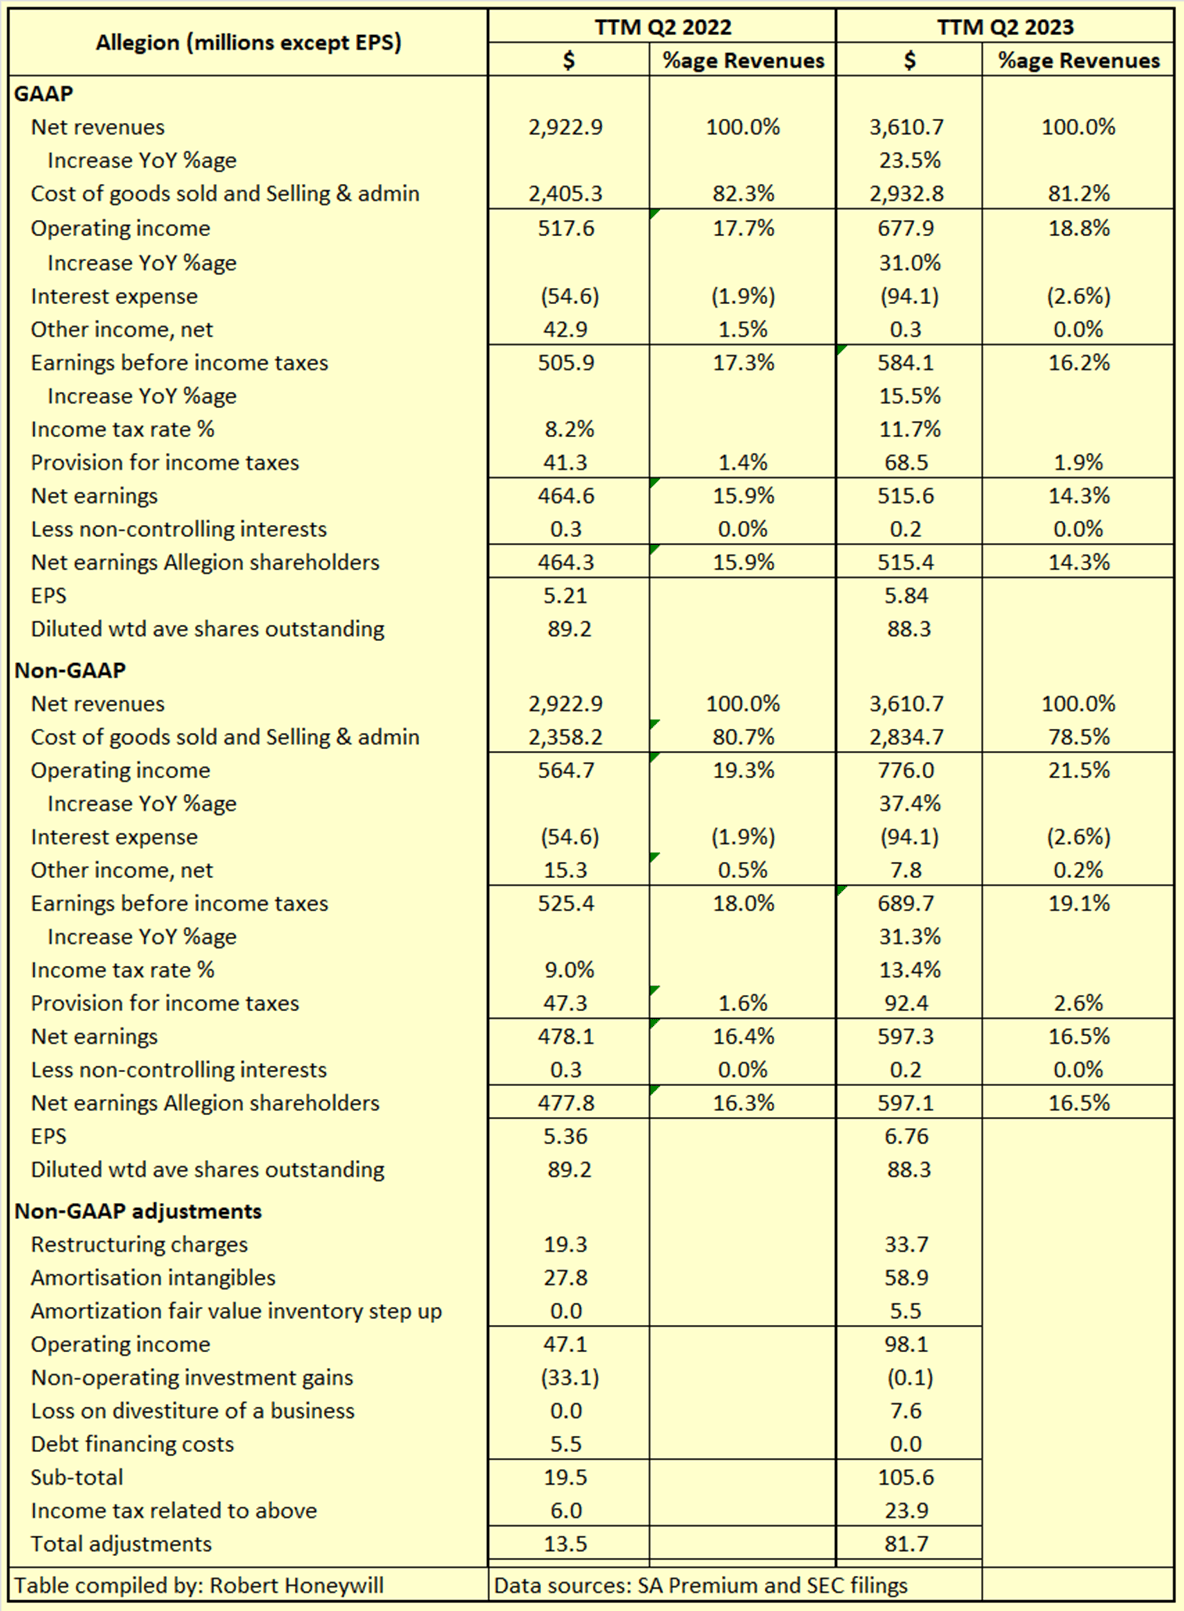
Time to take another look at Allegion's multiple and how results have been impacted by the acquisition. Table A below compares Allegion's results for TTM Q2 2023, with a full year of the Stanley business included, to TTM Q2 2022, which predates the acquisition.
Table A
Revenue and Operating Income growth -
Table A shows the results for TTM Q2 2023 are impressive, with sales up ~$688 million (23.5%) on TTM Q2 2022. The increase is obviously not just from the additional Stanley sales, which were $340 million in 2021. The company has indicated the Stanley addition plus price increases and organic growth all contributed to revenue growth. The growth in operating margin as a percentage of revenue supports the price increases narrative.
Non-GAAP Results restated -
Allegion also restated past non-GAAP results for calendar 2021 and 2022 to exclude amortization of acquisition related intangibles, and this restatement is reflected in the non-GAAP results in Table A above. The change was made due to the increased materiality of the amortization amounts resulting from the Stanley acquisition. My view is intangibles amortization is a valid add back for determining non-GAAP results. I have a jaundiced view of add backs of restructuring costs as some companies seem to be in a permanent process of restructure and such costs are then no longer of an unusual and non-recurring nature. That does not appear to be the case for Allegion with over half the restructuring costs for TTM Q2 2023 occurring in Q3 2022, and then declining in subsequent quarters through Q2 2023.
Allegion's P/E Ratio -
At the time of my Feb. 22, 2022 article, "Allegion: Decline In Multiple Makes For Possible Buy", Allegion multiple on a non-GAAP EPS basis was 21.02, which would reduce to 20.36 if restated for the intangibles amortization adjustment. Based on TTM Q2 2023 non-GAAP EPS of $6.76 per Table A, and current share price of $103.48, Allegion's current multiple has reduced to 15.30.
Allegion's Debt net of Cash -
At June 30, 2022, immediately prior to the Stanley transaction for $900 million cash, Allegion had net debt of $1,111.1 million, comprised of cash and cash equivalents of $919.6 million and borrowings of $2,030.7 million. At September 30, 2022 net debt had increased by $833.8 million to $1,944.9 million, reflecting the impact of the Stanley transaction. By end of Q2, 2023, Allegion had reduced that $1,944.9 million net debt by $208.2 million to $1,736.7 million.
Summary and Conclusions -
The Stanley acquisition, price increases, and organic growth, make Allegion a more attractive business than when I last wrote about it. My concerns about the multiple are lessened as the multiple the stock is now attracting is much lower. Based on SA analysts' EPS estimates, double digit returns are possible, buying now and holding through end of 2025. Allegion stock is upgraded from Hold to Buy. A more detailed financial analysis follows.
Financial Analysis and Comment
Looking for market mispricing of stocks -
What I'm primarily looking for here are instances of market mispricing of stocks due to distortions to many of the usual statistics used for screening stocks for buy/hold/sell decisions. I believe the answer is to compare projections, based on analysts' estimates out to the end of 2024 or later, to past performance. Summarized in Tables 1 and 2 below are the results of compiling and analyzing the data on this basis.
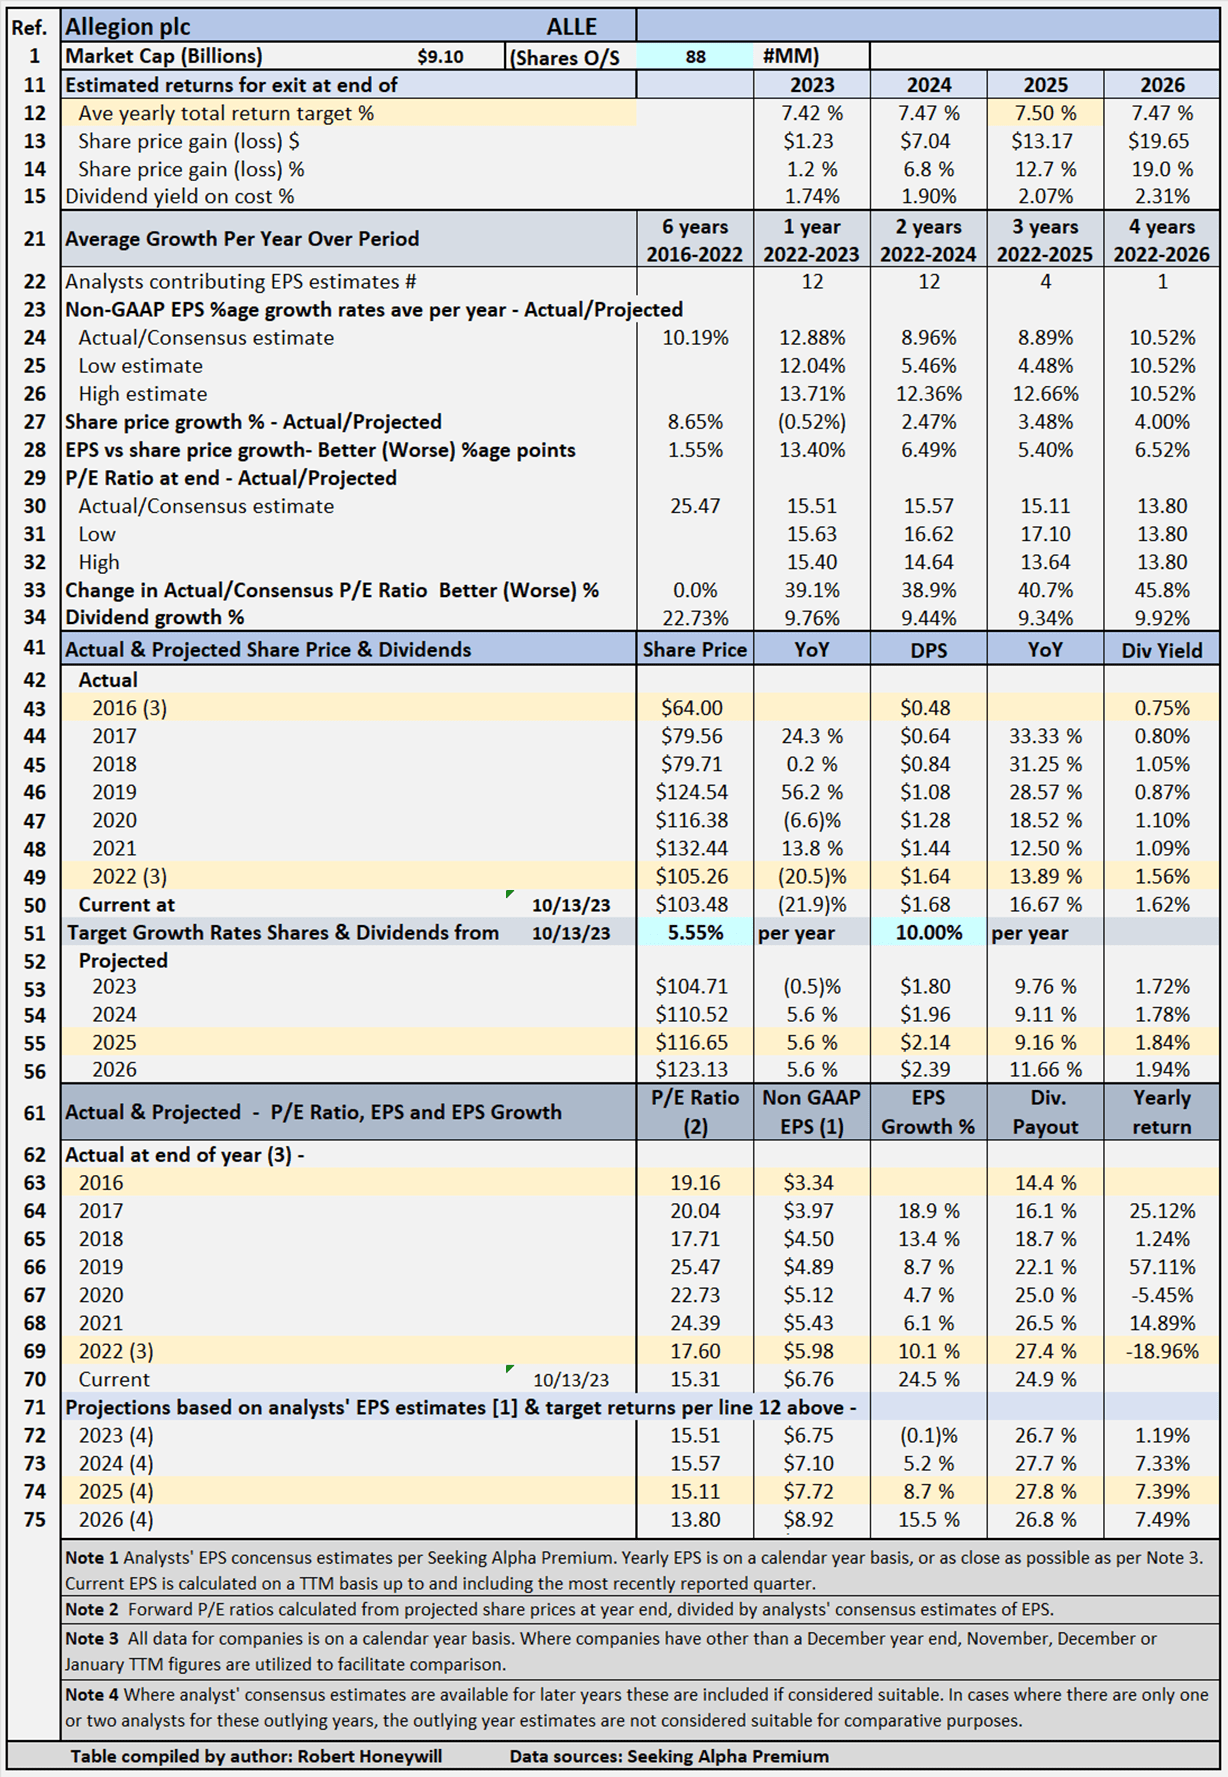
Table 1 - Detailed Financial History And Projections
Table 1 documents historical data from 2016 to 2022, including share prices, P/E ratios, EPS and DPS, and EPS and DPS growth rates. The table shows EPS grew at an average rate of 10.19% per year, between 2016 and 2022, while the share price grew at a lesser rate of 8.65% per year over the same period. The table also includes estimates out to 2026 for share prices, P/E ratios, EPS and DPS, and EPS and DPS growth rates. (Note - while estimates are shown for analysts' EPS estimates out to 2023 to 2026 where available, estimates do tend to become less reliable, the further out the estimates go. These estimates are only considered sufficiently reliable if there are at least three analysts' contributing estimates for the year in question). Based on analysts' consensus EPS estimates, EPS is projected to continue to grow at low to mid single-digit percentages through end of 2025. Table 1 allows modeling for target total rates of return. In the case shown above, the target set for total rate of return is 7.5% per year through the end of 2025 (see line 12), based on buying at the Oct. 13, 2023, closing share price level. As noted above, estimates become less reliable in the later years. I decided to input a target return based on the 2025 year, which has EPS estimates from four analysts because it allows for the impact of the projected EPS growth rates to be taken into account in the assessment of the value of Allegion shares. The table shows to achieve the 7.5% return, the required average yearly share price growth rate from Oct 13, 2023 through Dec. 31, 2025, is 5.55% (line 51). Dividends and dividend growth account for the balance of the target 7.5% total return.
Allegion's Projected Returns Based On Selected Historical P/E Ratios Through End Of 2025
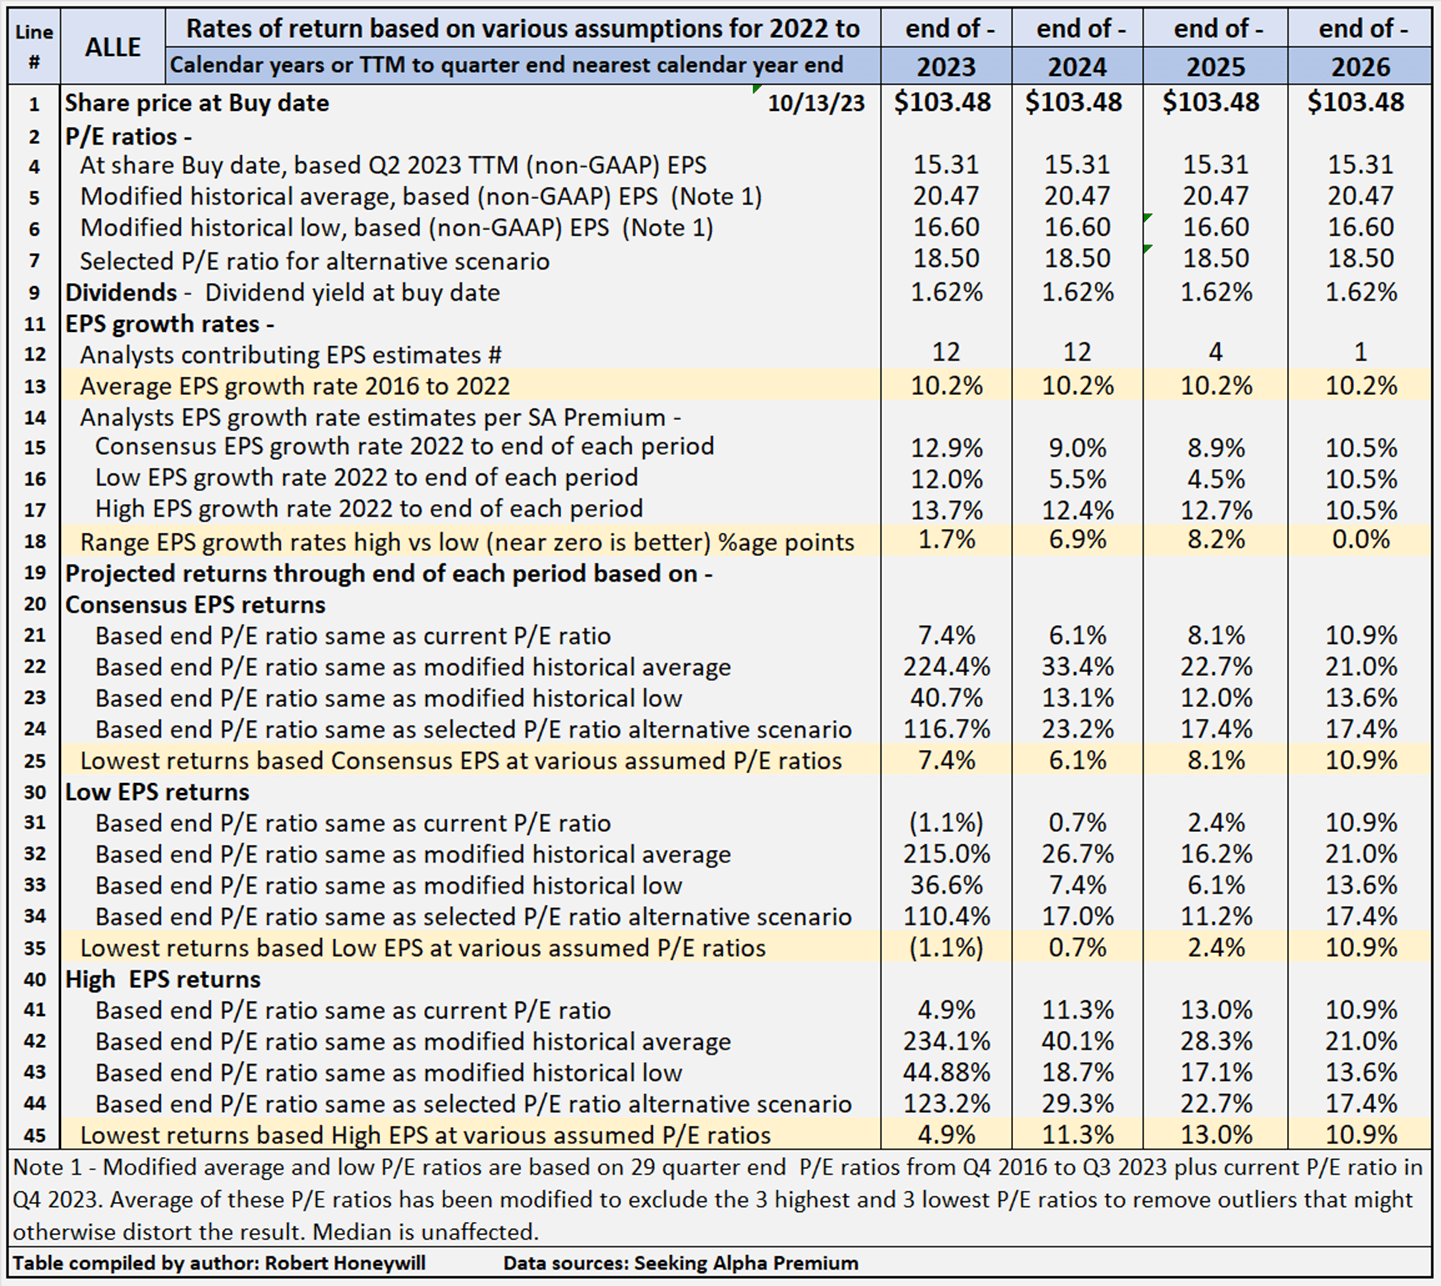
Table 2 below provides scenarios projecting potential returns based on select historical P/E ratios and analysts' consensus, low, and high EPS estimates per Seeking Alpha Premium through the end of 2025.
Table 2 - Summary of relevant projections Allegion
Table 2 provides comparative data for buying at closing share price on Oct. 13, 2023, and holding through the end of years 2023 through 2026. There's a total of twelve valuation scenarios for each year, comprised of three EPS estimates (SA Premium analysts' consensus, low and high) across three different P/E ratio estimates, based on historical data, plus a fourth P/E ratio selected to provide an alternative scenario. Allegion's P/E ratio is presently 15.31, which is below the historical average P/E ratio of 20.47. Table 2 shows potential returns from an investment in shares of the company across the range of P/E ratios This analysis, from hereon, assumes an investor buying Allegion shares today would be prepared to hold through 2025, if necessary, to achieve their return objectives. Comments on contents of Table 2, for the period to 2025 column follow.
Consensus, low and high EPS estimates
All EPS estimates are based on analysts' consensus, low and high estimates per SA Premium. This is designed to provide a range of valuation estimates - from low to most likely to high - based on analysts' assessments. I could generate my own estimates, but these would likely fall within the same range and would not add to the value of the exercise. This is particularly so in respect of well-established businesses such as Allegion. I believe the "low" estimates should be considered important. It's prudent to manage risk by knowing the potential worst-case scenarios from whatever cause.
Alternative P/E ratios utilized in scenarios
- The actual P/E ratios at the share buy date are based on actual non-GAAP EPS for Q2-2023 TTM.
- A modified average P/E ratio based on 29 quarter-end P/E ratios from Q4 2016 to Q3 2023 and current P/E ratio in Q4 2023. The Q3 and Q4 2023 P/E ratios are based on share price at the end of Q3 2023 and the current share price in Q4 divided by TTM EPS for latest reported earnings through end of Q2 2023. The average of these P/E ratios has been modified to exclude the three highest and three lowest to remove outliers that might otherwise distort the result.
- A modified low P/E ratio was calculated using the same data set used for calculating the modified average P/E ratio, and calculated on a similar basis, with the three highest and lowest P/E ratios excluded.
- A median P/E ratio is calculated using the same data set used for calculating the modified average P/E ratio. Of course, the median is the same whether or not the three highest and lowest P/E ratios are excluded. In the case of Allegion, I have chosen to use an assumed P/E ratio of 18.50 in place of the historical median of 20.63 (similar to the average). I have done this to provide an idea of the impact on returns of the multiple increasing to around halfway between the present level and the historical average.
Reliability of EPS estimates (line 18)
Line 18 shows the range between high and low EPS estimates. The wider the range, the greater disagreement there is between the most optimistic and the most pessimistic analysts, which tends to suggest greater uncertainty in the estimates. There are four analysts covering Allegion through the end of 2025. In my experience, a range of 8.2 percentage points difference in EPS growth estimates among analysts is on the high side and suggests a degree of uncertainty, and thus decreased reliability.
Projected Returns (lines 19 to 45)
Lines 25, 35, and 45 show at a range of historical P/E ratio levels, Allegion is conservatively indicated to return between 2.4% and 13.0% average per year through the end of 2025. The 2.4% return is based on analysts' low EPS estimates and the 13.0% on their high EPS estimates, with an 8.1% return based on consensus estimates. Those are the lowest of the returns under the consensus, low, and high EPS scenarios and assume a P/E multiple at Allegion's current multiple of 15.31. As described above, in determining modified historical multiples, the three highest and lowest multiples are excluded. On that basis the current multiple has been excluded in determining the historical low multiple of 16.60. If the multiple were to increase back to 16.60 by 2025, indicative returns range from 6.1% to 17.1%, with consensus 12.0%. At Allegion's historical average P/E multiple of 20.47, the indicative returns range from 16.2% to 28.3%, with consensus of 22.7%.
Checking Allegion's "Equity Bucket"
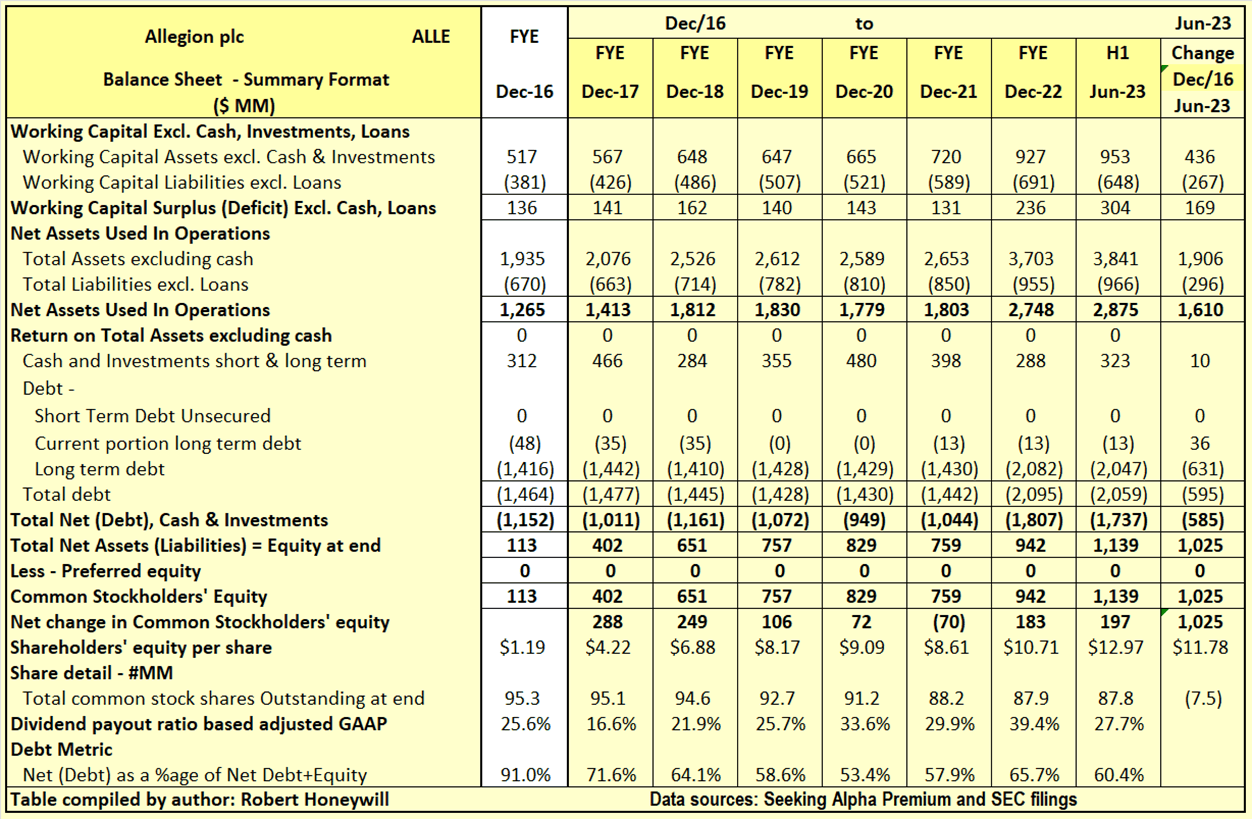
Table 3.1 Allegion Balance Sheet - Summary Format
Over the 6.5 years end of 2016 to the end of Q2 2023, Allegion's shareholders' equity increased by $1,025 million. This $1,025 million increase, plus an increase of $585 million in debt net of cash was used to fund an increase of $1,610 million in Net Assets Used In Operations. Net debt as a percentage of net debt plus equity decreased from 91.0% at end of 2016 to 60.4% at end of Q2 2023. Outstanding shares decreased by 7.5 million from 95.3 million to 87.8 million, over the period, due to share repurchases partially offset by shares issued for stock compensation. The $1,025 million increase in shareholders' equity over the last 6.5 years is analyzed in Table 3.2 below.
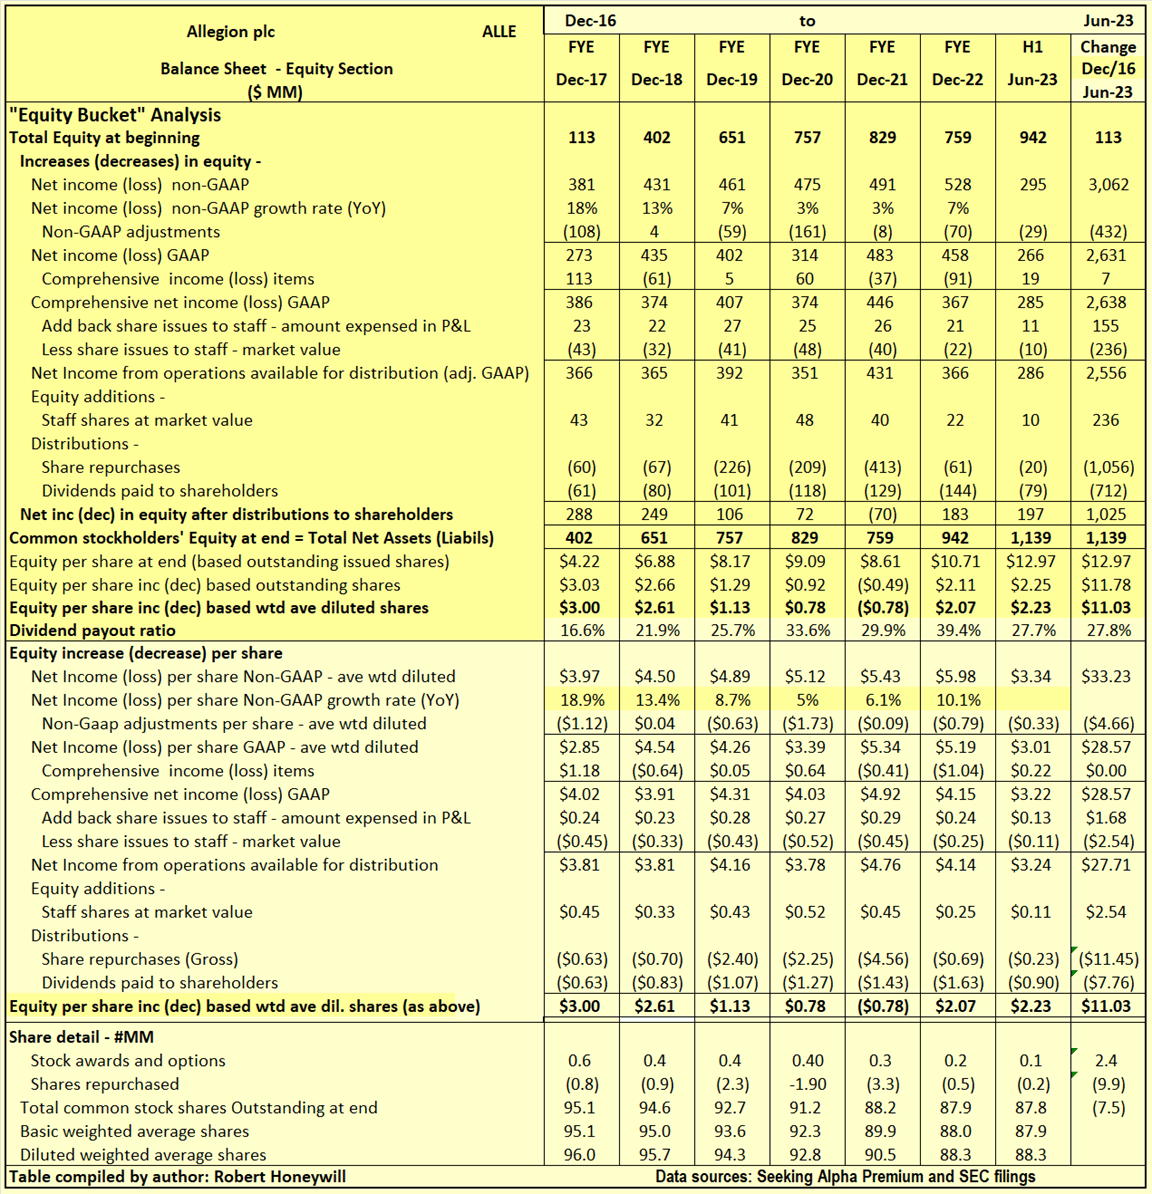
Table 3.2 Allegion Balance Sheet - Equity Section
I often find companies report earnings that should flow into and increase shareholders' equity. But often the increase in shareholders' equity does not materialize. Also, there can be distributions out of equity that do not benefit shareholders. Hence, the term "leaky equity bucket." I look for evidence of this in my analysis of changes in shareholders' equity.
Explanatory comments on Table 3.2 for the period end FY-2016 to end Q2-2023.
- Reported net income (non-GAAP) over the 6.5 year period totals to $3,062 million, equivalent to diluted net income per share of $33.23.
- Over the 6.5 year period, the non-GAAP net income excludes 432 million ($4.66 EPS effect) of items regarded as unusual or of a non-recurring nature in order to better show the underlying profitability of Allegion. These items are primarily impairment charges for goodwill, amortization of intangibles, and restructuring charges.
- Other comprehensive income includes such things as foreign exchange translation adjustments in respect to buildings, plant, and other facilities located overseas and changes in valuation of assets in the pension fund - these are not passed through net income as they fluctuate without affecting operations and can easily reverse in a following period. Nevertheless, they do impact the value of shareholders' equity at any point in time. For Allegion, these items were positive, increasing equity by $7 million over the 6.5 year period.
- There were share issues to employees, and these were a significant expense item. The amounts recorded in the income statement and in shareholders' equity, for equity awards to staff totaled $155 million ($1.68 EPS effect) over the 6.5 year period. However, the market value of these shares is estimated to be $236 million ($2.54 EPS effect). The understatement of expense by $81 million is not material in the context of non-GAAP earnings total of $3,014 million over the 6.5 year period, and not sufficient to be overly concerning from a "leaky equity bucket" aspect.
- By the time we take the above mentioned items into account, we find, over the 6.5 year period, the reported non-GAAP EPS of $33.23 ($3,062 million) has decreased to $27.71 ($2,556 million), added to funds from operations available for distribution to shareholders.
- Dividends of $712 million and share repurchases of $1,056 million were adequately covered by the $2,556 million generated from operations, leaving a $788 million increase in equity. This $788 million from operations, and estimated $236 million value of shares issued to staff, increased shareholders' funds by $1,025 million per Table 3.1 above.
Summary and Conclusions
Allegion has bedded in its acquisition of the Stanley Access Technologies business, the stock is trading around historical low multiples, and debt levels are being progressively reduced. The stock is upgraded from Hold to Buy.
For further details see:
Allegion: Successful Acquisition And Lower Multiple, Upgrade To Buy