KCE - AllianceBernstein: Improving Asset Flow Trends Technicals Turning Less Bearish
2023-03-13 11:56:48 ET
Summary
- Financials sector stocks were hammered last week amid carnage in the regional banking industry.
- AllianceBernstein reported a strong Q4 with better February flow data.
- The company's dividend yield is now 8% and seen as rising.
- Technicals have improved from late last year, and I highlight price levels to watch.
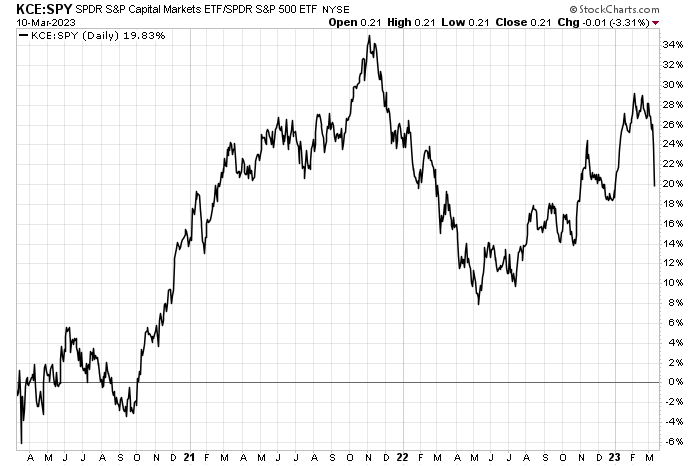
The regional bank drubbing amid the SVB Financial Group (SIVB) failure sent ripples across the market and bearish waves across the Financials sector. Capital Markets stocks were sold off hard last week. The SPDR S&P Capital Markets ETF (KCE) sharply underperformed the broad market. But I don’t see much negative impact on AllianceBernstein (AB), a diversified asset manager and capital markets name, but I continue to have it as a hold based on valuation and a neutral chart. A further dip in the share price and/or continued improvement in fund flow data would warrant a buy recommendation. I also assert that technical buying momentum could come should AB's share price rise above $52.
Capital Markets Stocks Shellacked
According to Bank of America Global Research, AllianceBernstein is a financial services firm with a large asset management business in addition to a captive private wealth platform and a sellside research business. AB is controlled by Equitable Holdings and is organized as a publicly traded partnership.
The Tennessee-based $4.2 billion market cap Capital Markets industry company within the Financials sector trades at a low 13.6 trailing 12-month GAAP price-to-earnings ratio and pays a high 8.0% dividend yield, according to The Wall Street Journal.
Back in February, AB reported a strong earnings beat with $0.70 of operating per share profits though revenue dropped more than 21% YoY. Full-year assets under management fell by 6% as both the equity and fixed income markets struggled. Last week, we received a February update on the asset manager’s latest AUM figure , and it fell 2.2% sequentially after a strong January.
Under the hood, however, I noticed that the firm reported net inflows, so that’s a positive sign. What’s more, Credit Suisse raised its outlook on AB to Outperform following the strong Q4 report. Overall, I am encouraged by some signs in the broad market along with the latest flow data. Now we just need the valuation and technicals to inflect to the good.
AB: Dividend Yield History
YCharts
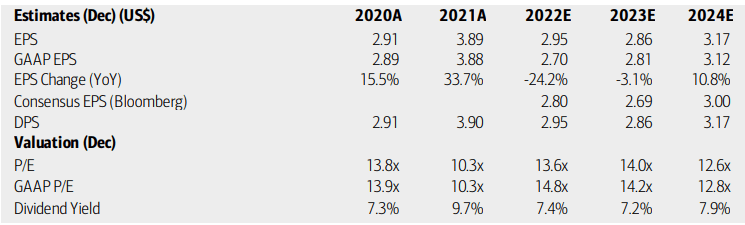
On valuation , analysts at BofA see earnings falling just 3% this year after a big 2022 fall. That is positive in my eye because both BofA’s and the Bloomberg consensus forecasts have improved for 2023 and ‘24 EPS.
This comes as the stock price has drifted lower, so the valuation situation is better in my opinion. Dividends, meanwhile, are expected to be better than what had been seen a few months ago, leading to a higher yield. Shares still trade near their 5-year average forward non-GAAP P/E while the trailing price-to-book ratio is at a 10% discount to the long-term average.
Overall, the valuation still looks neutral to me.
AllianceBernstein: Earnings, Valuation, Dividend Yield Forecasts
AB: Not Cheap Enough Yet
Seeking Alpha
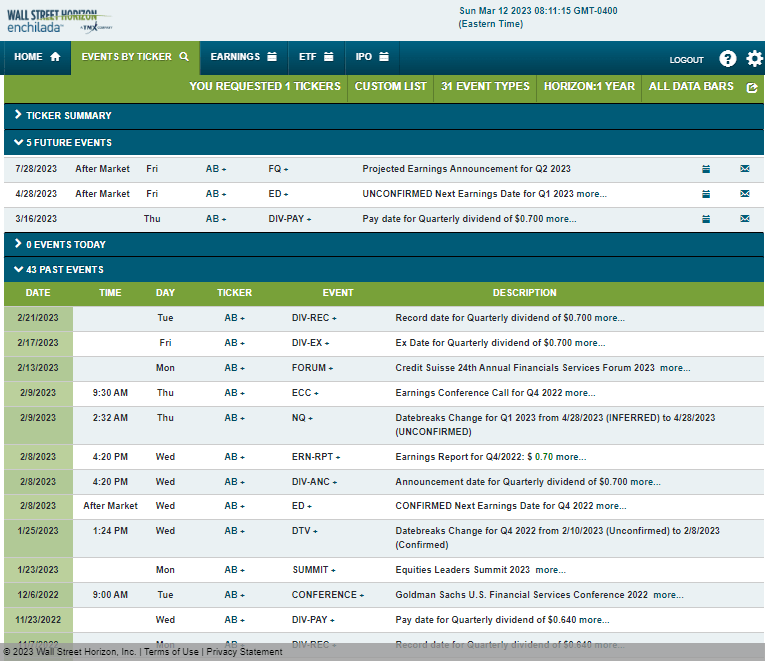
Looking ahead, corporate event data provided by Wall Street Horizon show an unconfirmed Q1 2023 earnings date of Friday, April 28 AMC. A dividend pay date hits on Thursday, March 16. The risk calendar is light on volatility catalysts aside from the reporting date.
Corporate Event Risk Calendar
The Technical Take
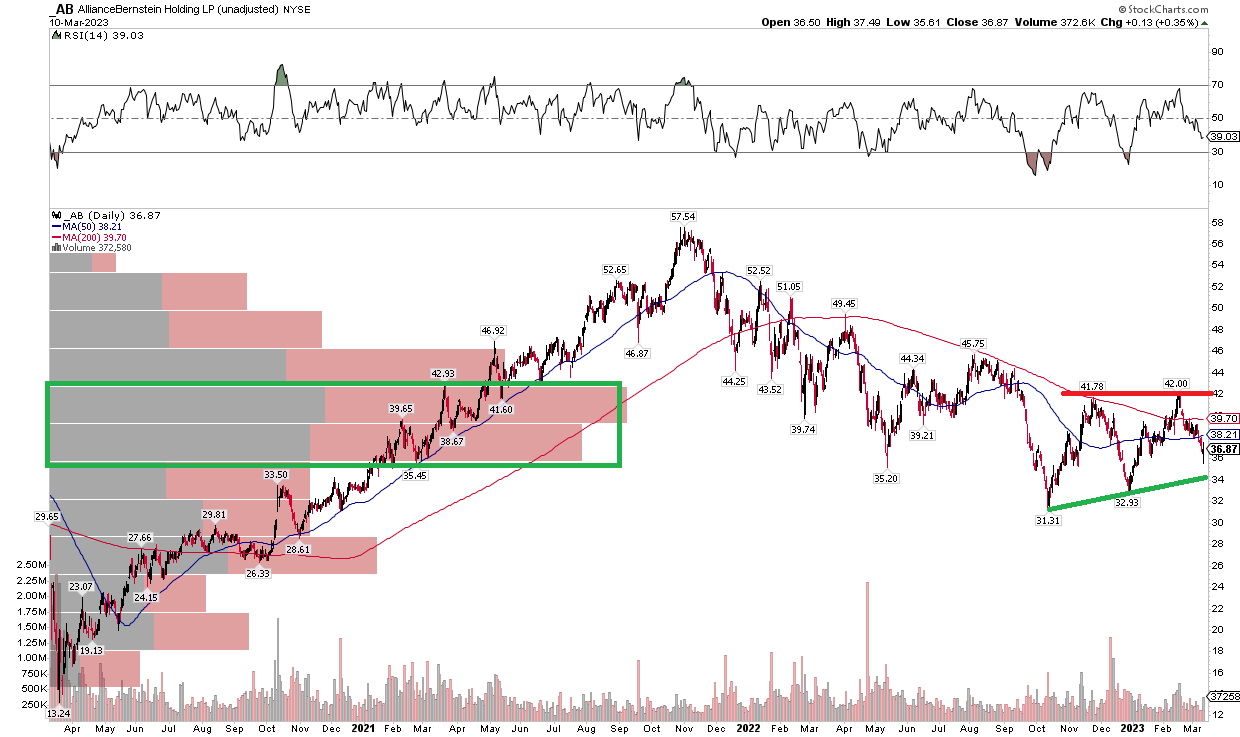
With improving fundamentals but a valuation that is not quite ideal, the chart shows some improvement from my last look at AB . Notice in the graph below that shares made an attempt at climbing above noted resistance caused by the 200-day moving average but failed in February. The upside here is that the stock put in a higher low at the turn of the year relative to the October low. We now have a bogey to watch: $42.
If AB can rise above the 200-day along with $42, then an uptrend could be in the works. What’s more, the $31 to $33 area could be a reasonable place to put a stop below from a long position.
Overall, the chart appears better in my view, and going long here with a stop under $31 is not a bad risk/reward play.
AB: Shares Briefly Above the 200DMA, Higher Low Versus October
The Bottom Line
I like the trend in fundamentals with AB while the valuation is still lackluster. With a high sustainable yield and improving chart, AB stock is setting up to be a buy soon, but we are not quite there yet. I assert that if we see improved investment flow trends in the coming months as well as further earnings beats, then the fundamental will warrant a buy. Also, a stock price in the low $30s would auger a buy recommendation on current valuations. Finally, a momentum breakout above $42 could trigger technical buying in the stock.
For further details see:
AllianceBernstein: Improving Asset Flow Trends, Technicals Turning Less Bearish