ALSN - Allison Transmission Holdings: A Long-Term Buy For Aggressive Investors
2023-10-19 02:15:08 ET
Summary
- Allison Transmission Holdings has shown impressive growth in key financial metrics, particularly in its North America On-Highway and Service Parts segments.
- ALSN's optimistic financial forecasts are driven by increased customer demand and strategic price increases on certain products.
- Despite some areas of concern, such as increasing current liabilities and high debt, the company's shareholder yield of 6.91% demonstrates its commitment to returning value to investors.
Investment Thesis
Allison Transmission Holdings ( ALSN ) has shown impressive growth in key financial metrics, particularly in its North America On-Highway and Service Parts segments, which constitute 74% of its total net sales. While operational costs are increasing, the quality of earnings remains solid, based primarily on core operations rather than one-off events.
Several factors drive the optimistic financial forecasts for the quarter ending in September 2023. One of the catalysts is the surge in customer demand, especially in key segments like Global OnHighway and Service Parts. This heightened demand is not just a transient phenomenon but is reflected in the analysts' median revenue forecast of $764 million, substantiating the company's robust sales pipeline. Another contributor to the expected strong revenue numbers is the company's strategic decision to increase prices on certain products. These growth catalysts collectively offer a compelling case for the company's promising financial outlook for the upcoming quarter.
Despite some areas of concern, like increasing current liabilities and high debt, the shareholder yield of 6.91% demonstrates the company's commitment to returning value to its investors. Given all these factors and an implied stock price suggesting a potential upside of up to 31.1%, Allison Transmission Holdings is a strong buy, particularly for long-term, aggressive investors.
Overview
Founded in 1915 and headquartered in Indianapolis, Allison Transmission Holdings, Inc. specializes in vehicle propulsion systems, including automatic transmissions and electric systems. The company has a strong presence in North America, with 74% of its 2022 revenue coming from this region. However, its global reach extends through a network of around 1,600 independent distributors and dealers worldwide. Financially, the company is on solid ground; its net sales for Q2 2023 stood at $783 million, backed by a strong EPS of $1.92. Several growth catalysts fuel these numbers. One of these is the increase in customer demand, particularly in the Global OnHighway and Service Parts sectors. Another contributor to the revenue is the strategic price increase on certain products, a decision that has significantly enhanced net sales.
Despite the North American region being its primary market, Allison Transmission is making strides in global expansion. The company isn't just eyeing international markets; it's already securing tangible contracts, such as the $13 million contract with the U.S. Army. This new defense project alone is expected to bring in $100 million in incremental annual revenue. Also, in a strategic move to diversify and tap into emerging markets, the company is investing heavily in electric and hybrid propulsion systems.
While the industry is subject to macroeconomic conditions and supply chain limitations, Allison Transmission is showing remarkable resilience. Particularly in North America, its various end markets like defense and service parts are experiencing robust growth. This resilience is also evident in the company's financial health. There's been a year-over-year net sales increase of 18% to $783 million in Q2 2023, with a record first-half revenue of over $1.5 billion. Additionally, the EPS has grown by an impressive 52% year-over-year. This indicates not only the company's profitability but also its promise for long-term investment.
As for risks, while the shift towards electric vehicles is a long-term industry trend that could potentially impact sales, the company is already preparing for this through its investments in electric and hybrid propulsion systems. Supply chain disruptions, as evidenced in 2023, pose a risk, but the company's financial agility allows it to navigate these challenges effectively.
In terms of financial prudence, the company's gross margin increased by 190 basis points year-over-year. It has also returned capital to shareholders through dividends of $0.23 per share and repurchasing over 2% of its outstanding shares. This strong operating performance implicitly points to effective management. Additionally, in a broader industry context, the stock's performance is noteworthy. It's up more than 43% year-to-date, ranking 6th out of 49 publicly traded auto parts stocks.
In conclusion, Allison Transmission Holdings, Inc. appears well-positioned for both immediate and long-term growth.
Revenue Analysis
Segment Analysis
When we analyse the income statement, the North America On-Highway segment generated $397 million in Q2 2023, up from $340 million in Q2 2022-an impressive 17% year-over-year increase. This is a strong indicator of sustained demand, especially considering that this segment alone contributes to more than half of the company's total net sales. The North America Off-Highway sector saw a 25% growth, going from $20 million to $25 million between Q2 2022 and Q2 2023. Even though the absolute numbers are smaller compared to the On-Highway segment, the percentage growth is higher, suggesting that this market is emerging and could be ripe for further exploration.
The defense segment posted a 14% growth in sales, from $29 million to $33 million. It might not be a massive contributor, but it adds a steady flow of revenue to the overall portfolio. This steadiness is further reinforced by a new $13 million contract with the U.S. Army, indicating not just present revenue but future growth.
Outside North America, the On-Highway segment saw a 17% boost in sales, from $105 million to $123 million. This signals that the company is making inroads into international markets, a healthy sign for diversification. However, the Outside North America Off-Highway segment experienced a 25% dip in sales, moving from $32 million down to $24 million. This decline calls for scrutiny as it could point to underlying issues related to demand or competition in these international markets.
The Service Parts, Support Equipment, and Other segment grew by 31% from $138 million to $181 million. Given this rapid ascent, it's an area worth injecting more investment into for future growth.
The North America On-Highway and Service Parts segments make up about 74% of total net sales, making them crucial for the company's overall financial well-being. In contrast, outside North America, despite the Off-Highway segment's slump, the On-Highway segment has shown 17% growth, which suggests a positive performance.
When it comes to penetrating the market, the company has a vast network of approximately 1,600 distributors worldwide. Given that 74% of the company's business is concentrated in North America and considering the healthy growth rates in that region, it's safe to deduce that their market penetration strategy is effective there. Conversely, for international markets, especially the lagging Outside North America Off-Highway segment, there's likely a need for a renewed focus and investment to improve penetration.
Historical Analysis
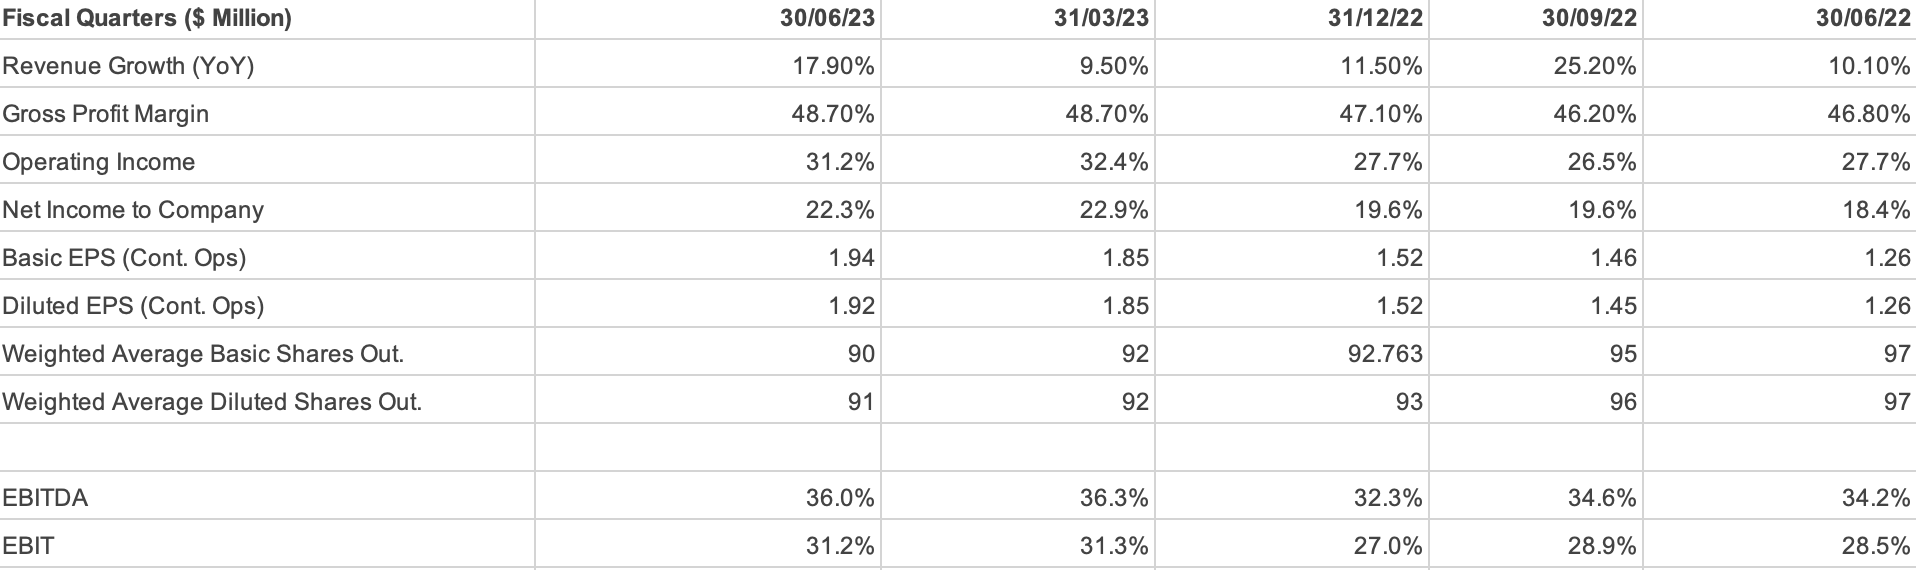
First, we look at the Net Sales, which grew by 17.92% quarter-over-quarter from $664 million to $783 million. Even on a half-yearly scale, the sales increased by 13.65%, going from $1,341 million to $1,524 million. This increase in sales, especially the faster pace in the recent quarter, suggests that the company is gaining momentum.
Moving on to the Cost of Sales, the numbers increased by 13.88% quarter-over-quarter, from $353 million to $402 million, and on a half-yearly basis, it went up by 10.14% from $710 million to $782 million. Although the costs are rising, they're doing so at a slower rate compared to the sales. This is a good sign because it means that the profit margins are likely to expand.
In terms of Gross Profit, the company recorded a quarter-over-quarter growth of 22.51%, increasing from $311 million to $381 million. On a half-yearly comparison, the growth rate stands at 17.59%, moving from $631 million to $742 million. This suggests that the company is making more money and doing so more efficiently, as indicated by the faster growth in Gross Profit compared to both sales and costs.
The Operating Income saw a substantial increase of 29.41% quarter-over-quarter, moving from $187 million to $242 million. Even on a half-yearly basis, it grew by 21.34%, from $389 million to $472 million. This suggests that the company's operational efficiencies could be improving, thus making the business more profitable.
For Net Income, the growth is even more significant. On a quarter-over-quarter basis, it grew by 43.44%, from $122 million to $175 million, and on a half-yearly scale, it went from $251 million to $345 million, marking a 37.45% growth. This dramatic increase indicates that the company is not just generating higher revenues and managing costs, but it's also retaining a larger portion of its earnings, which is excellent news for investors.
Key Operating Metrics
The Net Profit Margin for Q2 2023 is 22.35%, and the Operating Margin stands even higher at 30.91%. Both these ratios underscore the company's ability to generate profits efficiently.
The company's Selling, General and administrative expenses are rising. This trend could be a potential weakness, as increasing operational costs could eat into profit margins over time if they continue to grow at a rate that outpaces revenue.
Quality of earnings
As for the quality of these earnings, based on the consistent growth in key metrics like sales and operating income, it seems that the earnings are derived from core operations rather than one-off events or manipulations. The sustained growth in core operations reflects positively on the company's underlying business model and market demand. This could give it a substantial advantage in capitalizing on market opportunities and driving further growth.
Forward-Looking Analysis
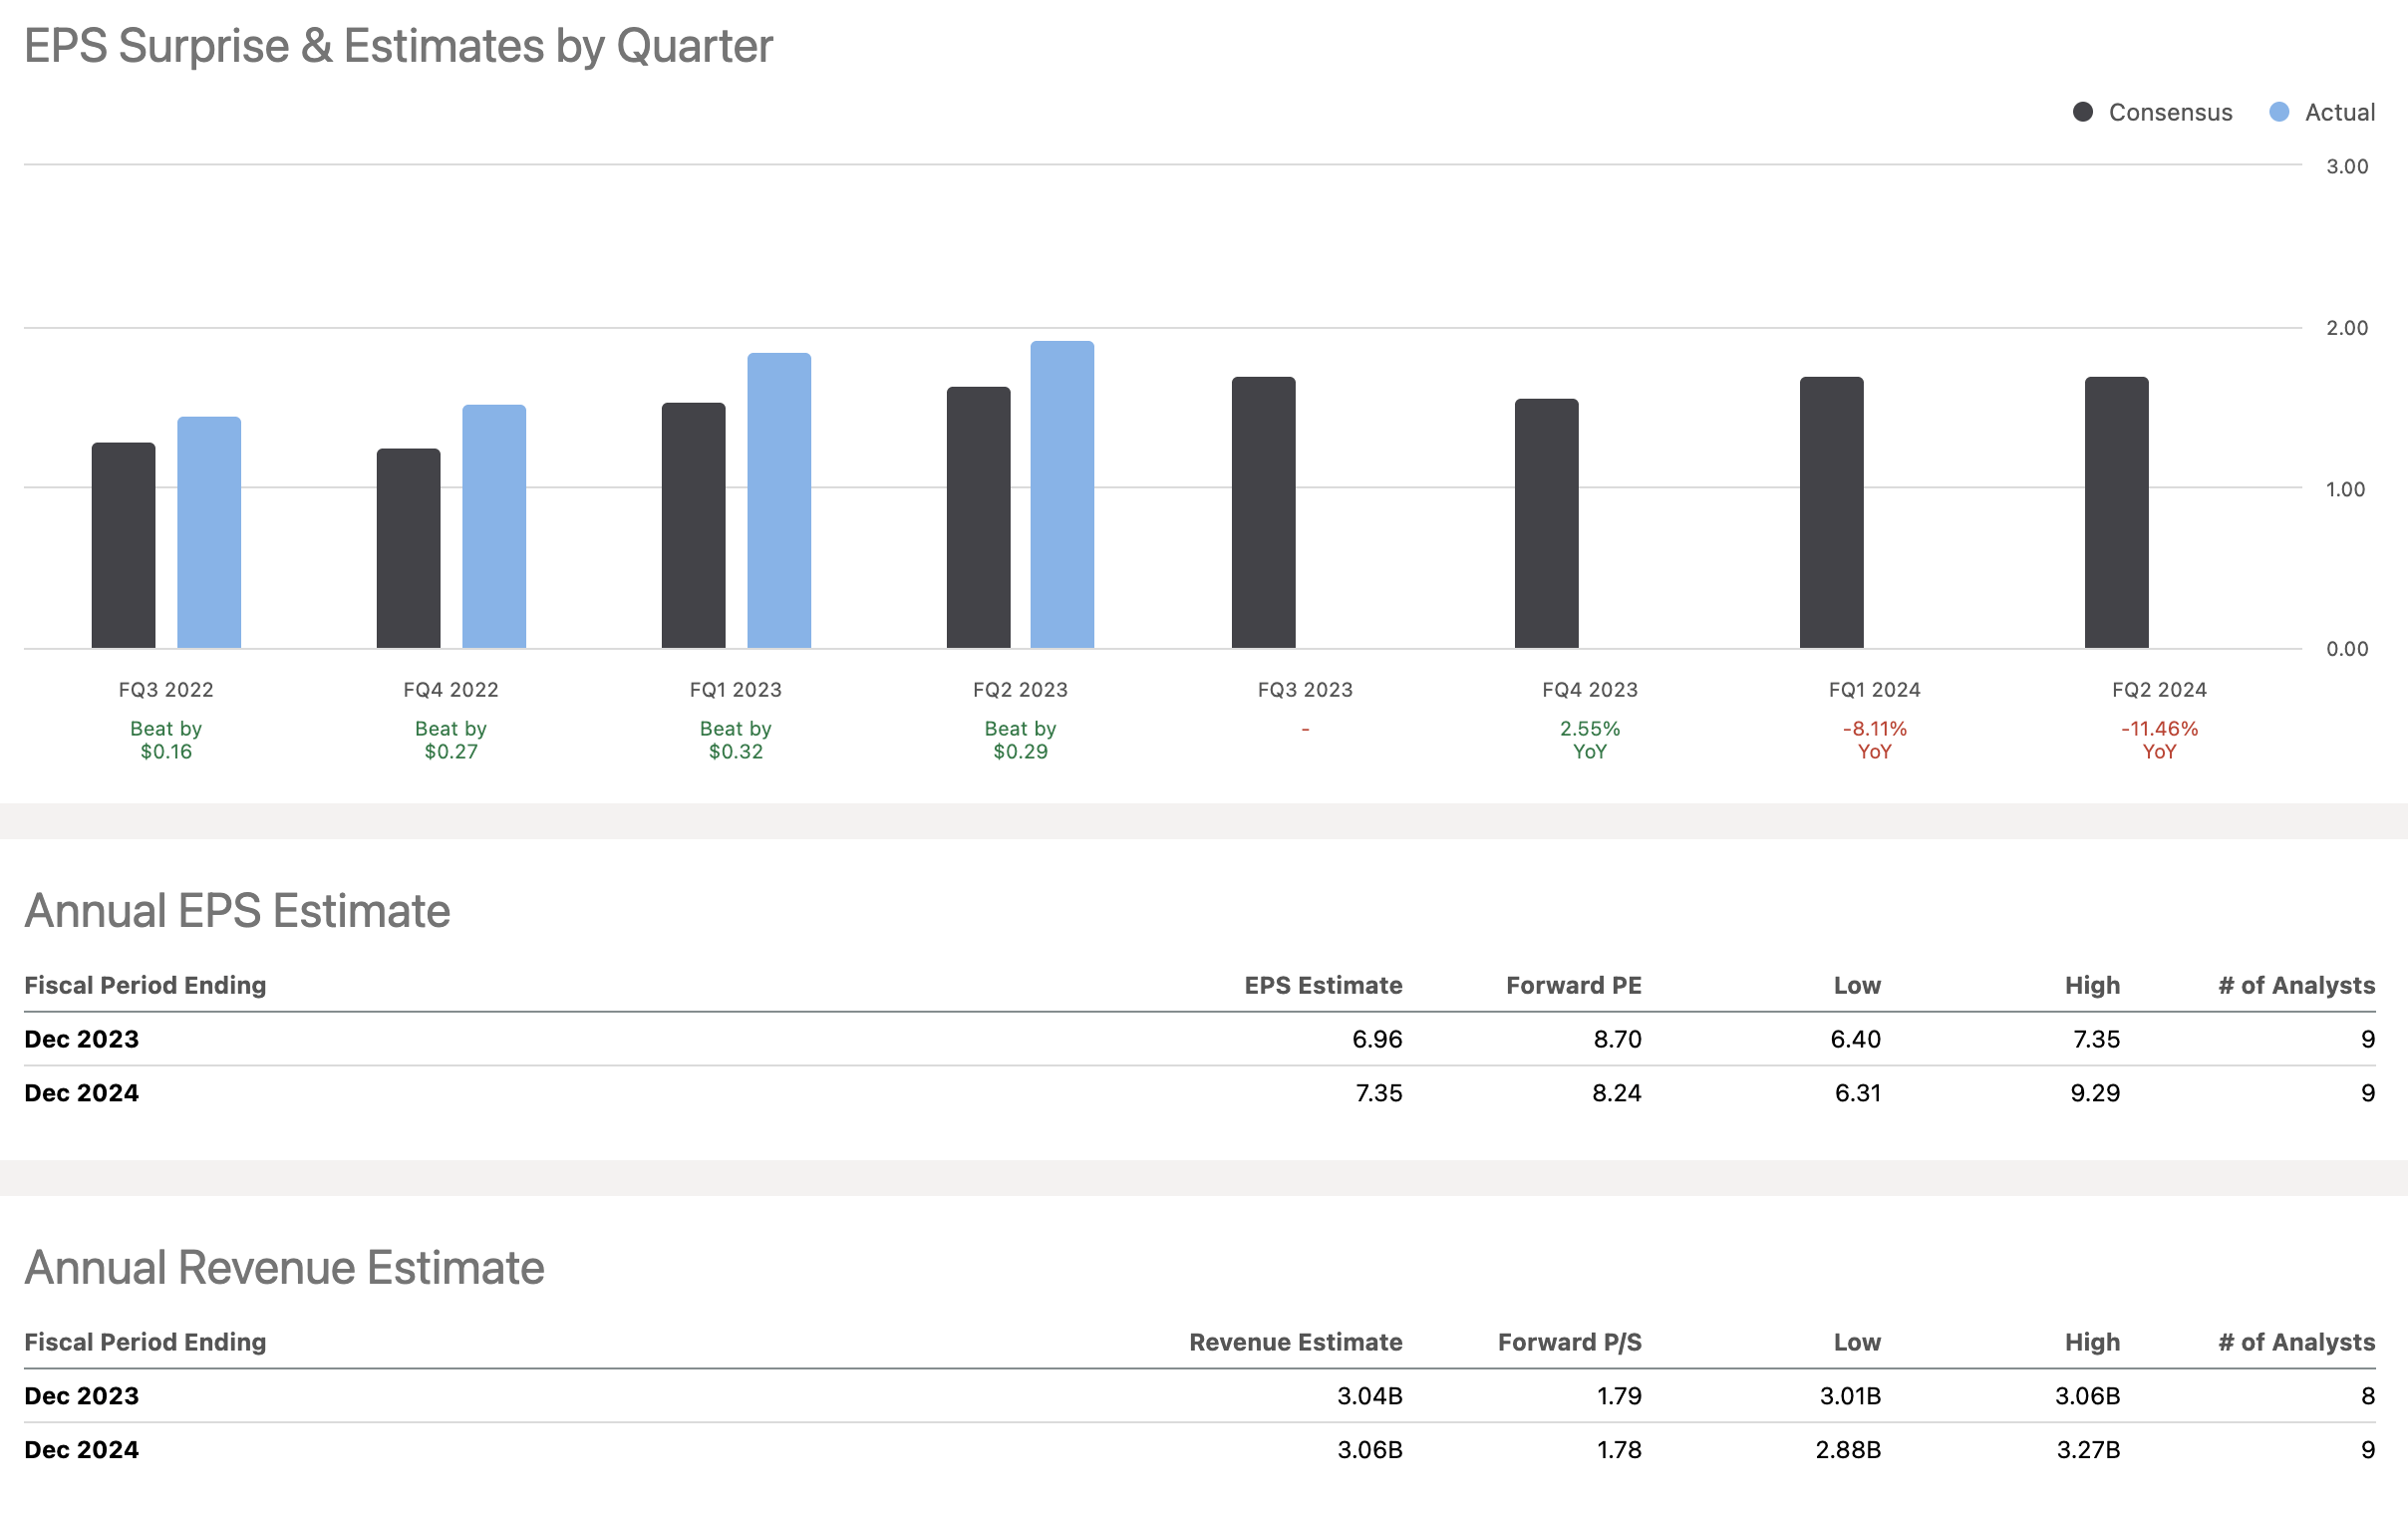
For the quarter ending September 30, 2023, six analysts have weighed in on the revenue expectations for the company. The low-end forecast for this quarter is $751 million, while the high-end estimate stands at $773 million. The median revenue prediction is $764 million, which is very close to the average forecast of $762.344 million, indicating a general consensus among analysts about the company's revenue-generating capabilities.
On the Earnings Per Share front, three analysts have offered their forecasts for the September-ending quarter. The lowest EPS estimate is $1.73, while the most optimistic prediction is at $2.1. The median EPS forecast stands at $1.79, which is slightly below the average forecast of $1.87. This suggests that the analysts are fairly bullish on the company's profitability for the upcoming quarter.
The data clearly suggests that analysts, on average, expect both revenue and EPS to grow in the September-ending quarter.
Balance Sheet Analysis
The firm's liquidity ratios, including a current ratio of 2.15 and a quick ratio of 1.59, suggest that it's in a strong position to meet its short-term obligations. These ratios are calculated from a total current asset base of $1,069 million against current liabilities of $497 million. With such ratios, the company has enough resources to pay off its immediate debts and even has a cushion if you exclude the inventories worth $278 million. Another positive is the company's asset growth, which has increased from $4,671 million to $4,856 million. This could indicate an increase in operational efficiency. The equity has also seen a jump from $874 million to $1,056 million, signaling that the company could be retaining more earnings or maybe even issuing new stock, both of which strengthen its financial standing.
The company's total liabilities remained almost static, moving from $3,797 million to $3,800 million, indicating controlled financial management. However, the Debt to Equity ratio stands at 2.37, calculated from long-term debt of $2,499 million against a stockholders' equity of $1,056 million. This ratio is high and tells us that the company is more reliant on borrowed funds than on equity for its operations. This approach is risky, especially if interest rates were to rise, increasing the cost of debt. Another flag is the increase in deferred revenue from $38 million to $46 million. Deferred revenue indicates a future obligation, and an increase here might mean the company is lagging in delivering its services or products, which is a concern for future revenue streams.
Based on the current rate of asset growth, it's expected that the total assets could hit around $5,000 million by mid-2024.
The company's cash reserves look strong, growing from $232 million to $351 million. This is a strong indicator of the company's ability to generate cash, which is essential for both daily operations and any long-term investment plans. This increase also suggests that the company is generating a positive cash flow, likely from its core business activities.
In summary, Allison Transmission Holdings shows strong liquidity, controlled liability management, and promising growth in assets and equity. However, there are areas of concern like its high reliance on debt and an increase in deferred revenue that need to be managed carefully.
Free Cash Flow Analysis
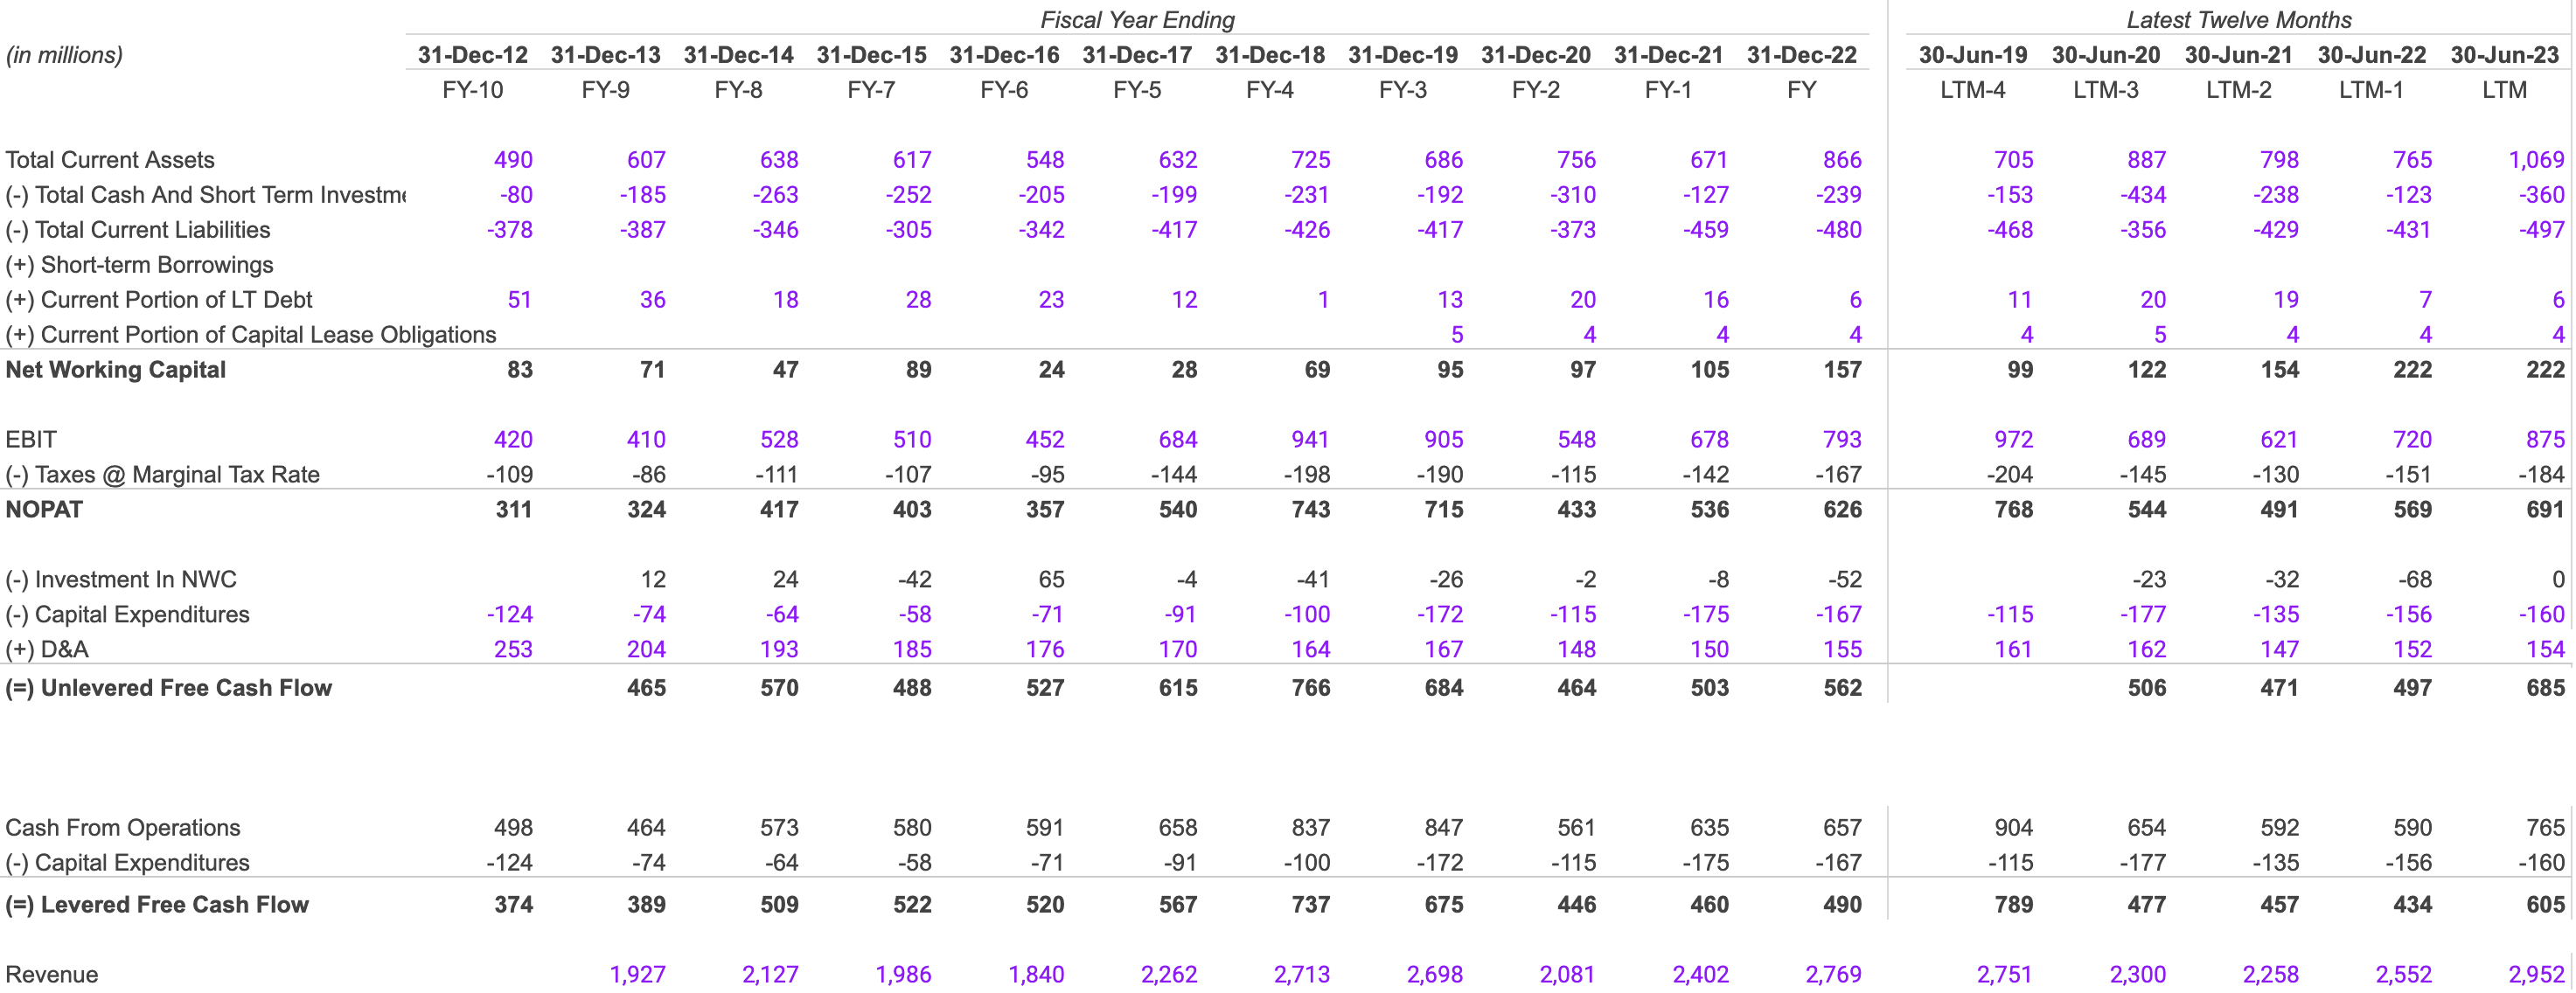
From 2021 to 2023, the company's total current assets jumped from $798 million to $1,069 million, a growth of 34%. During the same time, total current liabilities went up from $429 million to $497 million, but that's only a 16% increase. That means assets are growing faster than liabilities, and that's generally a good sign for any company.
In 2021, the Net Working Capital (NWC) stood at $154 million and increased to $222 million in 2022 and 2023. This consistent rise shows that the company has enough resources for its day-to-day operations. The Earnings Before Interest and Taxes (EBIT) was $621 million in 2021 and saw a steady uptick to $720 million in 2022 and further to $875 million in 2023. This indicates that the company is not just generating revenue but is also efficiently turning this into profit. This is confirmed when we look at the Net Operating Profit After Taxes (NOPAT), which went from $491 million in 2021 to $691 million in 2023.
On the Free Cash Flow front, the Unlevered Free Cash Flow jumped from $471 million in 2021 to $685 million in 2023, and the Levered Free Cash Flow followed suit, increasing from $457 million to $605 million over the same period. These numbers suggest the company has a good amount of cash that can be used for reinvestments or distributed to shareholders. But it's not just the cash flows that are impressive; the quality of earnings is also robust.
The company's revenue saw a 31% growth, climbing from $2,258 million in 2021 to $2,952 million in 2023. The steady increase in EBIT and NOPAT indicates that the earnings are likely coming from core business activities rather than one-off events. Also, the stable NWC negates the possibility of earnings manipulation through short-term assets or liabilities.
Looking ahead, the company seems set for more growth. The EBIT increased by 7% from 2021 to 2022 and 21% from 2022 to 2023. If we take a conservative estimate of 15% growth for 2024, the EBIT would stand at roughly $1,006 million. After applying the marginal tax rate, the NOPAT would be around $795 million. Assuming the capital expenditures remain stable, the Unlevered Free Cash Flow could reach approximately $790 million. The total current liabilities have increased by 16%, going from $429 million in 2021 to $497 million in 2023, which could become a financial risk if the current assets don't grow in tandem.
The company's strengths lie in its growing EBIT, NOPAT, and free cash flows along with stable NWC, pointing to operational efficiency. The weakness is the increasing current liabilities. Opportunities are abundant given the consistent growth in EBIT and NOPAT, which could mean room for expansion. The threat would be the increasing capital expenditures that could potentially strain free cash flows if not managed well.
Shareholder Yield
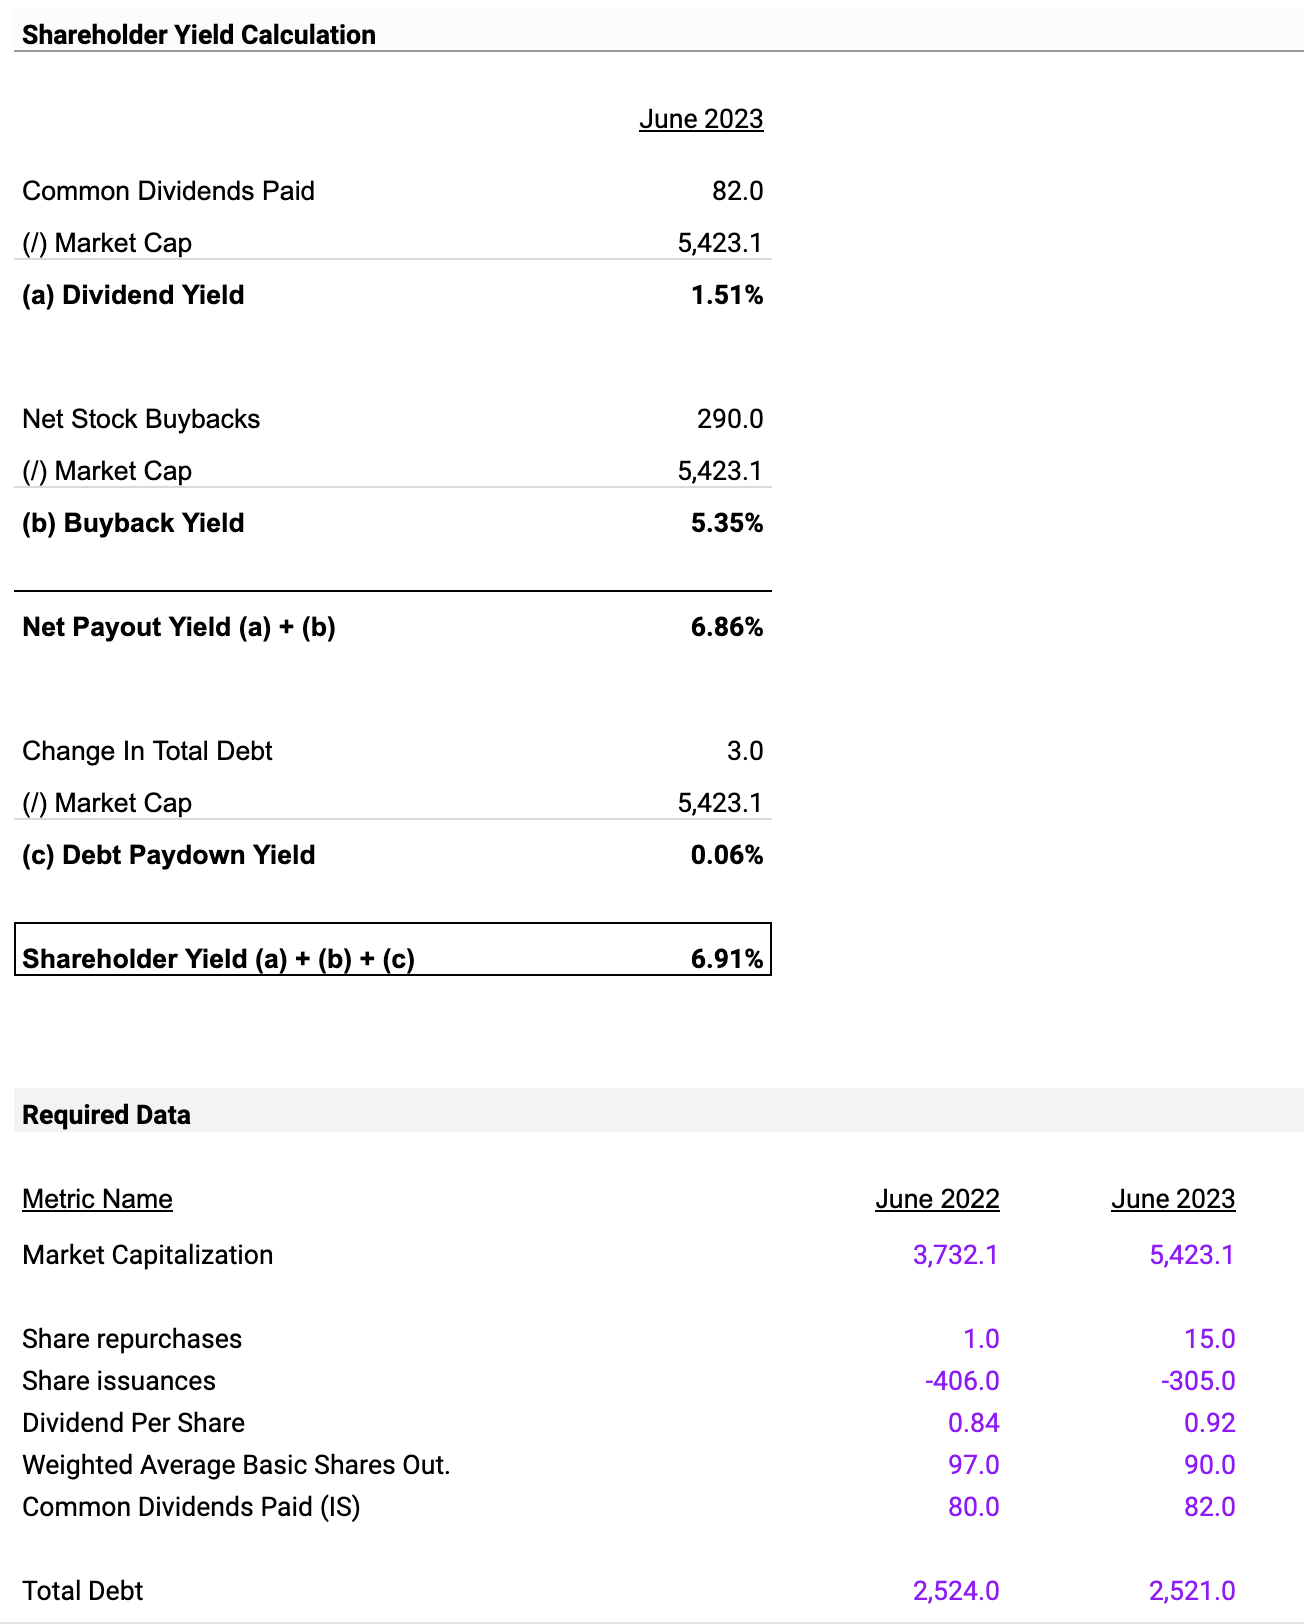
The shareholder yield is 6.91%. This number is crucial because it's essentially a snapshot of what the company is giving back to its shareholders. Broken down, the 6.91% comprises a dividend yield of 1.51%, a buyback yield of 5.35%, and a minuscule debt paydown yield of 0.06%. The dividend yield reflects the company's policy of returning value to shareholders through cash payments, while the buyback yield indicates that the company is also repurchasing its shares to possibly boost stock value. The small debt paydown yield suggests that reducing debt is not currently a focus for the company. From the get-go, the high shareholder yield, especially the large contribution from buybacks, serves as a green flag, demonstrating the company's effective strategy of value return to its investors.
Focusing on what drives the company's value, it's evident that the buyback yield of 5.35% and the dividend yield of 1.51% are the main engines here.
Valuation
I am doing a comparables valuation for the company. For my analysis, I have selected six benchmark companies to draw comparisons with Honeywell ( HON ), CNH Industrial ( CNHI ), Winnebago Industries ( WGO ), THOR Industries ( THO ), Sypris Solutions ( SYPR ), and Allison Transmission Holdings ( ALSN ). These companies operate in similar industries and have comparable financial metrics, making them suitable for a valuation comparison.
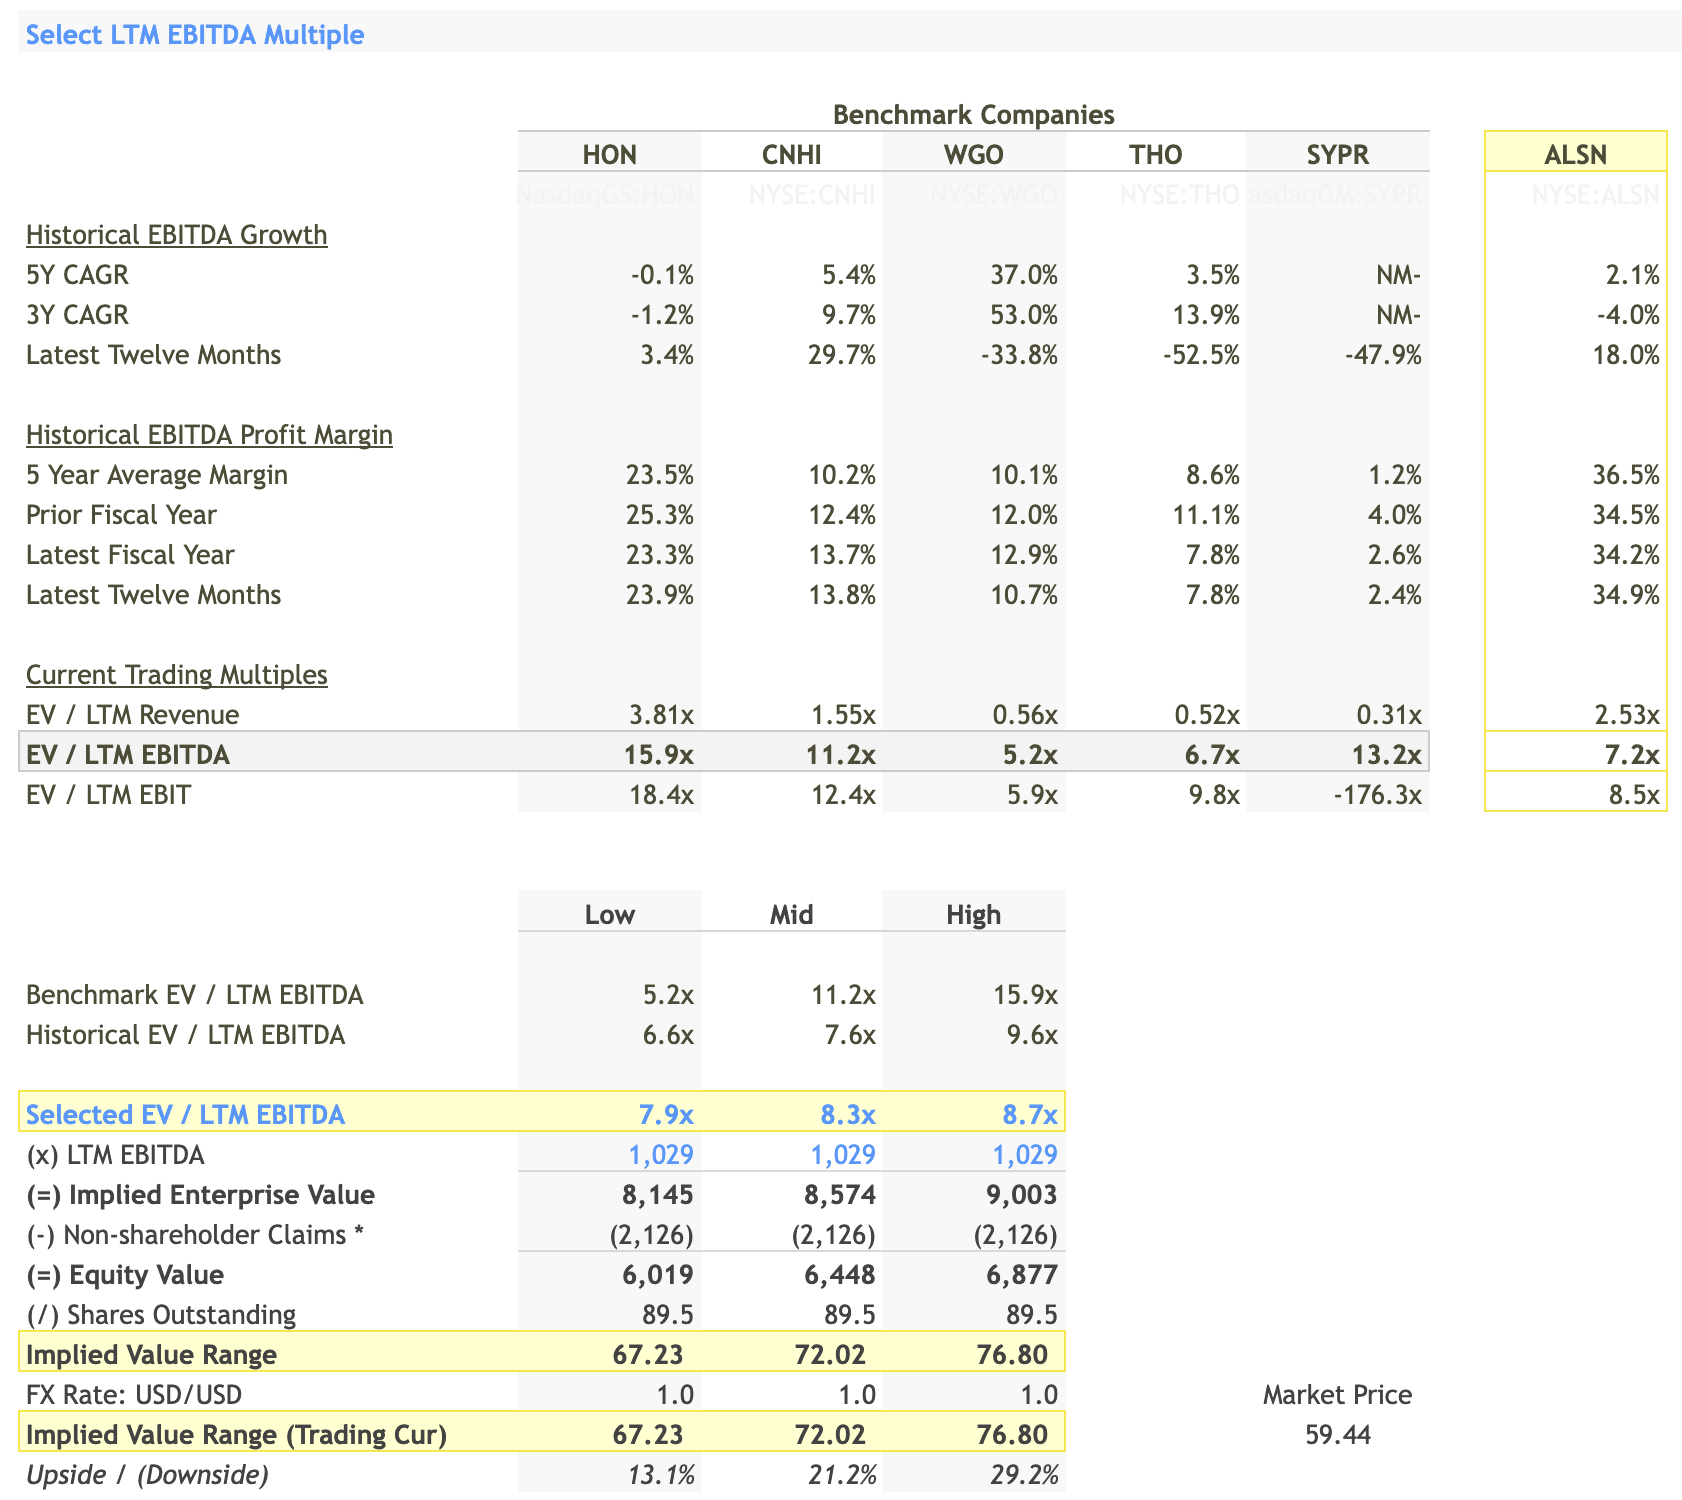
Select LTM EBITDA Multiple
- Benchmark Ranges : EV/LTM EBITDA for the selected companies ranges from 5.2x ((WGO)) to 15.9x ((HON)).
- Selected Multiple : Based on this, I have selected an EV/LTM EBITDA multiple range of 7.9x to 8.7x. It's a conservative estimate, closer to the lower end of the benchmark range but higher than the historical range of 6.6x to 9.6x.
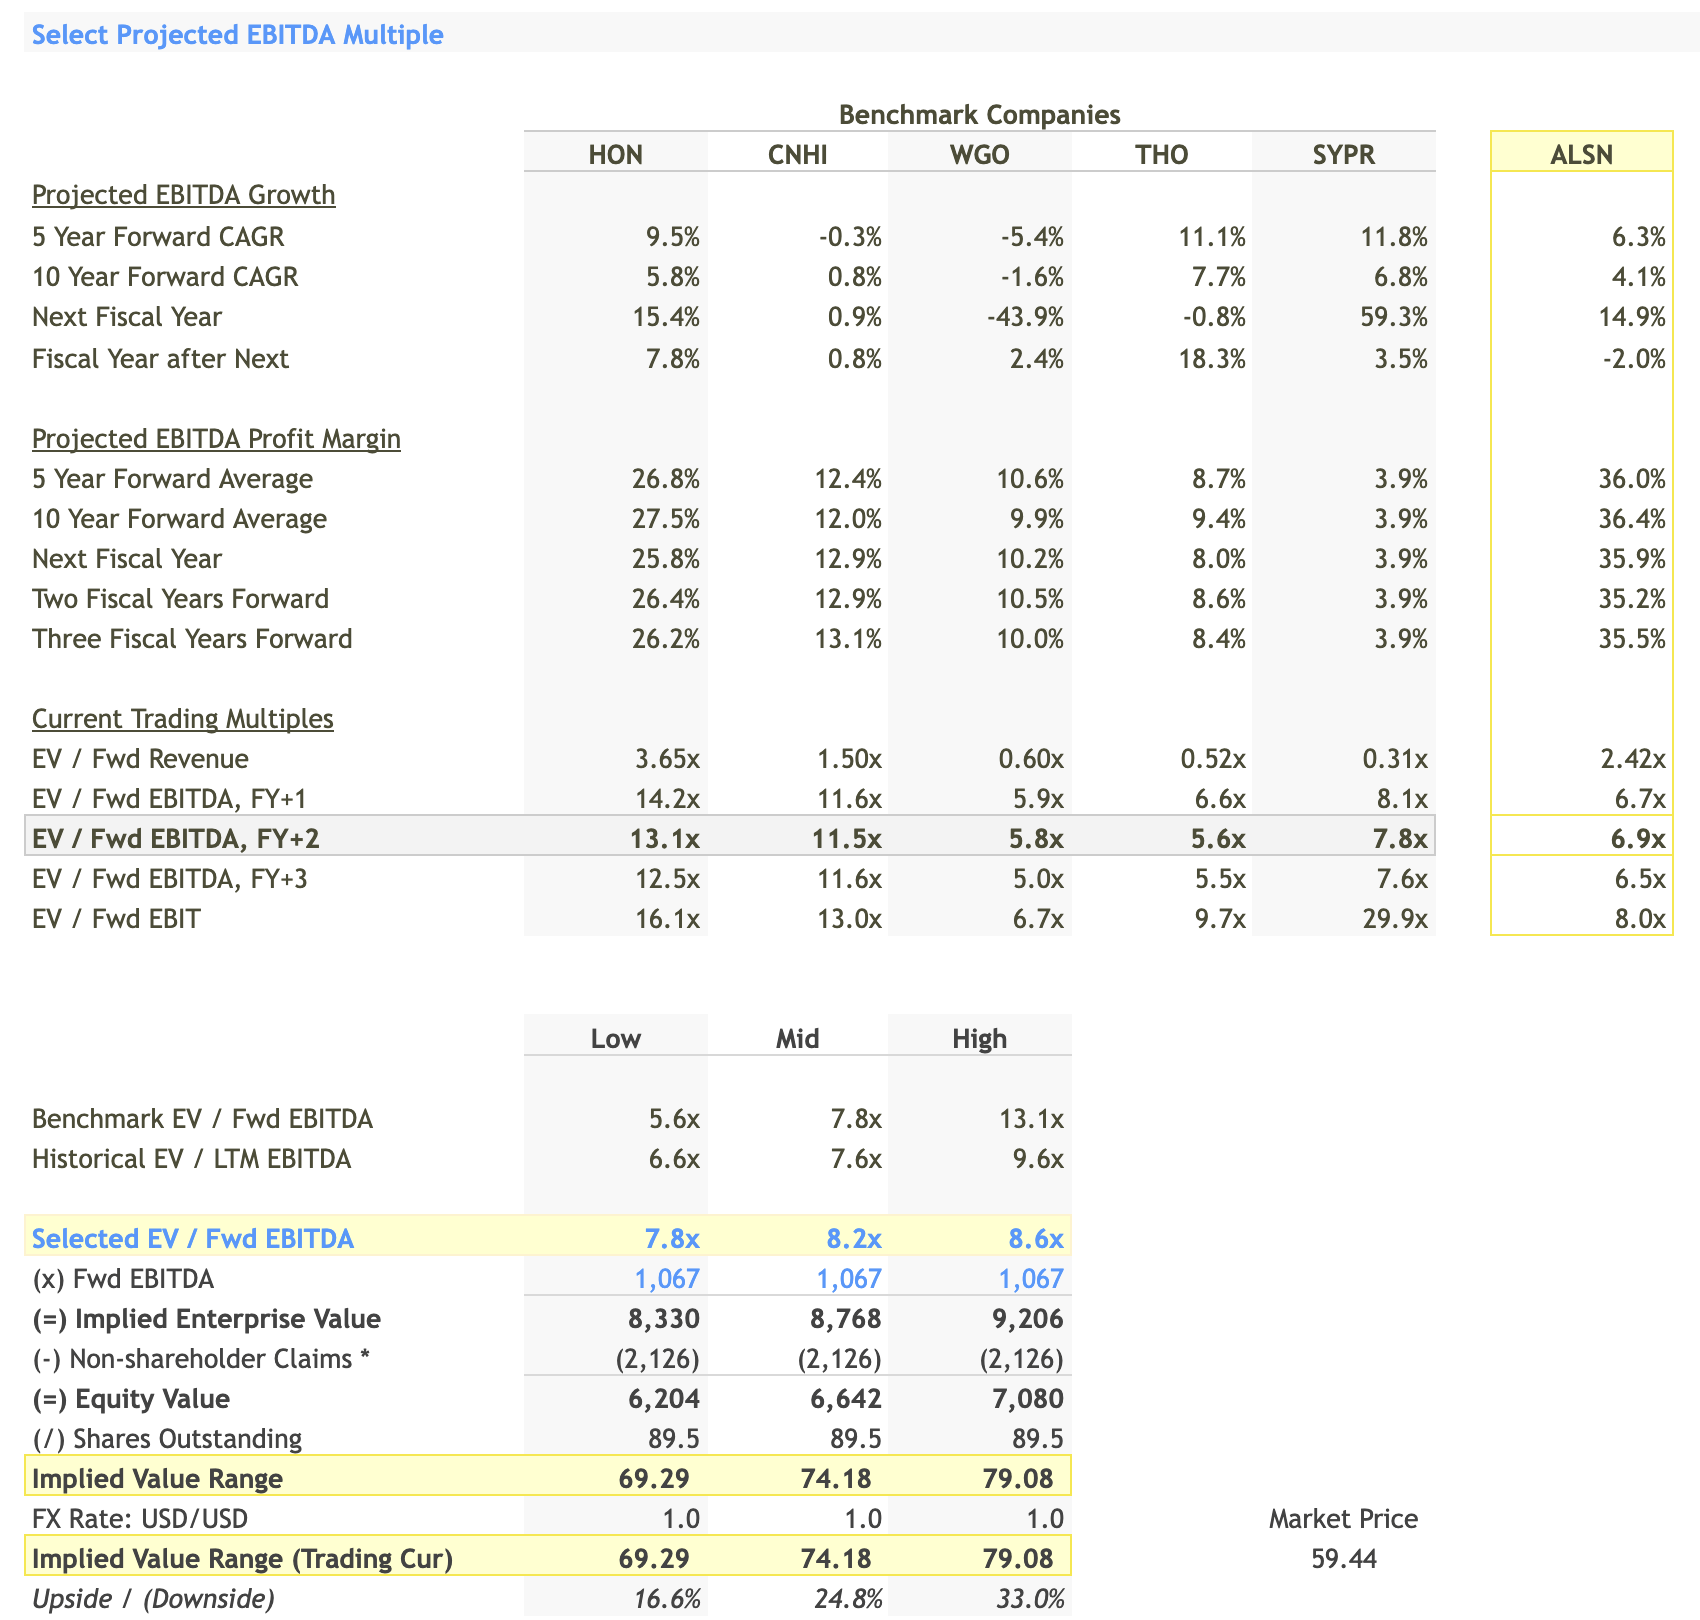
Select Projected EBITDA Multiple
- Benchmark Ranges : EV/Fwd EBITDA ranges from 5.6x ((WGO)) to 13.1x ((HON)).
- Selected Multiple : My selected range for EV/Fwd EBITDA is 7.8x to 8.6x. This aligns closely with the selected LTM EBITDA multiple and represents a balanced view of the company's future prospects.
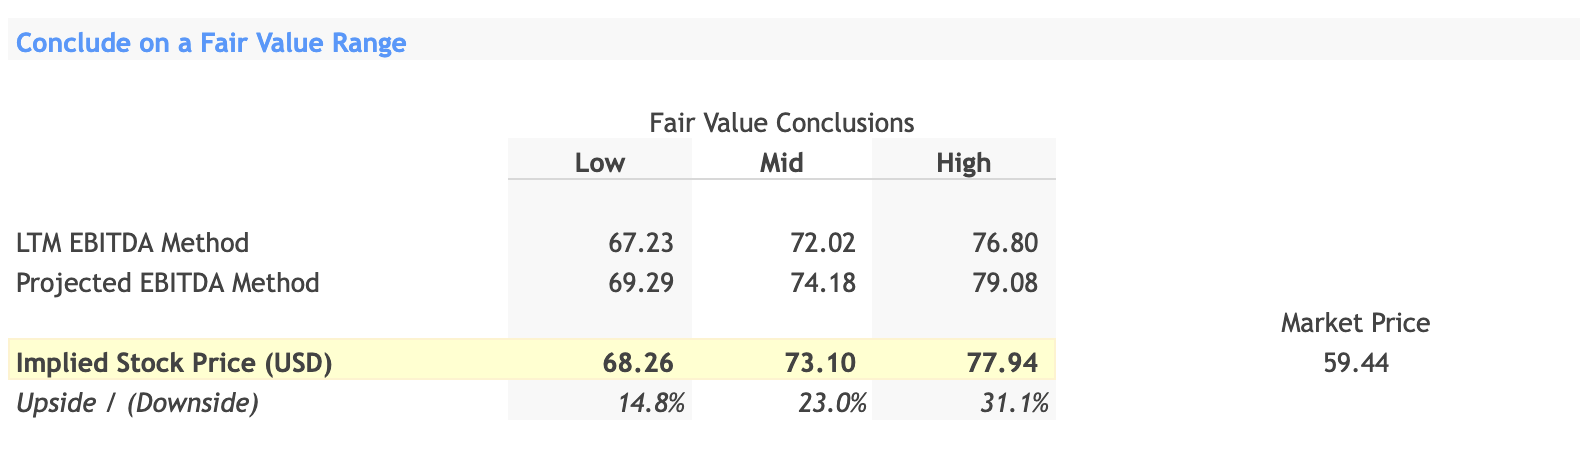
Fair Value Range
- LTM EBITDA Method : Implied Value Range is $67.23 to $76.80 per share.
- Projected EBITDA Method : Implied Value Range is $69.29 to $79.08 per share.
- Implied Stock Price : Averaging both methods, I arrive at a fair value range of $68.26 to $77.94 per share.
Buy Decision
Based on my analysis, the implied stock price ranges from $68.26 to $77.94, compared to the current market price of $59.44. This suggests a potential upside of 14.8% to 31.1%, making it a strong buy.
For further details see:
Allison Transmission Holdings: A Long-Term Buy For Aggressive Investors