ALTO - Alto Ingredients Inc.: A Case For A 'Hold' Strategy
2023-10-02 11:12:30 ET
Summary
- Implied fair value suggests potential undervaluation of Alto Ingredients stock, with a growth potential of up to 20.2%.
- A prudent approach is to employ a "Hold" investment strategy due to the company's financial instability and potential for transformation.
- Strategic imperatives include diversifying revenue streams, mitigating commodity market volatility, and enhancing profitability.
Investment Thesis
Alto Ingredients, Inc. (ALTO), a major U.S. producer and supplier of specialized alcohols and essential ingredients, is at a pivotal stage in its business journey. As the largest manufacturer of specialty alcohols in the country, the company has an extensive footprint across multiple regions and an annual production capacity that is both large and strategically positioned. Despite its historical successes and future-oriented plans aimed at market leadership, a thorough review of its financial metrics shows a mix of instability and substantial potential for positive change.
Alto's Implied Fair Value suggests that the stock's future growth could range from a modest 2.9% to an optimistic 20.2%. Given that the current market price is $4.42, the calculated fair value for the stock, ranging from $4.55 to $5.31, implies that it is likely undervalued at present.
In light of the mixed financial indicators from Alto, which blend areas of caution with encouraging signs, adopting a "Hold" investment strategy is the most advisable course of action, however.
Overview
The company is a leading producer and distributor of specialty alcohols and essential ingredients, and the largest producer of specialty alcohols in the United States.
Production Capacity : The company has the largest production of specialty alcohols in the U.S., with an annual capacity of 350 million gallons.
Diversification : The company produces a wide range of alcohols and essential ingredients, catering to various markets like Health, Home & Beauty; Food & Beverage; Essential Ingredients; and Renewable Fuels.
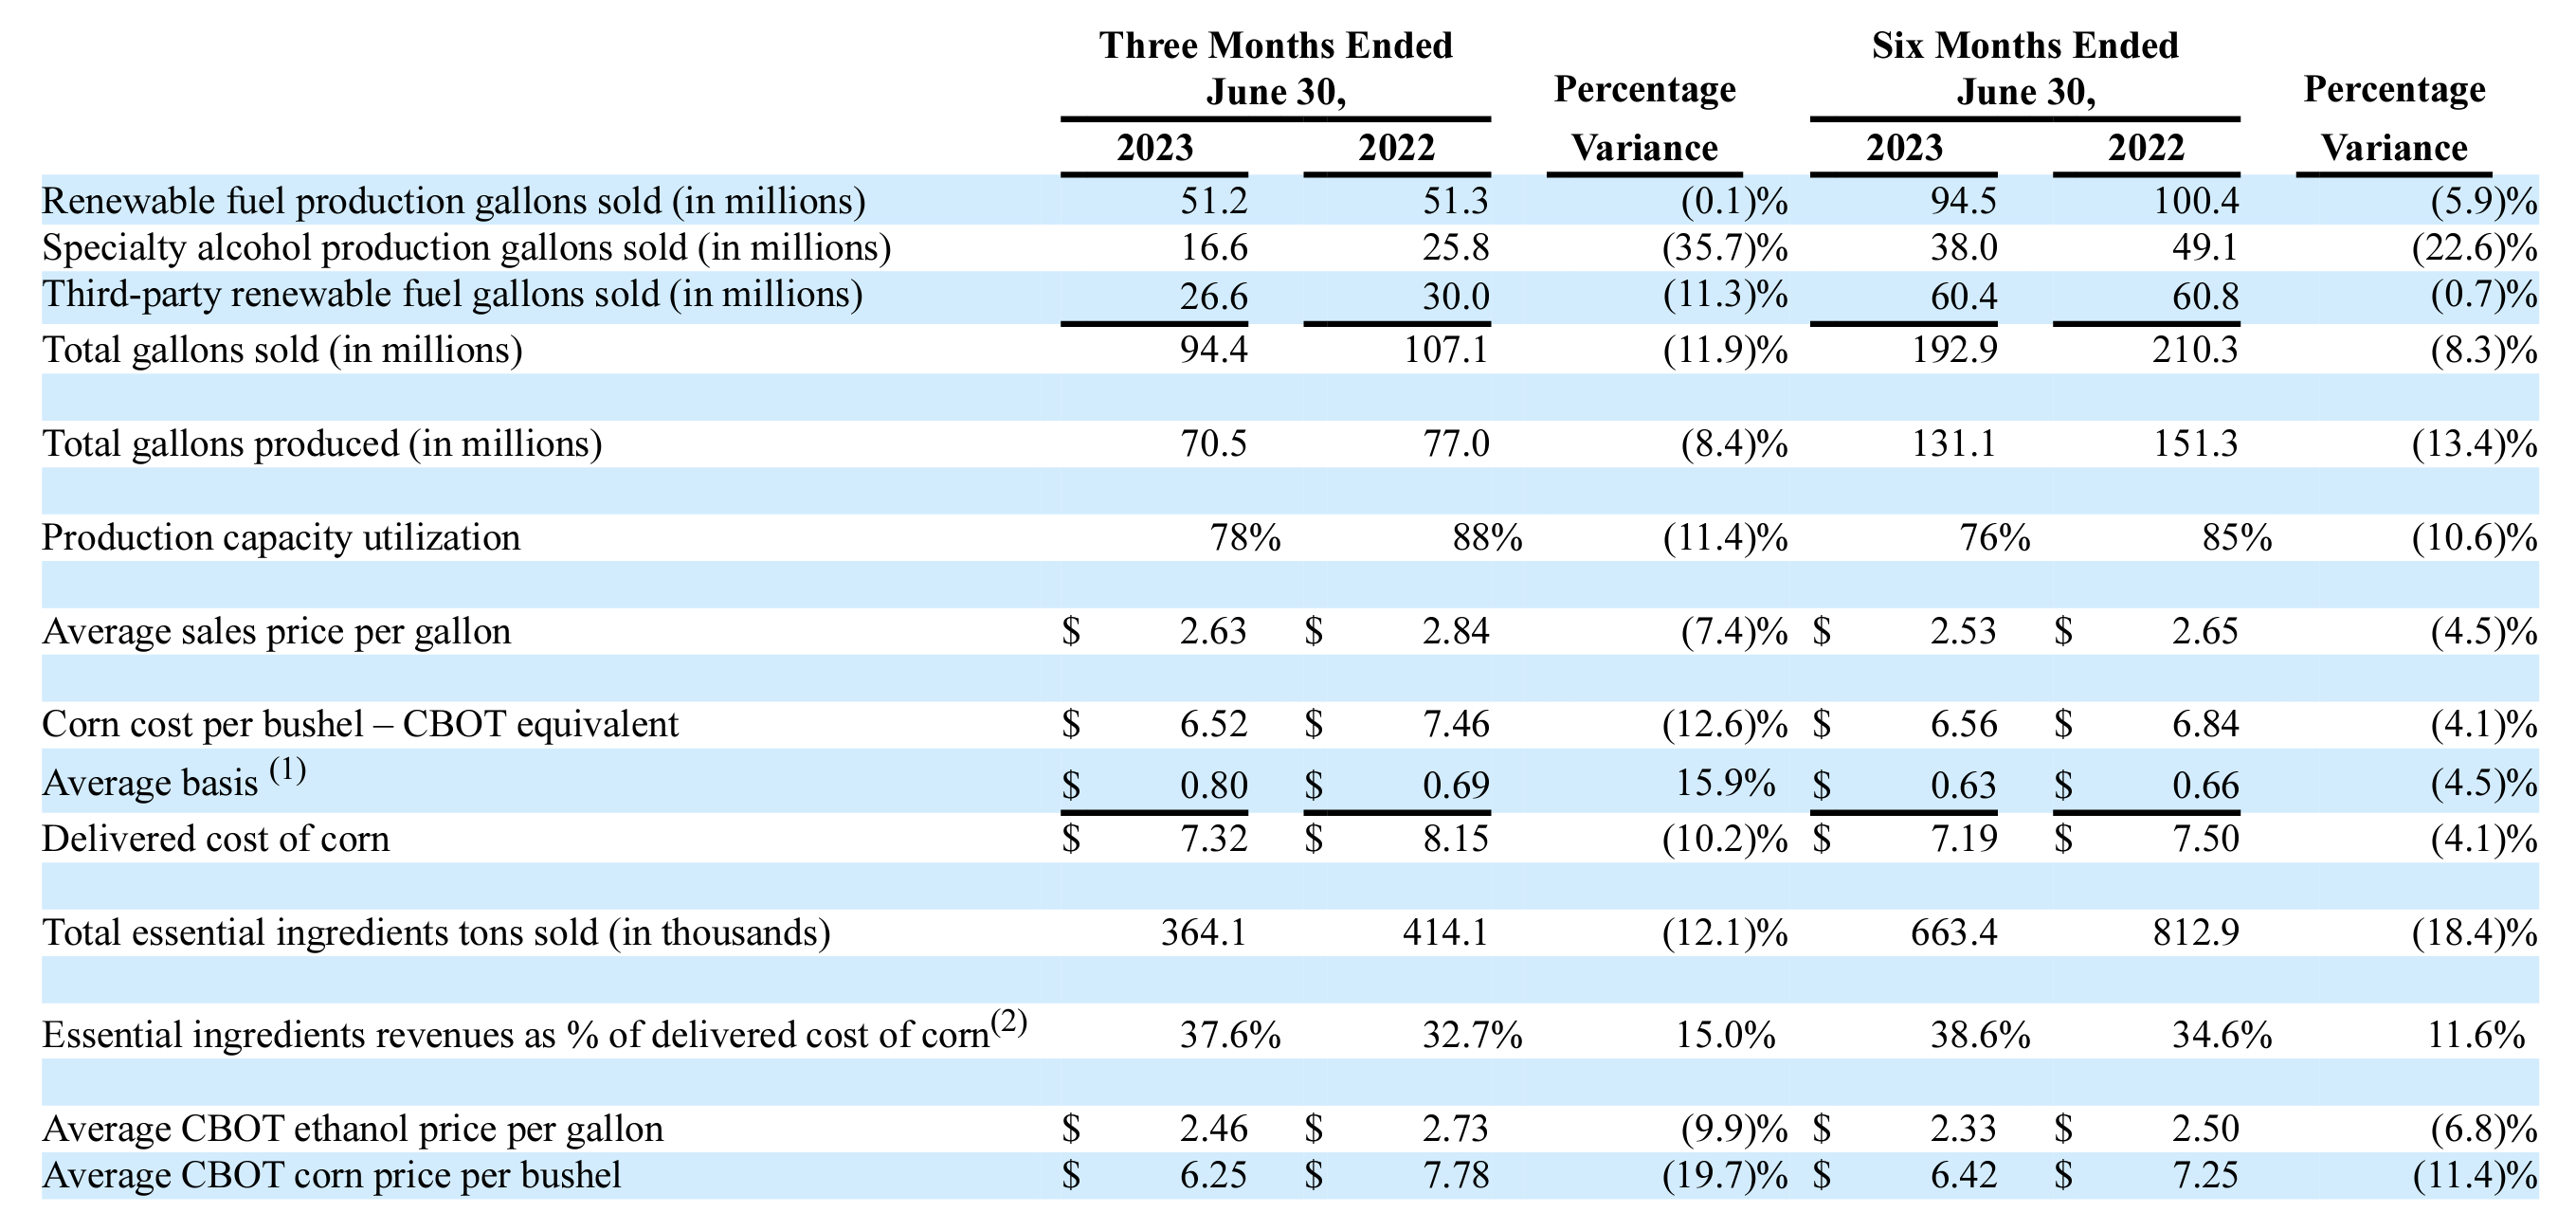
Performance Metrics (2023 Vs. 2022)
- Specialty alcohol production gallons sold : A 35.7% drop is alarming, showing a clear decline in this sector.
- Third-party renewable fuel gallons sold : An 11.3% decline suggests less demand or supply issues.
- Total gallons sold : 11.9% drop year-over-year. That's a significant decline in overall sales.
- Production capacity utilization : Dropped from 88% to 78%, indicating underutilization of resources.
- Average sales price per gallon : A decrease in sales price from $2.84 to $2.63 suggests a weakening pricing power.
- Corn cost per bushel : It's down by 12.6%, which is good as it reduces production costs.
Key Takeaways
- Revenue Drivers are declining : Both renewable fuels and specialty alcohols are not doing well.
- Significant drop in specialty alcohol gallons : This could severely impact profits.
- Costs are more manageable : Corn prices are down, which is good but not enough to offset the decrease in sales.
- Operational inefficiency : Low production capacity utilization is concerning.
Free Cash Flow Analysis
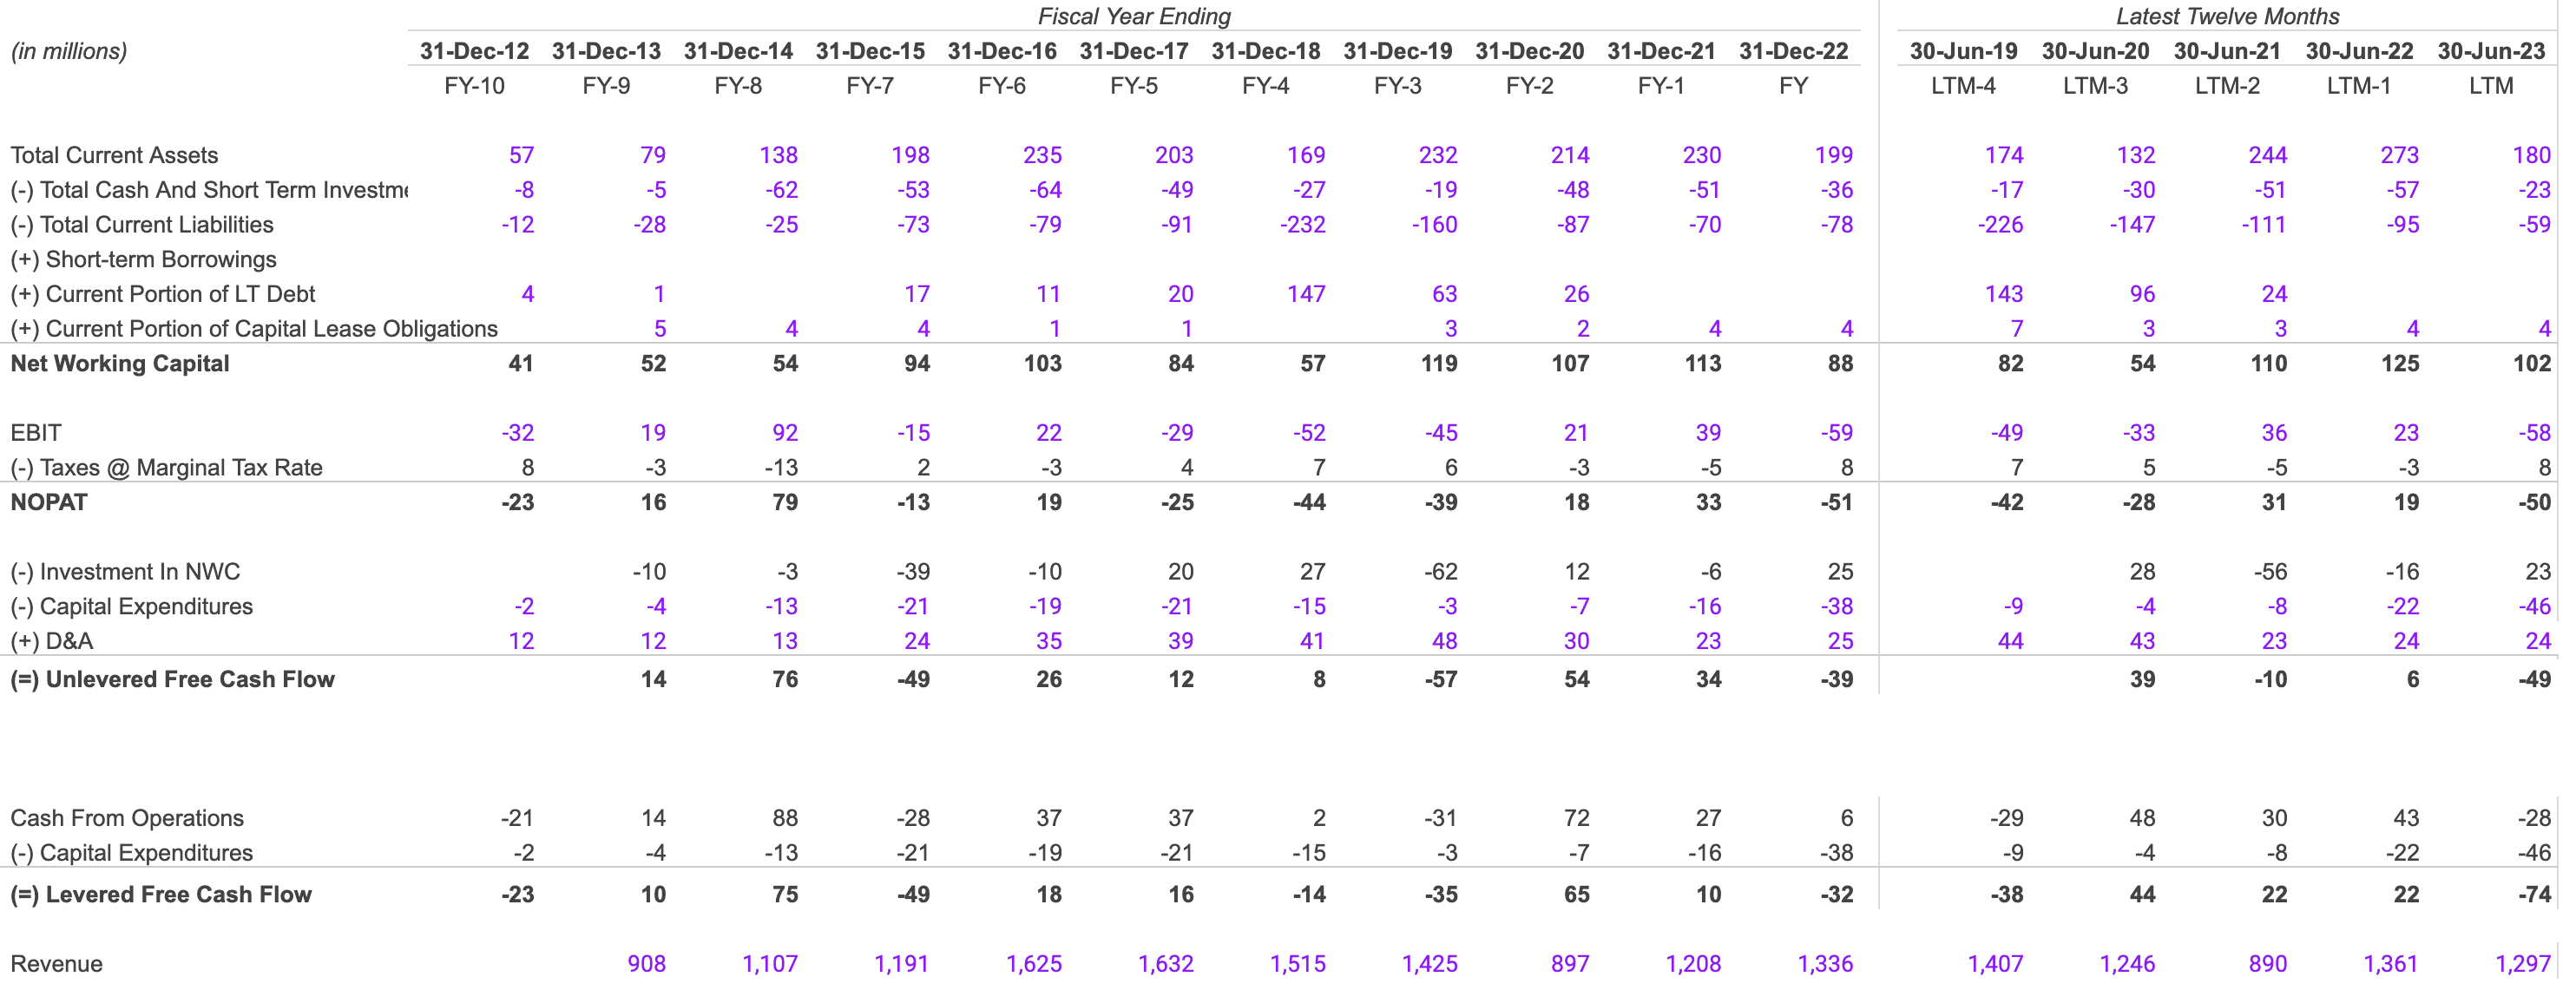
- Total Current Assets : These are what the company owns that could be turned into cash quickly. The numbers have decreased from $273 Mn to $180 Mn in the latest year, which may be a cause for concern.
- EBIT (Earnings Before Interest and Taxes) : This went from a positive $23 Mn to a negative $58 mn, indicating that the company's core operations aren't doing well.
- Unlevered Free Cash Flow : It's cash from operations minus the money used for investments. Going from $6 Mn to $-49 Mn is a bad sign.
Red Flags and Abnormalities
- Negative EBIT : This is a serious red flag. It suggests that the core business is not generating profit.
- Negative Unlevered and Levered Free Cash Flow : The company is burning through cash. This is a potential red flag for future financial health.
Liquidity and Solvency
- Liquidity : Decreasing current assets and a negative cash flow suggest the company could struggle to meet short-term obligations.
- Solvency : With declining earnings and cash flows, the company may face difficulties meeting long-term obligations too.
Risk Assessment
Given the negative EBIT and free cash flow, I believe the company is at financial risk. Its core operations are underperforming, making it risky.
Altman Z-Score
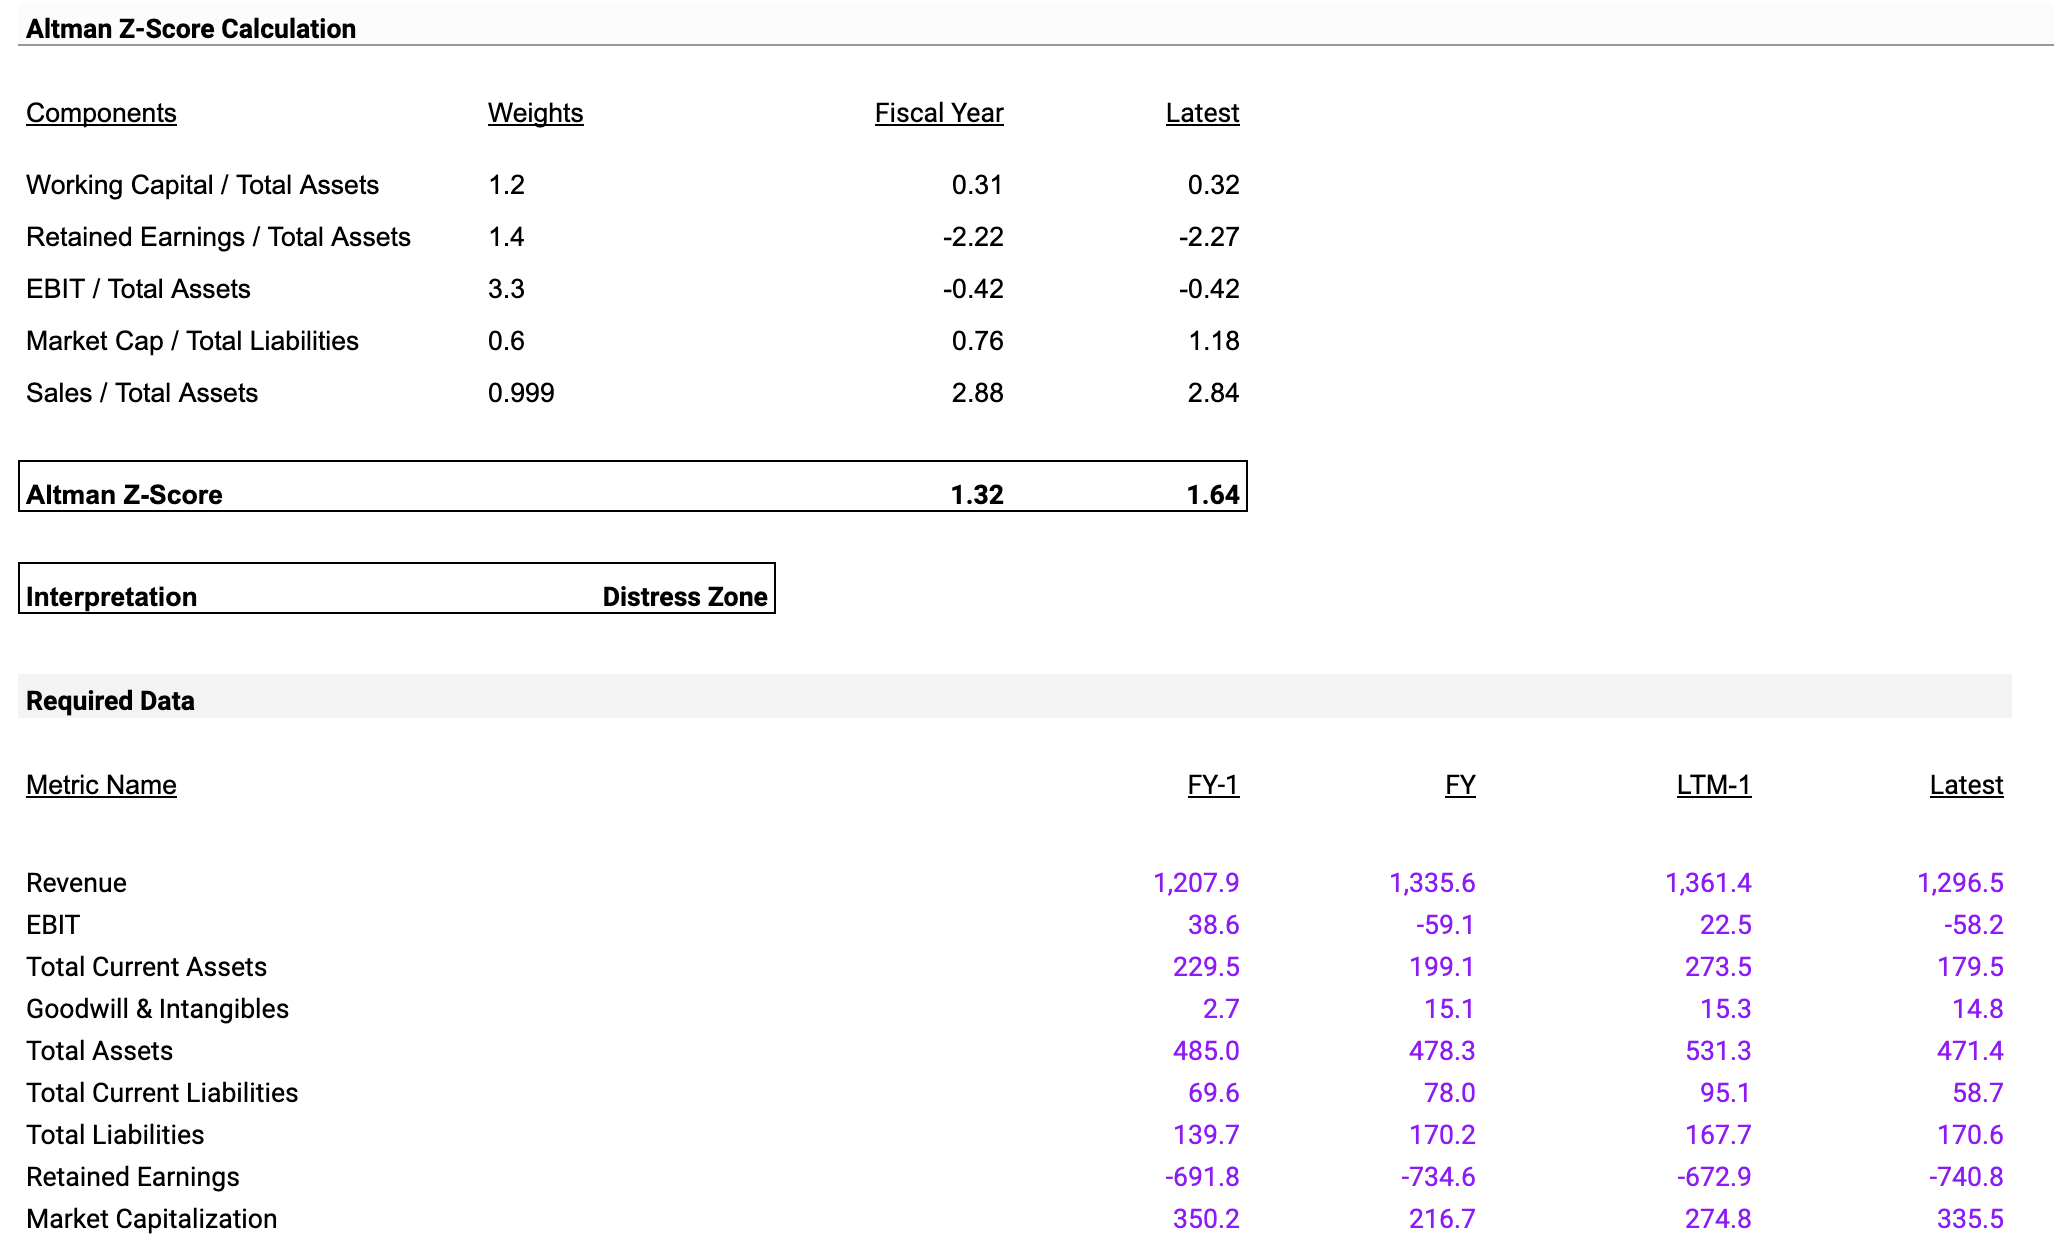
The Altman Z-Score is a formula used to predict the likelihood that a business will go bankrupt within the next two years. Scores below 1.8 suggest a high risk of bankruptcy, scores between 1.8 and 3 suggest some risk, and scores above 3 suggest low risk.
-
Working Capital / Total Assets : This ratio went from 0.31 to 0.32, a slight increase. Working capital is essentially the money the company has for day-to-day stuff, so a small uptick could be a good sign.
-
Retained Earnings / Total Assets : This went from -2.22 to -2.27, which isn't great. It basically says the company isn't keeping much of the money it earns.
-
EBIT / Total Assets : It stayed the same at -0.42. EBIT stands for Earnings Before Interest and Taxes. When divided by Total Assets, it gives an idea of how effective the company is at using its assets to generate earnings. Negative is not good.
-
Market Cap / Total Liabilities : This ratio increased from 0.76 to 1.18, which is a positive sign. It shows the company has more value in the market compared to what it owes.
-
Sales / Total Assets : It went from 2.88 to 2.84, a small decrease, but still high. This indicates the company is efficient at using its assets to make sales.
-
Altman Z-Score : It moved from 1.32 to 1.64. While it's an improvement, it's still below 1.8, indicating the company is at some risk of bankruptcy.
Based on the current data, the company is at moderate to high financial risk. The low Altman Z-Score and negative Retained Earnings are particularly risky.
Owner Earnings
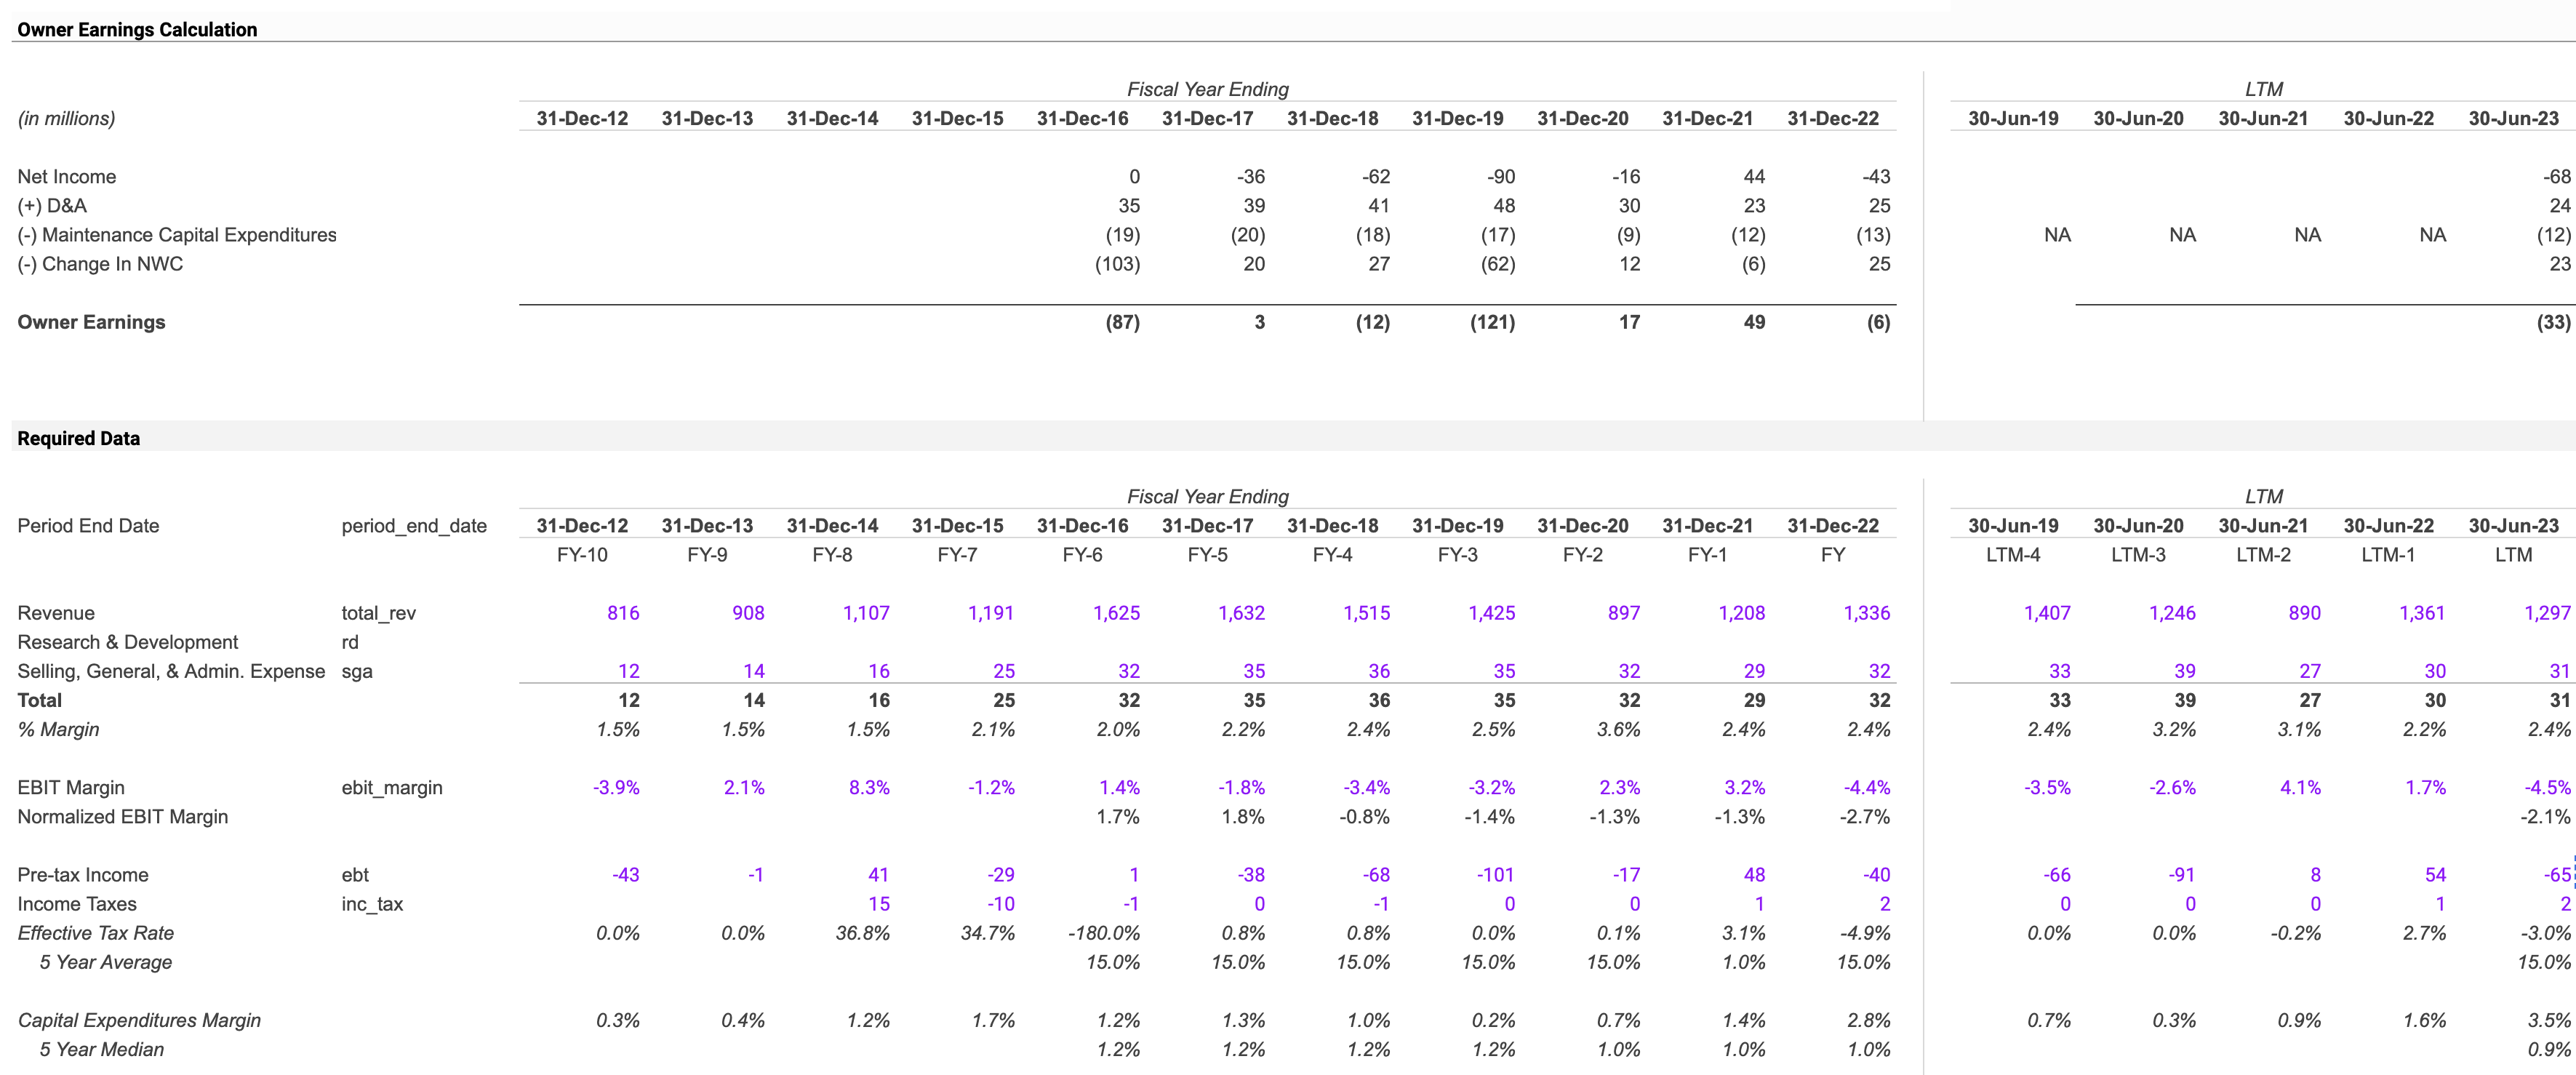
Net Income : We see it going from -16 million in 2020 to 44 million in 2021 and then dropping back to negative in 2022 and 2023. This is inconsistent.
Increasing Maintenance Capital Expenditures : These are stable at $12Mn to $13 Mn and high relative to declining revenues. As these grow, the amount of cash the business can use for other things shrinks.
Negative Owner Earnings in Recent Years : At negative $33 million, this is a strong indicator that the company is not generating enough value for its shareholders.
Risk Assessment
The company seems to be at a high financial risk, especially considering the negative Owner Earnings and inconsistent Net Income.
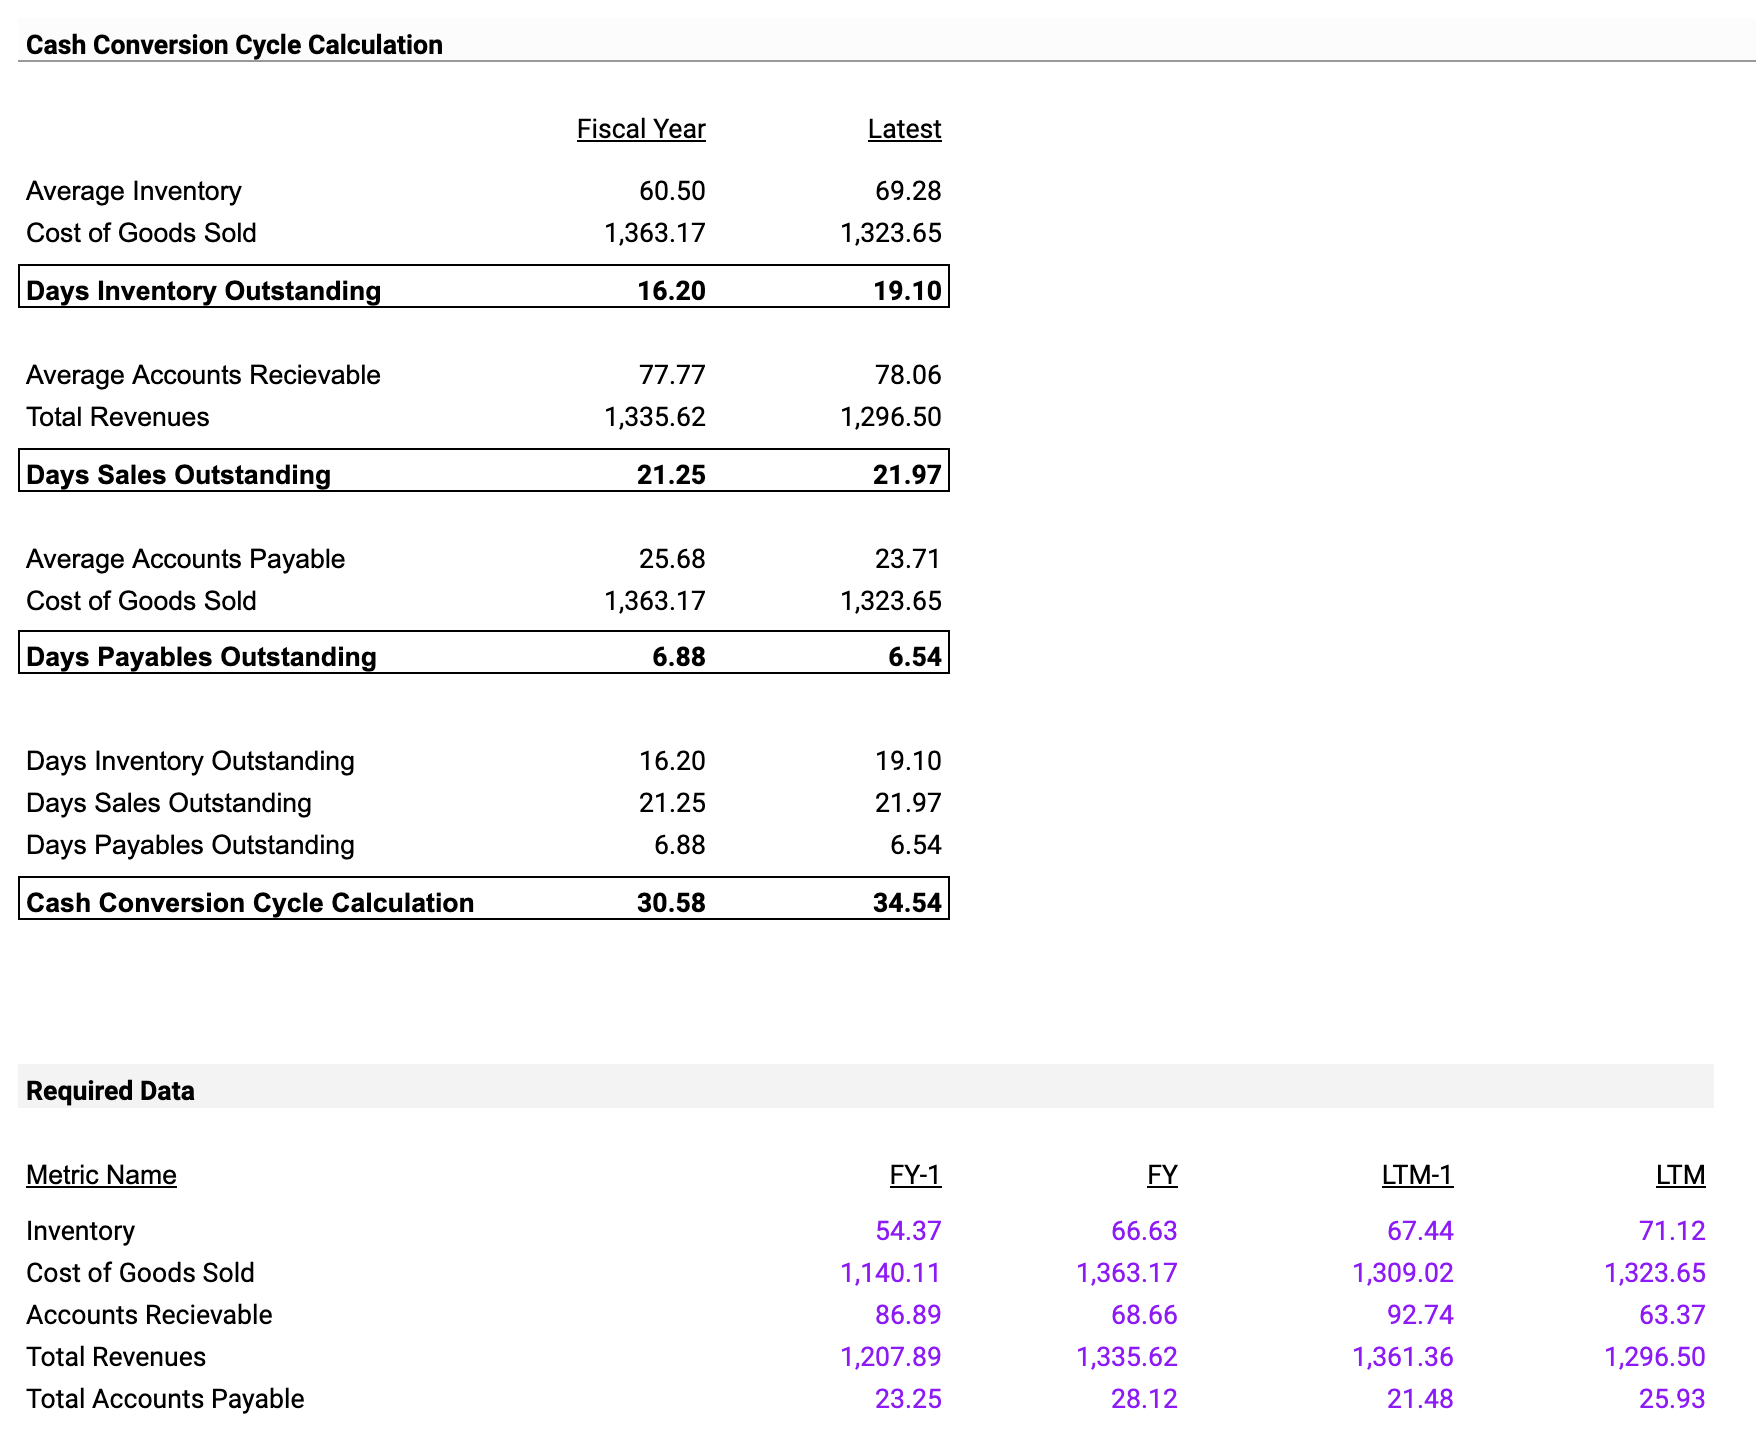
Cash Conversion Cycle
Evaluating Inventory and Payment Efficiency
Days Inventory Outstanding increased from 16.20 to 19.10 days, indicating a longer time to sell off inventory. Additionally, Days Sales Outstanding rose from 21.25 to 21.97 days, showing a minor delay in collecting money from sales. On the other hand, Days Payables Outstanding decreased from 6.88 to 6.54 days, which means the company is paying its suppliers a bit more quickly.
Cash Flow Analysis: Assessing Financial Health
The Cash Conversion Cycle, which measures how long it takes to turn investments into cash, increased from 30.58 to 34.54 days.
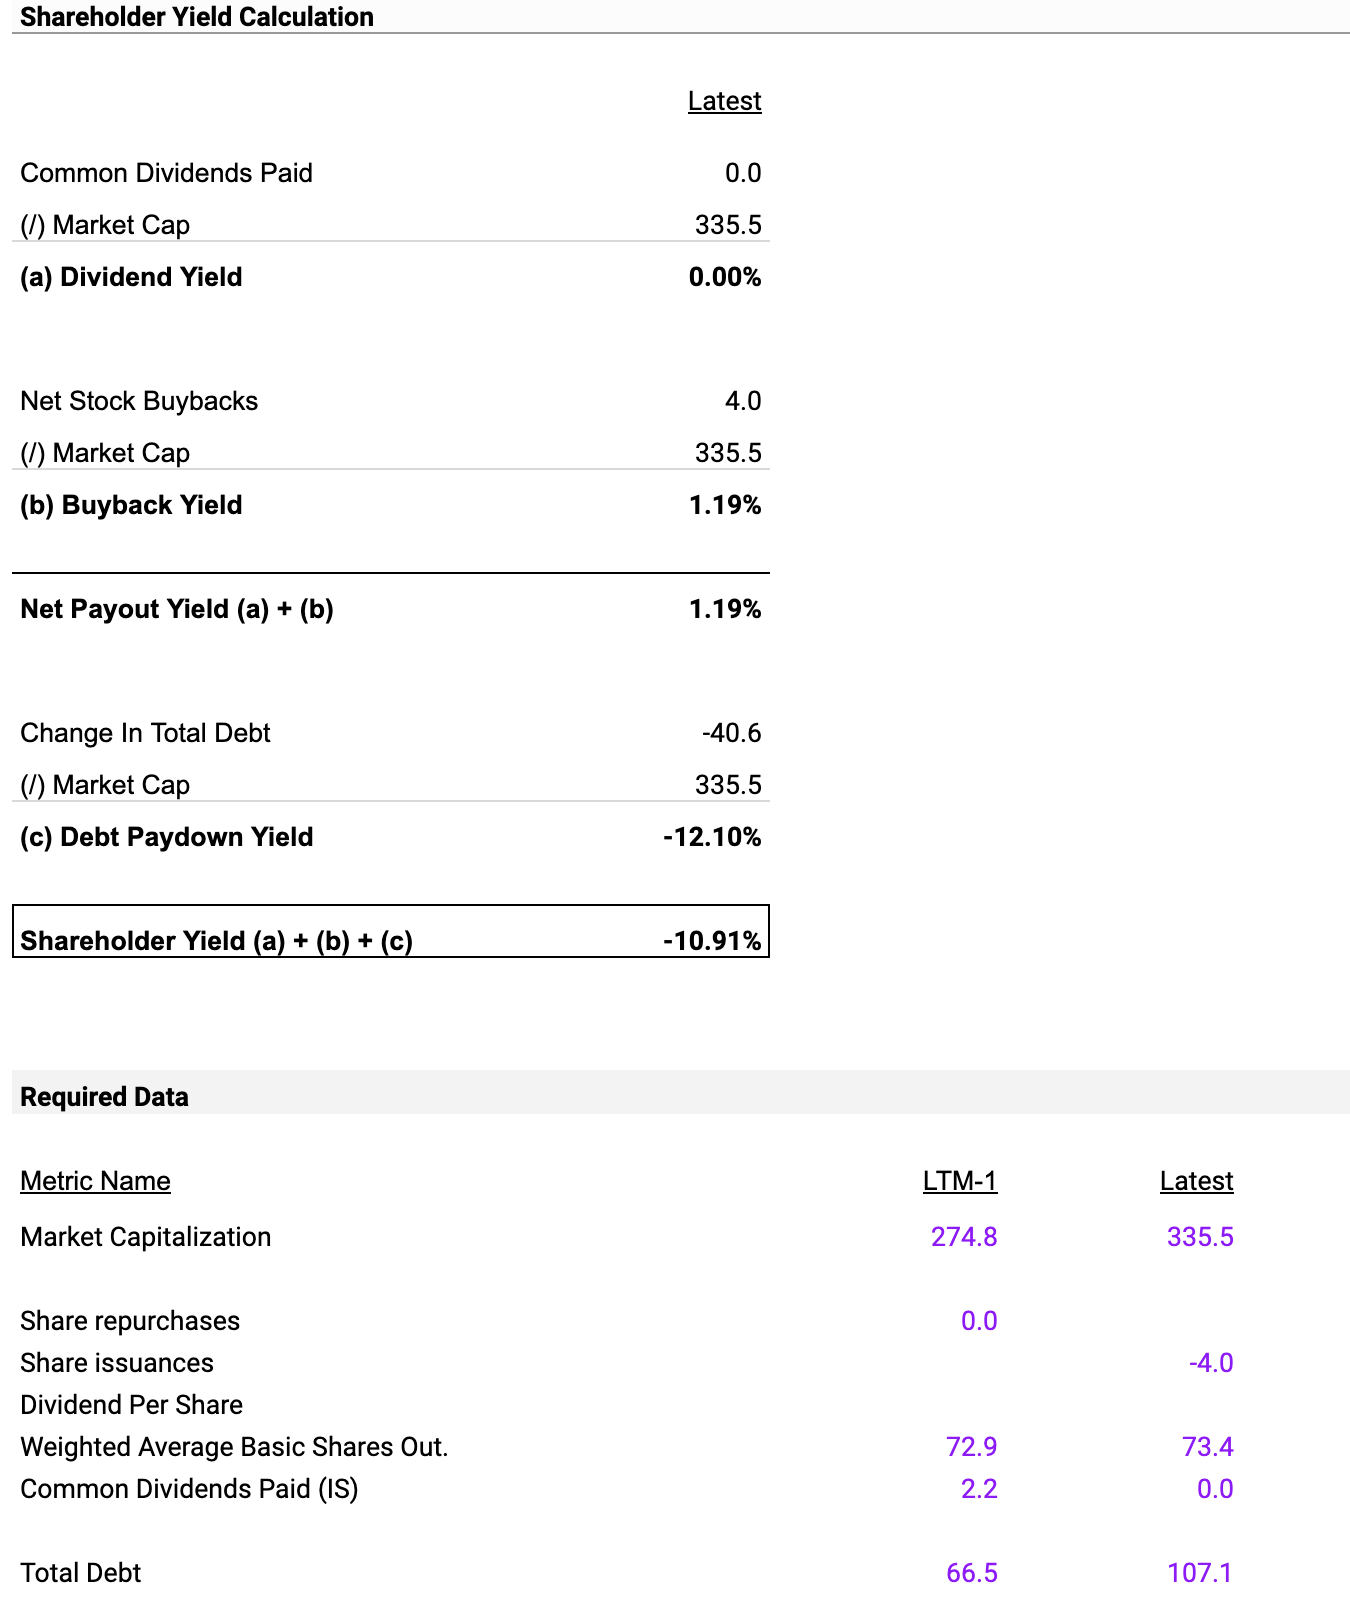
Shareholder Yield
Financial Structure and Investor Returns: A Detailed Examination
The company does not offer dividends, as indicated by a Dividend Yield of 0.00%, confirming that there are no dividend-based returns for shareholders.
However, the company has bought back $4.0 million worth of its own shares, leading to a Buyback Yield of 1.19%. Considering both the Dividend and Buyback Yields, the overall Net Payout Yield stands at 1.19%.
Managing Debt: A Bold Approach and What It Means
Notably, Alto Ingredients has reduced its total debt by $40.6 million. When compared to its market value, this results in a Debt Paydown Yield of -12.10%, indicating an aggressive strategy for reducing debt.
Total Returns to Shareholders: A Combined View
The overall Shareholder Yield, which includes Dividend Yield, Buyback Yield, and Debt Paydown Yield, is -10.91%.
Guidance for Well-Informed Investors
Share Buybacks and Valuation: A positive Buyback Yield of 1.19% could suggest that the stock is undervalued. This should be carefully considered in relation to broader market conditions.
Discounted Cash Flow Valuation
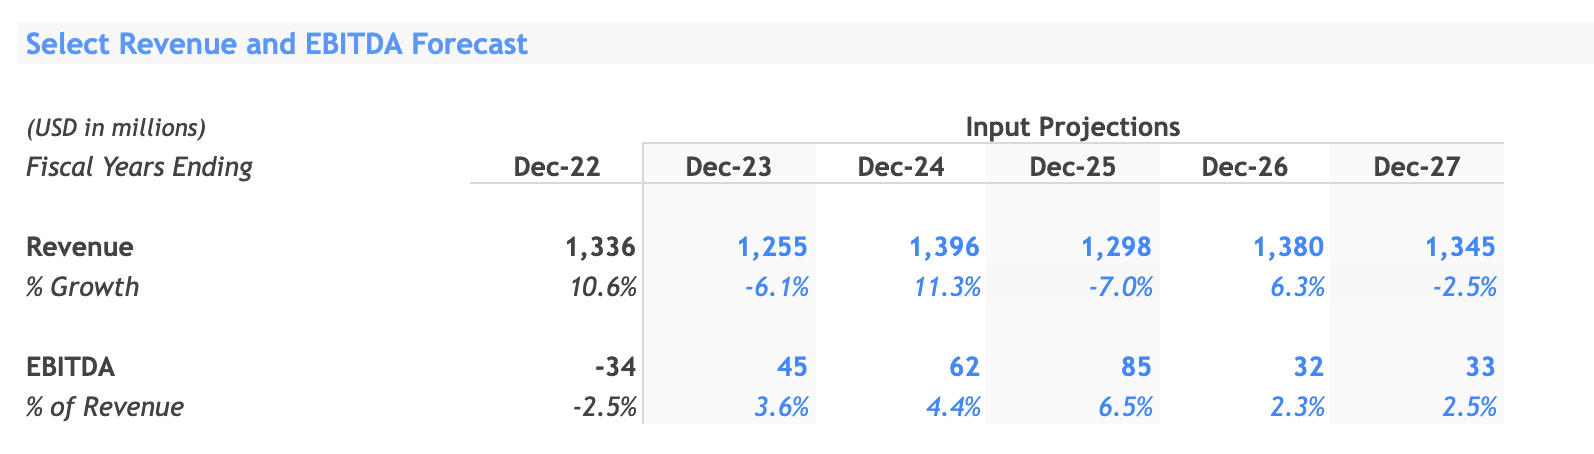
Volatility in Revenue and Margins: A Double-Edged Sword
Unlike models that show consistent growth, Alto Ingredients' revenue growth rates fluctuate, rising and falling in a pattern similar to a sine curve.
EBITDA Margins: A Cautionary Tale
The EBITDA margins, a measure of how efficiently the company is operating, are expected to increase until 2025 and then decline. I predict that EBITDA will become positive due to a combination of high commodity prices and better cost structure.
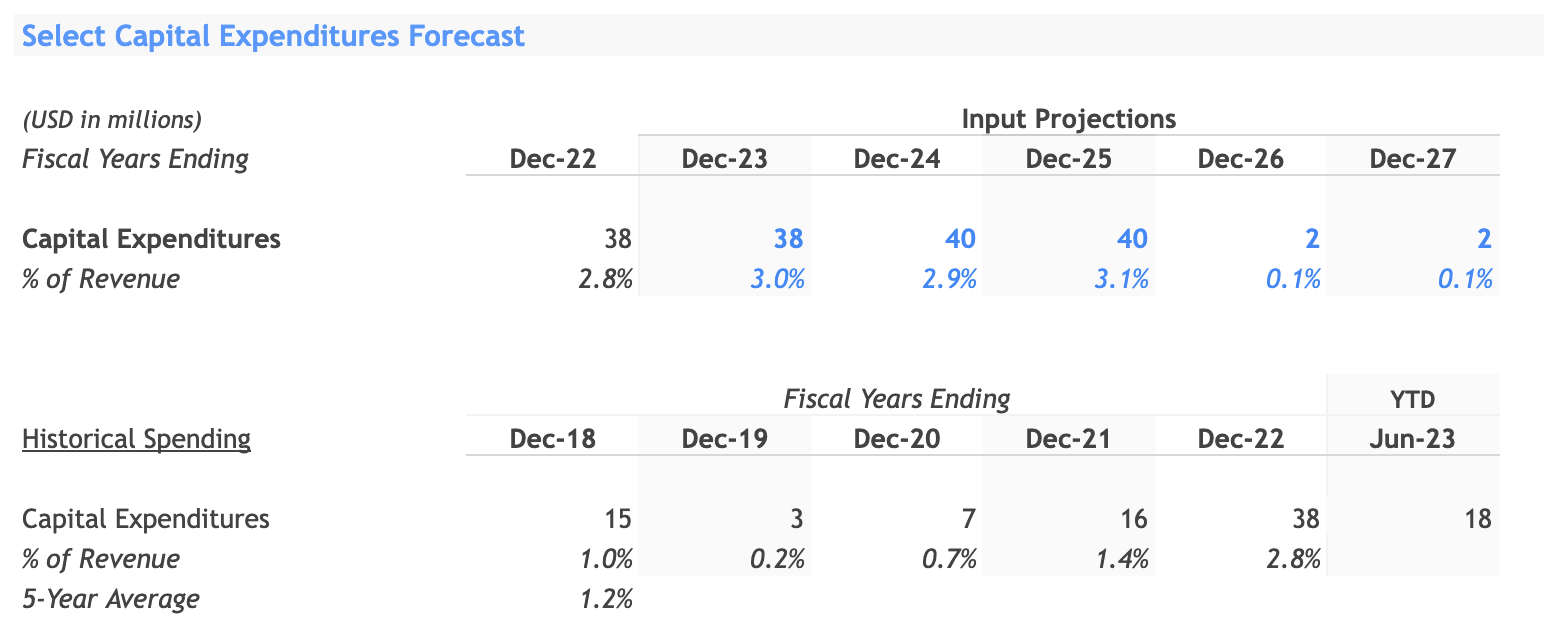
Capital Allocations: A Lens into Strategy
Capital expenditures remain notably stable, fluctuating minimally between $38 million and $40 million until 2025.
The proportion of capital expenditures to revenue is fairly consistent, ranging from 2.8% to 3.1% through 2025.
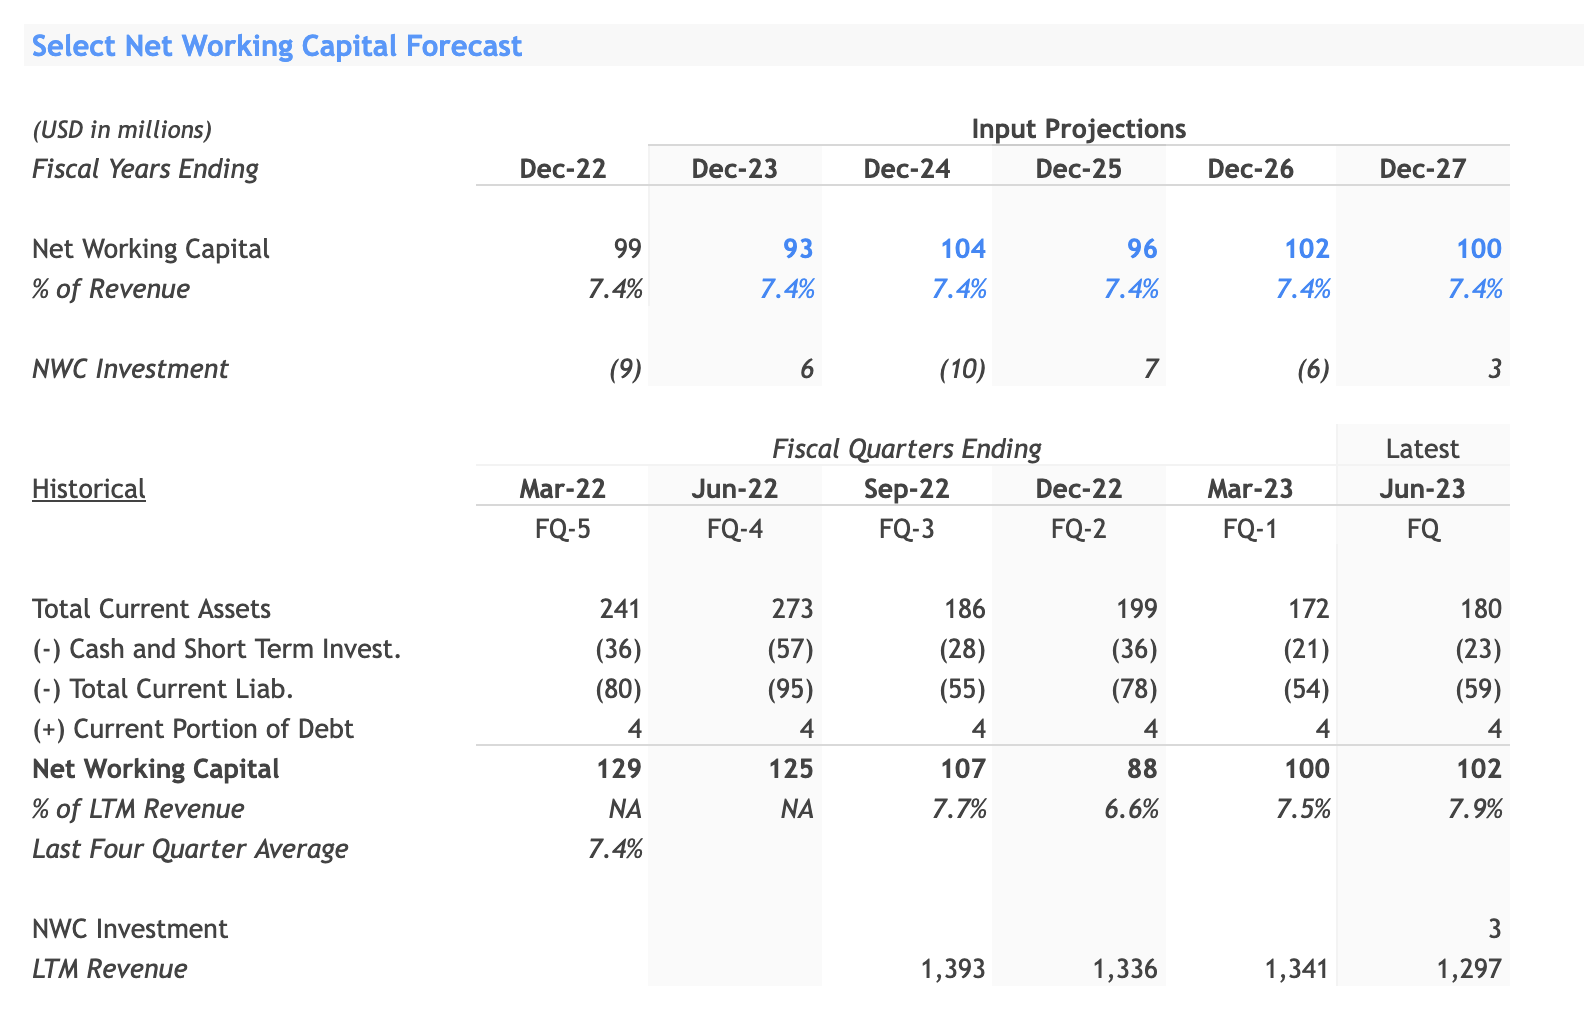
Operational Liquidity: The Net Working Capital Dynamic
The company's Net Working Capital, has been changing between $88 million and $129 million in the last few quarters. These ups and downs could be due to things like seasonal sales changes or specific events that affect how much cash is on hand.
If we average this out over the past four quarters, the Net Working Capital as a percentage of the revenue from the last twelve months comes to 7.4%. This gives us a more consistent idea of the company's ability to cover its short-term debts.
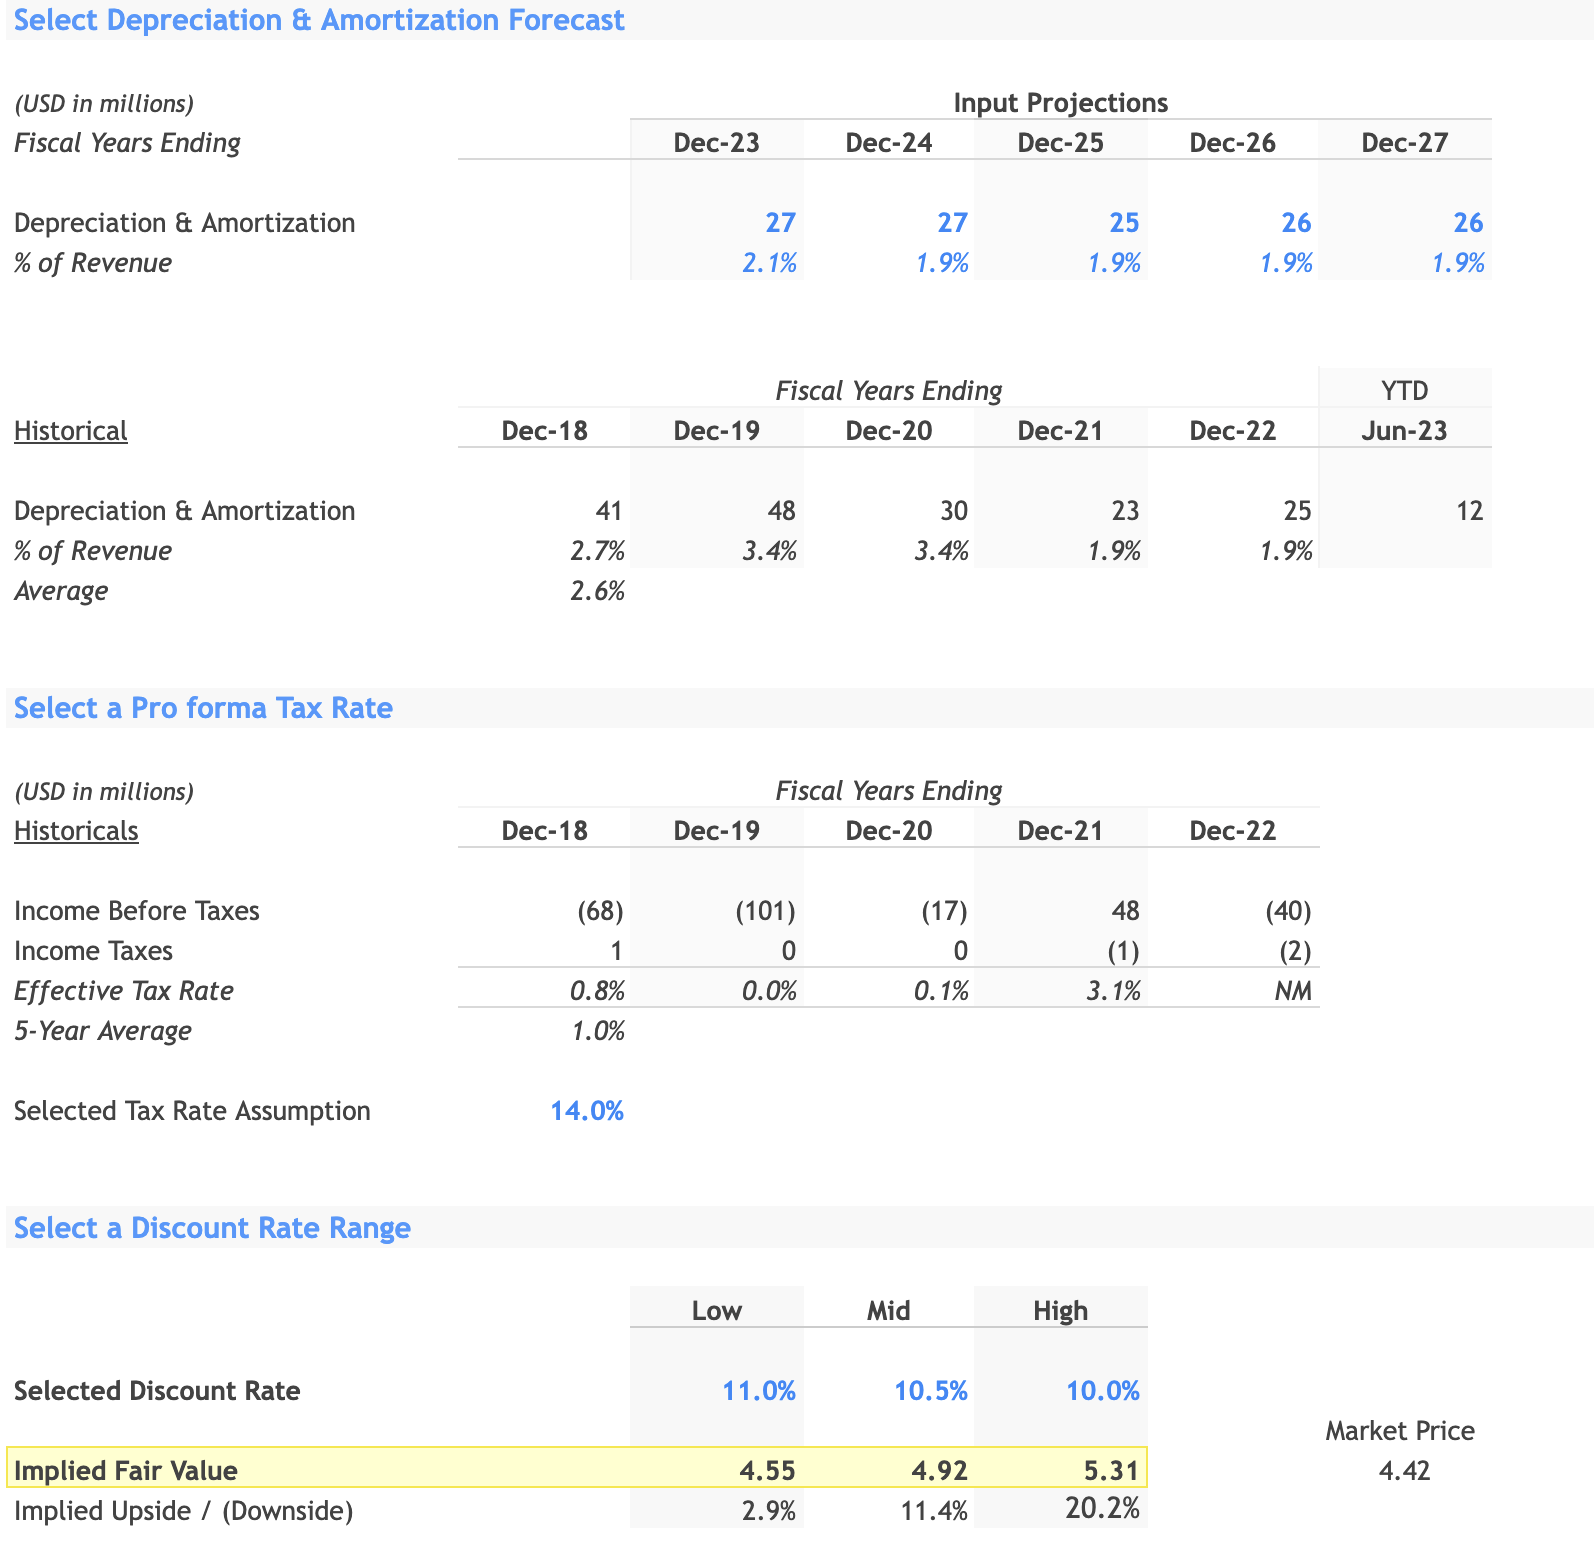
Asset Management: The Depreciation and Amortization Factor
The costs related to Depreciation and Amortization, which track how the value of assets decreases over time, are expected to range from $25 million to $27 million. These costs take up between 1.9% and 2.1% of the company's total revenue.
Taxation: A Regulatory Lens
The company's Effective Tax Rate is expected to stabilize at about 14%, up from a past average of roughly 1%. This change could have a major effect on earnings in the future.
Discount Rate: The Time Value of Money
The chosen Discount Rate, which varies between 10.0% and 11.0%, is in line with the typical Weighted Average Cost of Capital seen in the food and beverage industry.
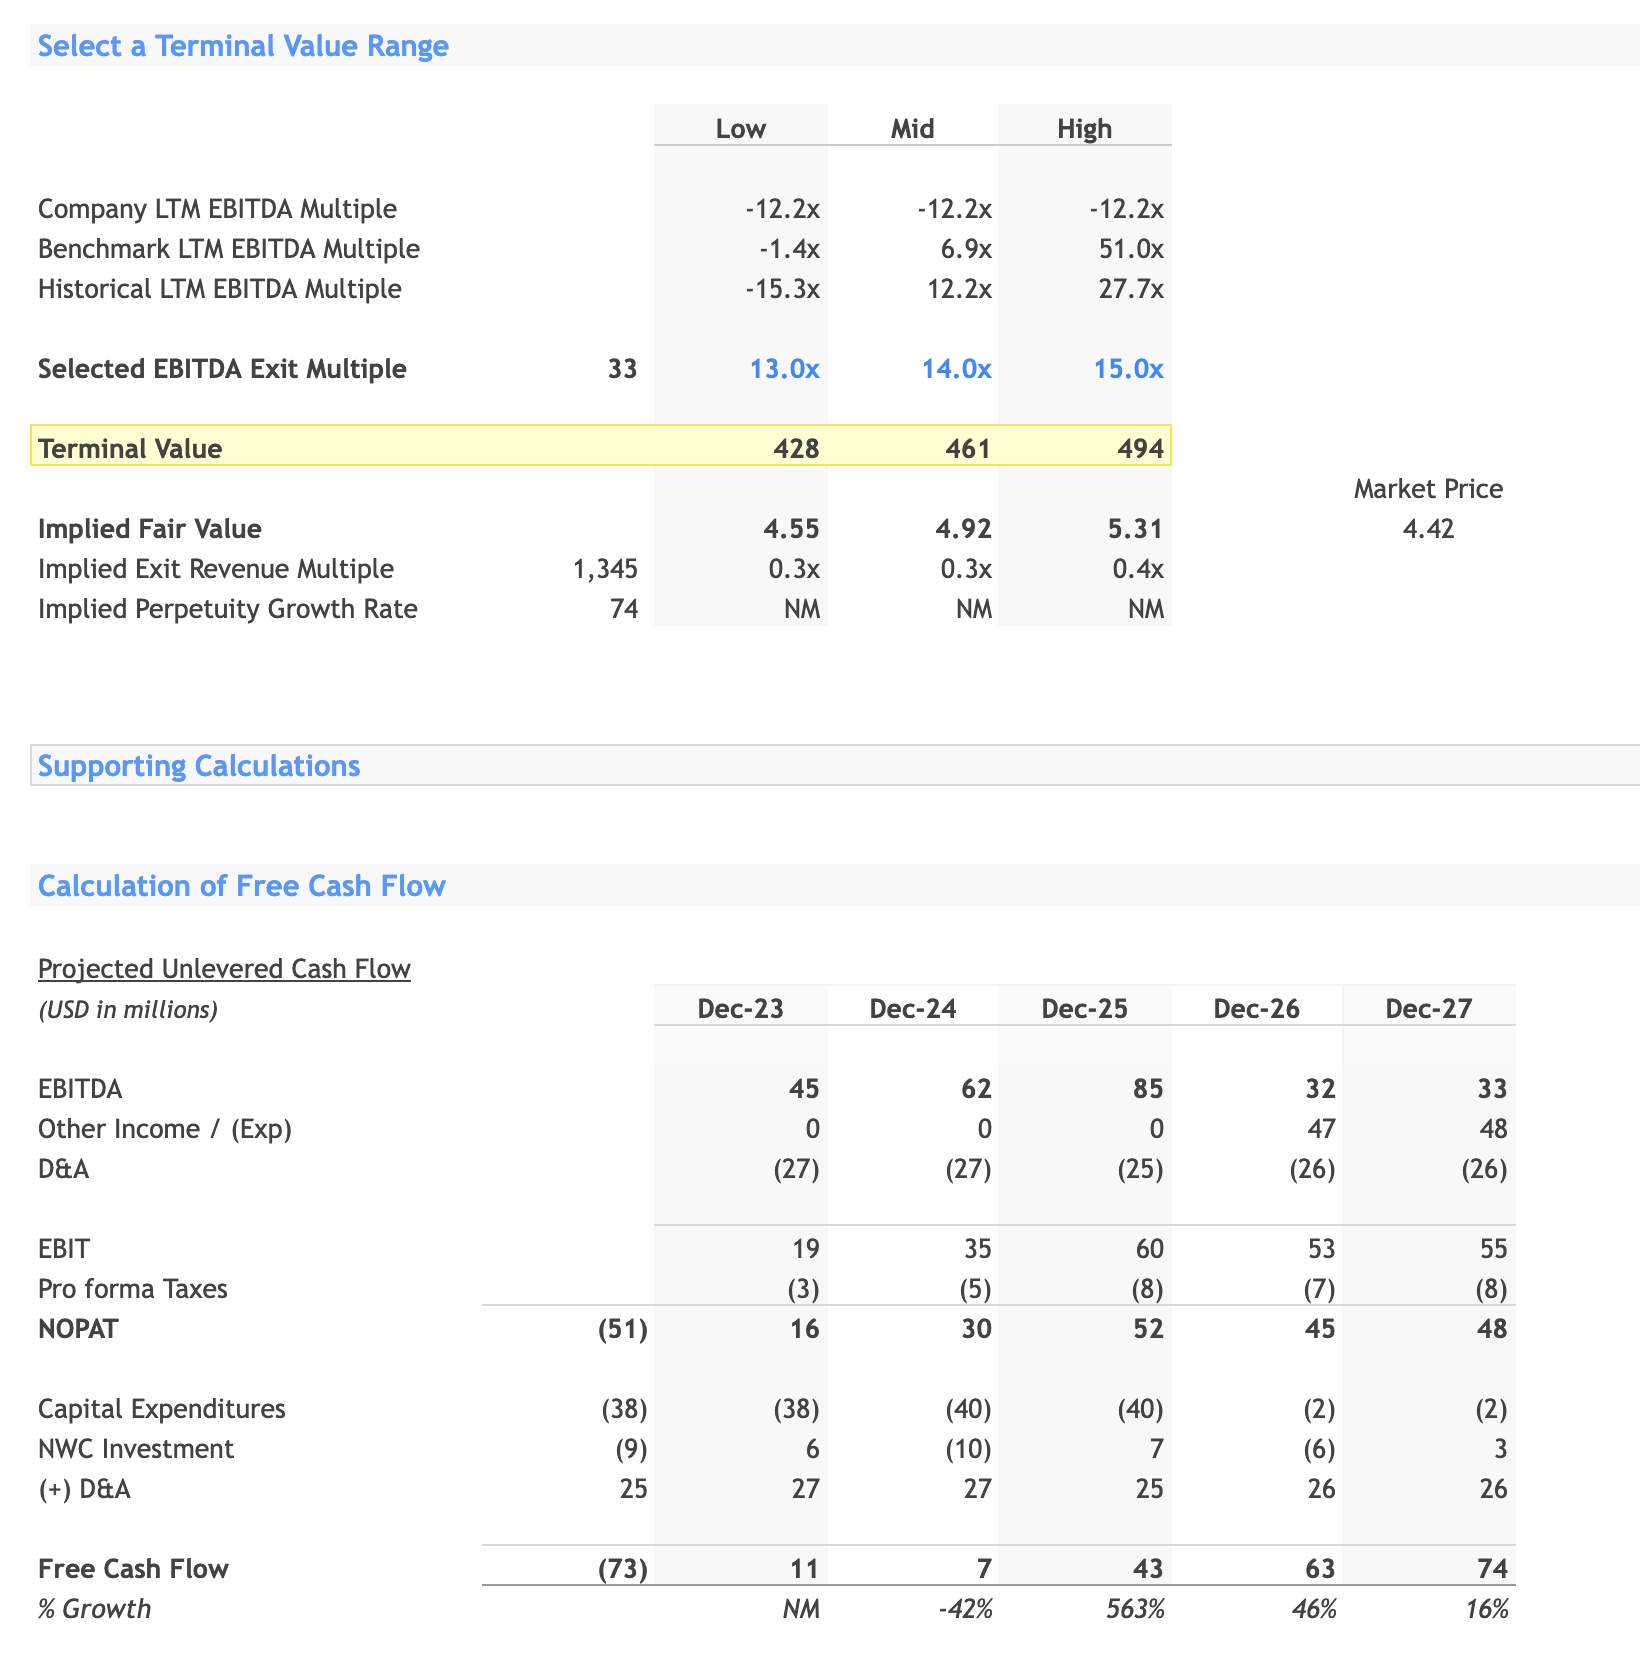
LTM EBITDA Multiple: Assessing Business Health
A LTM negative EBITDA multiple of -12.2x raises concerns, indicating that the company's ability to generate profit doesn't match its current market value.
Benchmark and Past Long-Term EBITDA Multiples: Context Is Important
These multiples serve as a guide, offering industry standards and the company's past multiples for side-by-side comparison. The wide range of multiples from -1.4x to 51.0x could indicate either market instability or inconsistent company performance.
Free Cash Flow: A Measure of Available Cash
Free Cash Flow shows how much cash a company has left after covering its operating costs and capital spending. The Free Cash Flow swings between $15 million and $74 million from 2023 to 2027.
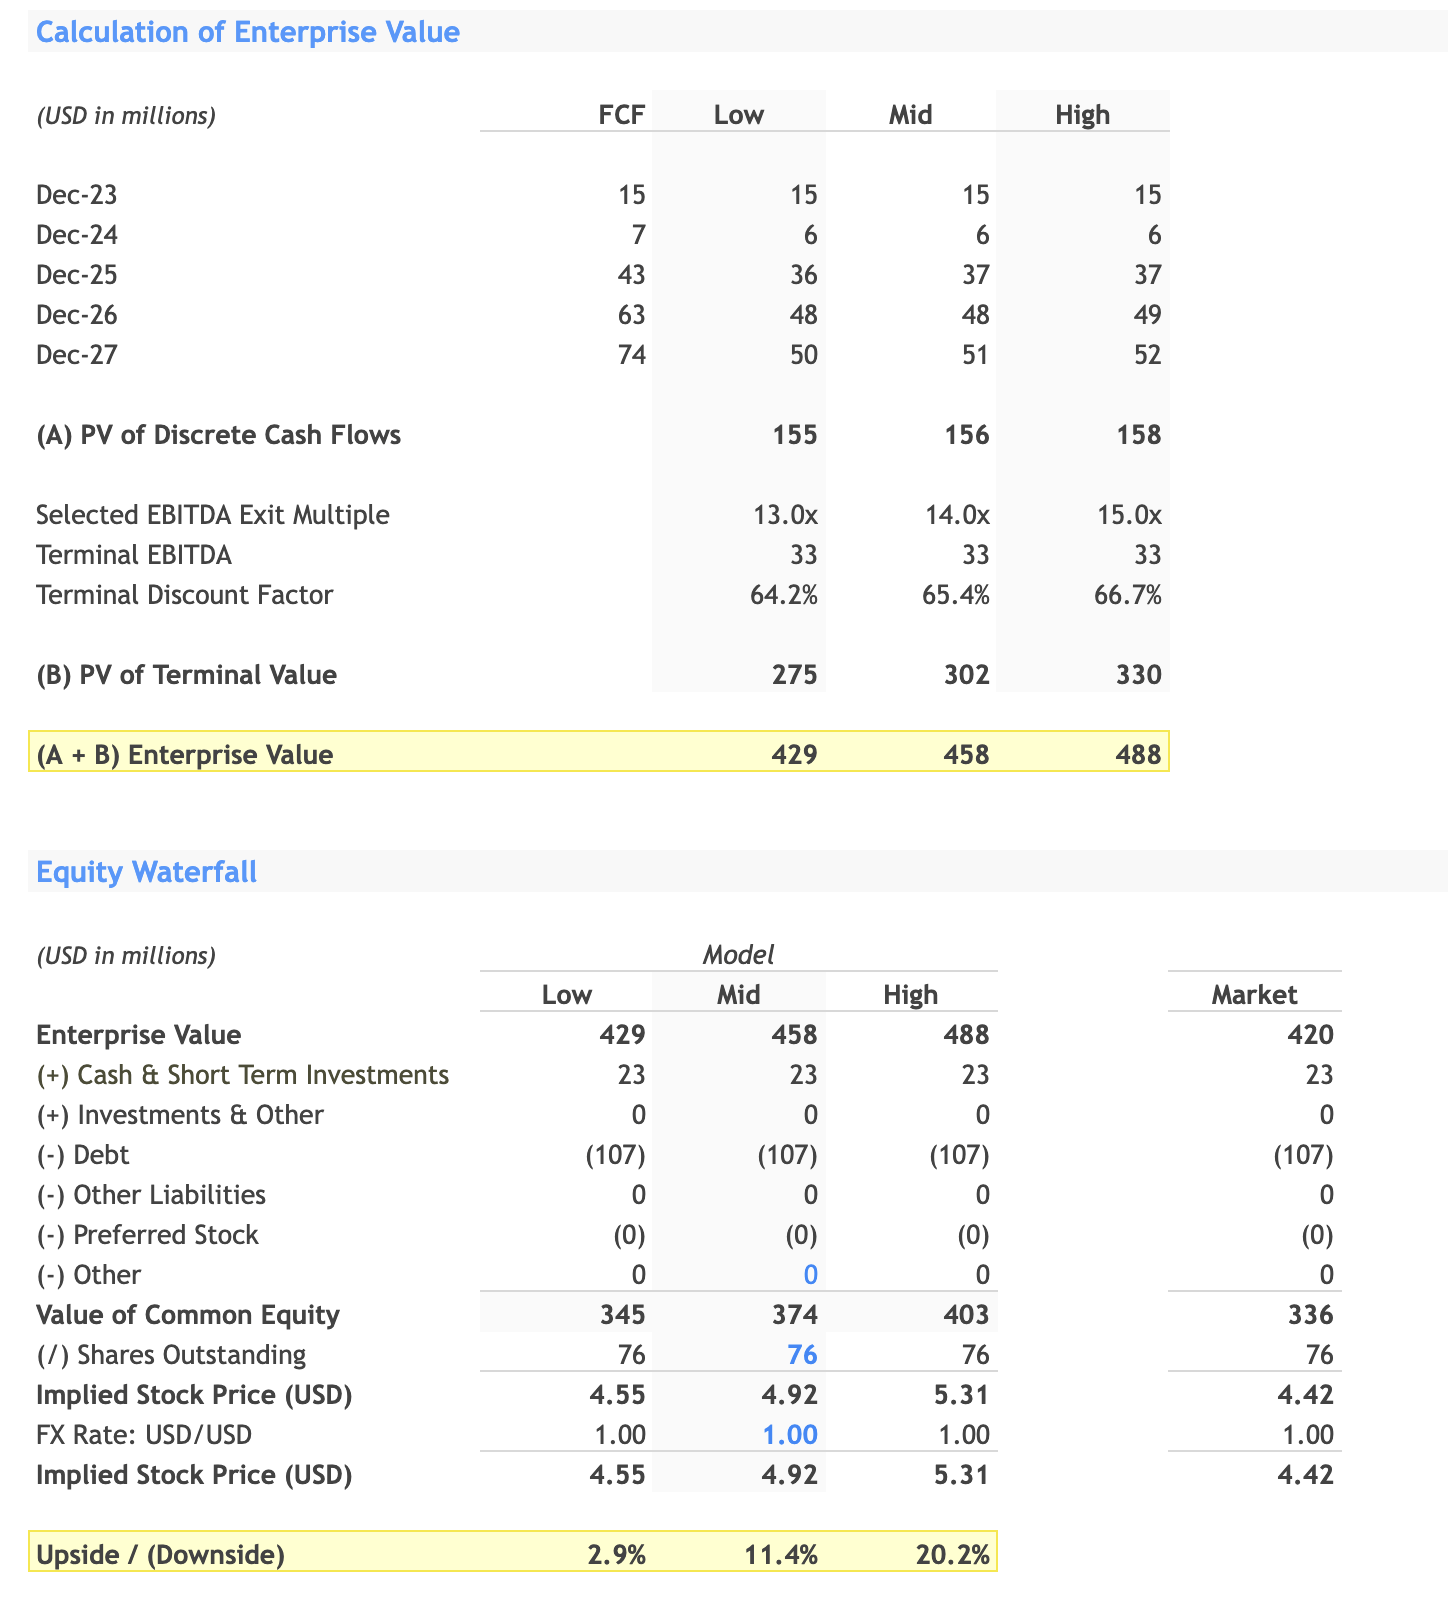
Value of Future Cash Now: Present Value of Discrete Cash Flows
This figure estimates future free cash flows' current worth, ranging from $155 to $158 million.
Future Company Value: EBITDA Exit Multiple
This multiple, ranging from 13.0x to 15.0x, is key in figuring out the Terminal Value, which predicts the company's worth at the end of the forecast period.
Discounted Future Worth: Present Value of Terminal Value
This gives us an estimate of the company's value at the end of the forecast, discounted back to today's dollars. Projections range from $275 to $330 million.
Complete Company Worth: Enterprise Value
Enterprise Value is an all-encompassing measure of the company's worth, including debt and equity but subtracting out cash. Projected values fall between $429 and $488 million.
Shareholder Value: Value of Common Equity
After considering debt and cash, this shows the value that belongs to regular shareholders. Estimates go from $345 to $403 million.
Predicted Stock Price: Implied Stock Price
This is the estimated stock price according to the financial model, ranging between $4.55 and $5.31, compared to the current market price of $4.42.
Key Points for Decision-Making:
The projected Enterprise Value is higher than the current market value, suggesting the company might be undervalued. The Implied Stock Price suggests a growth potential of up to 20.2%, making it an investment opportunity to potentially consider based on this.
Investment Recommendation
My research indicates that the company's financials are a bit of a rollercoaster, with revenues, EBITDA, and operating costs all over the place. However, there are some silver linings, like promising forecasts for future free cash flow and signs that the stock might actually be worth more than its current price.
Given the mix of good and bad, it might be wise to simply hold onto your shares of Alto Ingredients for now. This "Hold" approach allows you to dodge any immediate financial hits and keep a watchful eye for any game-changing updates that might make you want to either buy more shares or sell what you have. This strategy could be particularly useful, as the company is predicted to generate solid free cash flow after 2025
For further details see:
Alto Ingredients, Inc.: A Case For A 'Hold' Strategy