PYPL - American Express: Travel Driving Growth
Summary
- American Express Company is riding the secular trend of post-pandemic travel, as total global travel revenue has grown by 45.1% (2021) and 48.0% (2022) and has yet to reach pre-pandemic levels.
- We believe there is a huge opportunity for American Express to expand internationally, which would contribute positively to network volume growth and boost discount revenues.
- By targeting the international demographic of the Millennial Generation and Gen Z, which is around 55% of the population, we believe American Express is better positioned to gain market share.
In this analysis of American Express Company (AXP), we emphasized the reasons behind the substantial year-over-year growth observed among Card Network companies, which are projected to experience double-digit growth in the future as compared to other fintech companies. We examined the impact of the resurgence in Travel & Entertainment expenditure on American Express' profitability, and the company's strategy to tap into international customers as a new source of growth. Furthermore, we delved into the other factors that are driving consumer spending.
| Company |
| TTM Revenue ($ mln) |
| Revenue Growth YoY % |
| Q3 % Analyst Revenue Difference |
| Stock Price Change (Q4 2022) |
| Q4 Guidance |
| Types |
| American Express |
| 50,831 |
| 24.0% |
| -0.1% |
| 9.20% |
| 24.0% |
| Card Network |
| Visa ( V ) |
| 29,310 |
| 18.7% |
| 3.1% |
| 17.12% |
| 18.0% |
| Card Network |
| Mastercard ( MA ) |
| 21,640 |
| 15.5% |
| 1.7% |
| 22.46% |
| 17.0% |
| Card Network |
| PayPal Holdings ( PYPL ) |
| 27,057 |
| 10.8% |
| 0.4% |
| -18.02% |
| 9.0% |
| Payment Facilitators |
| Block Inc ( SQ ) |
| 16,964 |
| 17.6% |
| 1.1% |
| 14.42% |
| 19.0% |
| Payment Facilitators |
| Fiserv ( FISV ) |
| 17,115 |
| 2.6% |
| 0.0% |
| 8.47% |
| 11.0% |
| Merchant Acquiring |
| FIS ( FIS ) |
| 14,483 |
| 2.7% |
| -0.3% |
| -10.22% |
| 6.5% |
| Merchant Acquiring |
| Global Payments ( GPN ) |
| 8,691 |
| -6.5% |
| 1.0% |
| -8.08% |
| 10.5% |
| Merchant Acquiring |
| Intuit Inc ( INTU ) |
| 13,319 |
| 29.5% |
| 3.8% |
| 0.49% |
| 11.0% |
| Financial & Accounting Software |
| Lufax Holding ( LU ) |
| 10,652 |
| -25.5% |
| -7.6% |
| -23.62% |
| -7.0% |
| Online Lending |
| Average |
| 9.0% |
| 0.31% |
| 1.22% |
| 11.90% |
Source: Seeking Alpha, Khaveen Investments.
In our previous coverage of Lufax, we mentioned that Card Network providers had an average revenue growth of 19.4% YoY, higher than the top 10 companies' average of 9% and the highest among all the fintech types. For Visa and Mastercard, we attributed its revenue growth to the growth of cross-border transactions which make up about 33% of Visa's revenue. For American Express, we will see how it leverages the Travel & Entertainment industry to achieve a record profit in 2022.
| American Express Total Revenue Net of Interest Expense ($ mln) |
| 2020 |
| 2021 |
| 2022 |
| Average |
| US Consumer Services |
| 16,347 |
| 18,922 |
| 23,914 |
| Growth % |
| 15.8% |
| 26.4% |
| 21.1% |
| US Commercial Services |
| 9,234 |
| 10,911 |
| 13,569 |
| Growth % |
| 18.2% |
| 24.4% |
| 21.3% |
| International Card Services |
| 6,742 |
| 7,435 |
| 9,061 |
| Growth % |
| 10.3% |
| 21.9% |
| 16.1% |
| Global Merchant and Network Services |
| 4,309 |
| 5,129 |
| 6,475 |
| Growth % |
| 19.0% |
| 26.2% |
| 22.6% |
| Corporate & Other |
| (552) |
| (23) |
| (156) |
| Total Revenue |
| 36,080 |
| 42,374 |
| 52,863 |
| Growth % |
| -17.2% |
| 17.4% |
| 24.8% |
| 21.1% |
Source: Company Data , Khaveen Investments.
Travel and Entertainment Spending Drives Revenue
| American Express Billed Services Spending Volumes ($ bln) |
| 4Q2021 |
| 1Q2022 |
| 2Q2022 |
| 3Q2022 |
| 4Q2022 |
| Average |
| Goods & Services |
| 250 |
| 229 |
| 252 |
| 250 |
| 270 |
| Growth % |
| -8.4% |
| 10.0% |
| -0.8% |
| 8.0% |
| 2.2% |
| Travel & Entertainment |
| 65 |
| 70 |
| 88 |
| 88 |
| 87 |
| Growth % |
| 7.7% |
| 25.7% |
| 0.0% |
| -1.1% |
| 8.1% |
Source: Company Data, Khaveen Investments.
From the table above, while the company's spending volumes from Goods & Services is roughly more than 3 times than that of its Travel & Entertainment segment, the Travel & Entertainment segment was its main growth driver in 2022, with an 8.1% average growth rate compared to 2.2% for Goods & Services volumes.
| American Express Network Volumes Growth YoY % |
| 3Q2021 |
| 4Q2021 |
| 1Q2022 |
| 2Q2022 |
| 3Q2022 |
| 4Q2022 |
| 2022 Average |
| Goods & Services |
| 18% |
| 19% |
| 19% |
| 15% |
| 13% |
| 7% |
| 14% |
| Travel & Entertainment |
| 126% |
| 130% |
| 119% |
| 80% |
| 52% |
| 34% |
| 71% |
| Airline-Related |
| 429% |
| 271% |
| 241% |
| 142% |
| 110% |
| 62% |
| 139% |
Source: Company Data, Khaveen Investments.
Moreover, YoY comparisons show that Airline-Related expenditures on American Express card networks had the highest growth, averaging 139% YoY in 2022. This is followed by Travel & Entertainment and Goods & Services with an average YoY growth of 71% and 14% respectively in 2022.
Consumers are incentivized to use cards as they are much more convenient, provide fraud protection, and most importantly earn rewards which usually come in the form of air miles or cashback for their next plane ticket or hotel stay. Consumers tend to get better exchange rates from their cards too when overseas as compared to withdrawing from ATMs overseas.
"Some cards can even earn better award rates for your expenditures overseas or for your travel bookings," as mentioned by ValueChampion, thus we see the high growth of consumers using cards for travel-related expenses.
| Global Consumer Expenditure |
| 2019 |
| 2020 |
| 2021 |
| 2022 |
| 2023F |
| 2024F |
| 2025F |
| Total Retail Sales (tln) |
| 24.45 |
| 23.74 |
| 26.03 |
| 27.34 |
| 28.64 |
| 30.03 |
| 31.27 |
| Growth % |
| -2.9% |
| 9.6% |
| 5.0% |
| 4.8% |
| 4.9% |
| 4.1% |
| Total Travel Revenue (bln) |
| 720.2 |
| 296.9 |
| 430.8 |
| 637.6 |
| 755.9 |
| 855.4 |
| 924.3 |
| Growth % |
| 0.2% |
| -58.8% |
| 45.1% |
| 48.0% |
| 18.6% |
| 13.2% |
| 8.1% |
Source: Statista , InsiderIntelligence , Khaveen Investments.
We believe American Express is riding the secular trend of post-pandemic travel. As seen from the table above, total global travel revenue has grown by 45.1% and 48.0% in 2021 and 2022, respectively, and has yet to reach pre-pandemic levels. Total global retail sales, on the other hand, recorded a growth rate of only 9.6% and 5.0%, respectively in 2021 and 2022. Travel revenue is expected to grow at an average of 13.3% over the next 3 years, whereas total retail sales are expected to grow at an average of 4.6%.
Company Data, Khaveen Investments
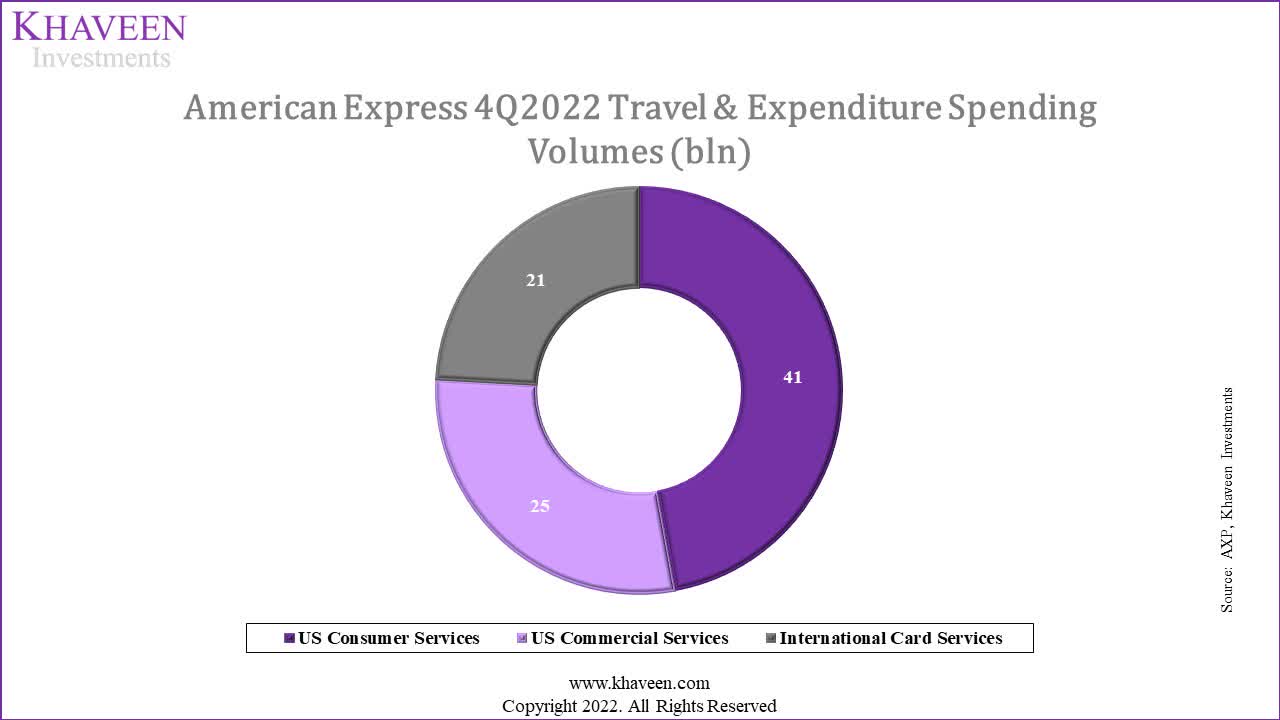
With Travel & Entertainment expenditure making up about a quarter of total transaction volumes under Billed Services, it is surprising that for 2022, non-interest revenues for U.S. Consumer Services, Commercial Services and International Card Services have increased by 27%, 24% and 22%, respectively. This is because the U.S. reopened in 2021, compared to many international countries which reopened from the middle to end of 2022. Thus, we should see the highest growth from international countries.
In conclusion, based on our analysis of American Express' total revenues above, we can see that its total revenue growth was 17.4% in 2021 and 24.8% in 2022, which was in the upper range of management's expectation of between 23 to 25%.
International Card Services Growth Lowest Among 3 Segments
| American Express Total Revenues Net of Interest Expense ($ mln) |
| 2016 |
| 2017 |
| 2018 |
| 2019 |
| Average |
| U.S. |
| 26,339 |
| 27,187 |
| 29,864 |
| 32,629 |
| Growth % |
| 3.2% |
| 9.8% |
| 9.3% |
| 7.4% |
| EMEA |
| 3,570 |
| 3,927 |
| 4,419 |
| 4,388 |
| Growth % |
| 10.0% |
| 12.5% |
| -0.7% |
| 7.3% |
| APAC |
| 3,275 |
| 3,464 |
| 3,656 |
| 3,934 |
| Growth % |
| 5.8% |
| 5.5% |
| 7.6% |
| 6.3% |
| LACC (Americas excluding the US) |
| 2,360 |
| 2,505 |
| 2,584 |
| 2,776 |
| Growth % |
| 6.1% |
| 3.2% |
| 7.4% |
| 5.6% |
| Others |
| (106) |
| (205) |
| (185) |
| (171) |
| Total |
| 35,438 |
| 36,878 |
| 40,338 |
| 43,556 |
| Growth % |
| 4.1% |
| 9.4% |
| 8.0% |
| 7.1% |
Source: Company Data, Khaveen Investments.
Based on company data, its 3-year average pre-pandemic revenue growth for the U.S. was 7.4%, closely followed by EMEA at 7.3% and APAC at 6.3%. This is followed by LACC with revenue growth of 5.6%. From our analysis, we can see that U.S. revenue growth was the highest, which is contrary to what management stated that its "international businesses were among the fastest-growing prior to the pandemic."
| American Express Non-Interest Revenue ($ mln) |
| 2020 |
| 2021 |
| 2022 |
| U.S. Consumer Services |
| 10,125 |
| 12,989 |
| 16,440 |
| Growth % |
| 28.3% |
| 26.6% |
| U.S. Commercial Services |
| 8,210 |
| 9,833 |
| 12,196 |
| Growth % |
| 19.8% |
| 24.0% |
| International Card Services |
| 5,877 |
| 6,761 |
| 8,262 |
| Growth % |
| 15.0% |
| 22.2% |
Source: Company Data, Khaveen Investments.
In addition to our pre-pandemic data, we can see that U.S. Consumer and Commercial Services non-interest revenue growth are at 26.6% and 24.0%, respectively, which is greater than International Card Services at 22.2%.
(Management) sees tremendous opportunities for growth in key regions despite ongoing macroeconomic geopolitical uncertainties (and thus) made an organizational change a few months ago to help seize on these opportunities (to) achieve our long-term growth plan aspirations of revenue growth in excess of 10%. - Steve Squeri , Chairman & Chief Executive Officer.
| American Express Network Volumes Growth YoY % |
| 3Q2021 |
| 4Q2021 |
| 1Q2022 |
| 2Q2022 |
| 3Q2022 |
| 4Q2022 |
| Average |
| US Consumer Services |
| 37% |
| 37% |
| 38% |
| 27% |
| 22% |
| 15% |
| 29% |
| U.S. Commercial Services |
| 28% |
| 39% |
| 31% |
| 27% |
| 20% |
| 11% |
| 26% |
| International Card Services |
| 27% |
| 28% |
| 33% |
| 29% |
| 21% |
| 14% |
| 25% |
| Total Billed Business |
| 31% |
| 32% |
| 34% |
| 27% |
| 21% |
| 13% |
| 26% |
Source: Company Data, Khaveen Investments.
Within the past 6 quarters, International Card Services grew 25% on average in network volumes, slightly below U.S. Consumer and Commercial Services growth YoY. As a result, we believe that American Express is not only focusing on international markets to capture Travel & Entertainment sales but for the long-term growth opportunity that is yet to be seen based on past growth.
| Region |
| 2021 Population (mln) |
| Card Holders (mln) |
| Card Penetration |
| U.S. |
| 331.9 |
| 221.4 |
| 66.7% |
| EMEA |
| 884.1 |
| 203.0 |
| 23.0% |
| APAC |
| 4711.3 |
| 874.4 |
| 18.6% |
| LACC |
| 698.3 |
| 133.7 |
| 19.1% |
Source: Statista , Data Commons , Global Economy , Khaveen Investments.
From the table above, we can see that the card penetration rate in the U.S. is substantially higher than the other reportable regions based on American Express' 2021 annual report. As a result, we believe that the U.S. card market is highly saturated and internationally there are much more opportunities to expand in APAC, especially where there are about 4.7 bln people. The penetration rate of Card Holders internationally is 22.26% which is much lower compared to the U.S. thus boasting huge opportunities for American Express to expand internationally. RBR, a retail bank research consultancy, forecasted the "value of card payments will reach $45 tln by 2023" with "50% of global card expenditure taking place in Asia Pacific."
Overall, we believe there is a huge opportunity for American Express to expand internationally which would contribute positively to network volume growth and boost discount revenues. Discount revenues, which represented 60.7% of total revenue in 2021, are recorded as the...
fee earned on transactions occurring at merchants that have entered into a card acceptance agreement with American Express - American Express Annual Report.
Consumer Spending Driven by Take Rates, Spending Volumes, and the Younger Generation
| American Express Total Revenue Net of Interest Expense ($ mln) |
| 2020 |
| 2021 |
| 2022 |
| U.S. Consumer Services |
| 16,347 |
| 18,922 |
| 23,914 |
| U.S. Commercial Services |
| 9,234 |
| 10,911 |
| 13,569 |
| International Card Services |
| 6,742 |
| 7,435 |
| 9,061 |
| Global Merchant and Network Services |
| 4,309 |
| 5,129 |
| 6,475 |
| Corporate & Other |
| (552) |
| (23) |
| (156) |
| Total Revenue |
| 36,080 |
| 42,374 |
| 52,863 |
Source: Company Data, Khaveen Investments.
From the table above, we can see that U.S. Consumer Services contributes the highest revenue, representing 45.2% of American Express' revenues. International Consumers represented 64% of International Card Services Volumes in 2022. Thus we believe that consumer spending is likely to contribute to a majority of American Express' revenue and revenue growth. We analyzed the drivers of consumer spending, as management believes that...
millennial and Gen Z customers drove our highest billed business growth within the segment.
| U.S. Consumer Services |
| 2020 |
| 2021 |
| 2022 |
| Proprietary cards-in-force (mln) (a) |
| 37.7 |
| 39.0 |
| 41.7 |
| Growth % |
| 3.4% |
| 6.9% |
| Revenue per card ($) (b) |
| 269 |
| 333 |
| 394 |
| Growth % |
| 24.0% |
| 18.4% |
| Non-interest revenues ($ mln) (c) |
| 10,125 |
| 12,989 |
| 16,440 |
| Growth % |
| 28.3% |
| 26.6% |
| Average proprietary Card Member spending ($) (d) |
| 8,958 |
| 11,390 |
| 13,261 |
| Growth % |
| 27.2% |
| 16.4% |
| Billed business network volumes ($ bln) (e) |
| 338 |
| 444 |
| 553 |
| Growth % |
| 31.5% |
| 24.5% |
| Take rate (f) |
| 3.0% |
| 2.9% |
| 3.0% |
| Growth % |
| -2.5% |
| 1.7% |
*c = a × b, e = a × d, c = e × f
Source: Company Data, Khaveen Investments.
From the table above, U.S. Consumer Services' non-interest revenue had increased from nearly $13.0 bln in 2021 to $16.4 bln in 2022 and the total value of its network volumes increased from $444 bln in 2021 to $553 bln in 2022. This is mainly driven by revenue per card and average proprietary Card Member spending which grew by 18.4% and 16.4% respectively. The take rate on the other hand has remained relatively constant since 2020, with American Express earning about 3 cents on every dollar of consumer spending.
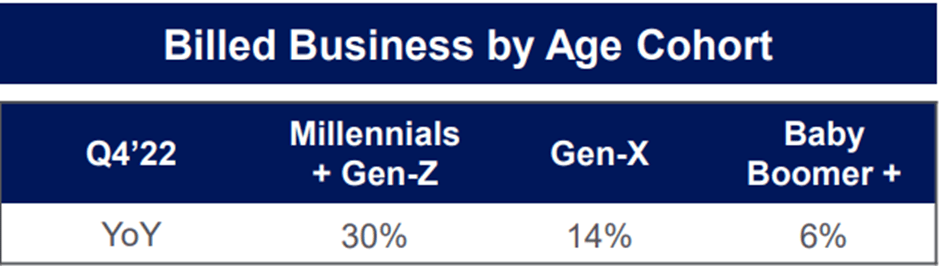
3.3 million new proprietary cards during the quarter (with) Millennial and Gen Z comprising more than 60% of our proprietary consumer card acquisitions in the quarter. - Steve Squeri, Chairman & Chief Executive Officer.
According to the chart above, network volumes spent by the Millennials and Gen-Z were growing the fastest at 30%, compared to Gen-X and Baby Boomer+ with 14% and 6% growth, respectively.
Although concrete steps have not been mentioned by American Express' management to target this audience, Visa has published research projecting that consumers aged 50 and above would be responsible for 52% of total spending by 2025, an increase from 50% in 2015, which might suggest that Visa is looking to cement its dominance among the older generations. Thus, we believe American Express' strategy to target Millennials and Gen-Z is the right move to avoid direct competition and increase market share.
| Population Demographics in 2021 (mln) |
| US |
| % |
| World |
| % |
| Greatest and Silent Generation (born before 1946) |
| 20.0 |
| 6.0% |
| 200 |
| 2.6% |
| The Baby Boomer Generation (born 1946-1964) |
| 70.2 |
| 21.1% |
| 1,100 |
| 14.5% |
| Generation X (born 1965-1980) |
| 65.8 |
| 19.7% |
| 1,400 |
| 18.4% |
| The Millennial Generation (born 1981-1996) |
| 72.2 |
| 21.7% |
| 1,700 |
| 22.4% |
| Generation Z (born 1997-2012) |
| 68.6 |
| 20.6% |
| 2,500 |
| 32.9% |
| Generation Alpha (born after 2012) |
| 36.5 |
| 10.9% |
| 700 |
| 9.2% |
| Total |
| 333.3 |
| 100% |
| 7,600 |
| 100% |
Source: Statista , Schroders , Khaveen Investments.
From the table above, the U.S. age demographic is roughly even across the biggest 4 generations, indicating an aging population that is likely to already own cards from different Card Network providers due to a high card penetration rate of 66.7% as mentioned in the previous point. Thus, by targeting the international demographic of the Millennial Generation and Gen Z which is around 55% of the population, we believe American Express is better-positioned to gain market share, as the global card penetration rate is only 22.3%.
While the Millennials represent the largest group of consumers and the Baby Boomers have the largest buying power, Gen Z's spending power is on the rise. According to a Bloomberg report from last year, young students and professionals command $360 billion in disposable income. - Forbes
In addition to the rising purchasing power of the younger generations, most of them are located in Asia and other emerging markets.
For further details see:
American Express: Travel Driving Growth