ABC - AmerisourceBergen Screams Quality At 15x Earnings 60% ROIC
Summary
- AmerisourceBergen caught a strong bid in the back end of FY22.
- Diving underneath the hood of its earnings reveals strong evidence of outsized profitability, adding to ABC's ability to create future value for shareholders.
- Free cash flow growth of >100% YoY, with $2.7Bn in NOPAT and ROIC of >60% versus a WACC hurdle of ~5.2% are attractive numbers in this regard.
- Net-net, we rate ABC a buy, seeking a price range of $214–$218.
Investment thesis
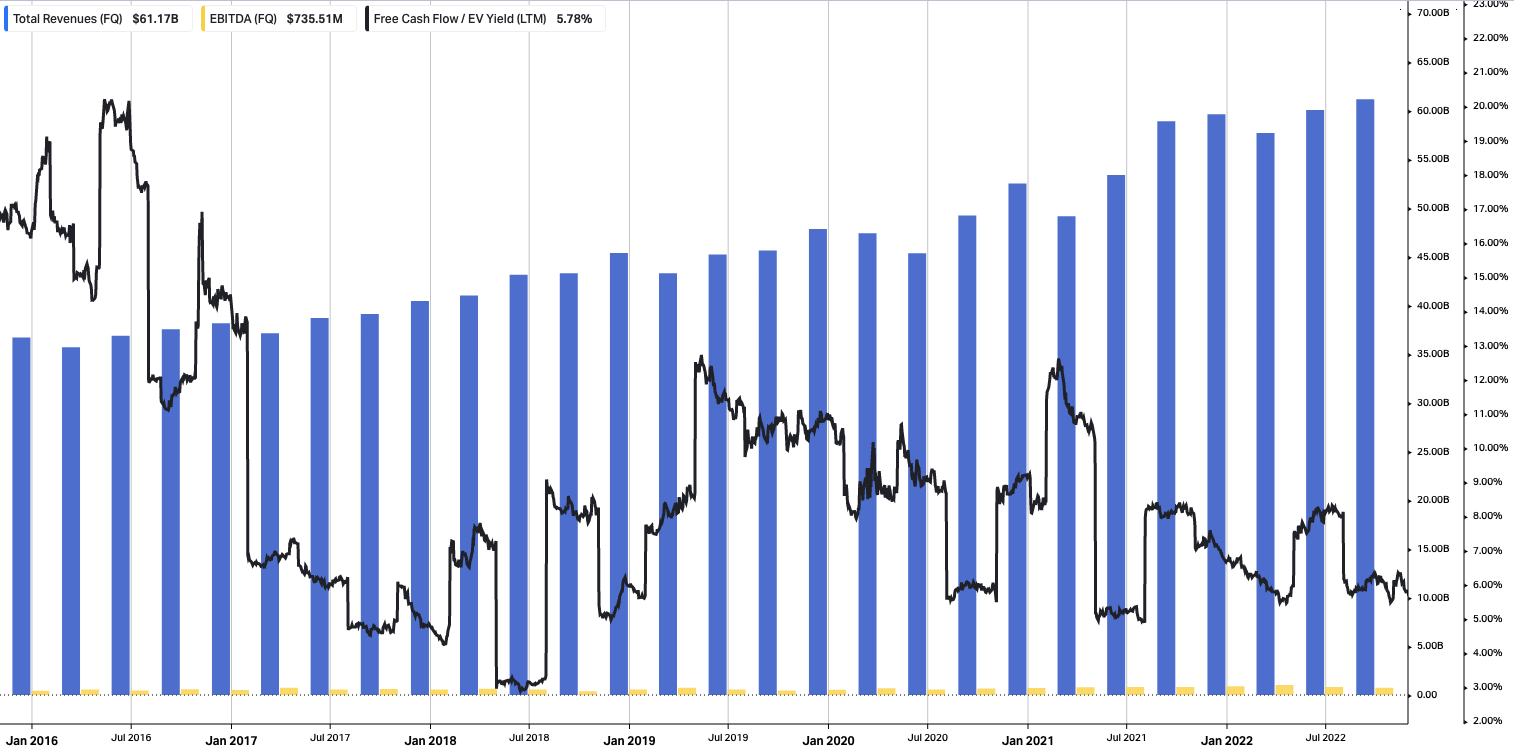
AmerisourceBergen Corporation (ABC) has presented itself as a potential buy following recent capital gains emerging in Q4 of FY22'. Shares have added ~17% over the past 6 months of trade and now trades at an attractive 21% discount to the sector at 15x non-GAAP earnings, and investors can buy ABC at a 5.8% trailing FCF yield. At first glance, ABC's high COGS at 96.5% of revenue might be alarming – it only collected $8.34Bn in gross profit on $238.6Bn in total revenues on core EBITDA of $735mm in FY22' [Exhibit 1]. However, these percentages aren't out of synch with gross margins in the medical distribution industry. Moreover, we'd argue this is also a large barrier to entry for competing names, especially new market entrants. Here, through a series of visuals, I'll show that we need to get under the hood with ABC in order to extract the true corporate and equity value in the company.
Exhibit 1. Cost of revenues high for ABC but in-line with industry. Need to look deeper to understand where the money is.
data: HBI, Refinitiv Eikon, Koyfin
The Department of Justice's ("DoJ") lawsuit in December against ABC is well noted, however the price response was flat and suggests the news was priced in very swiftly. With the culmination of factors discussed here, we rate ABC a buy, with a suggested price range of $214–$218, or 32.5% upside potential.
Unpacking ABC FY22 earnings
It was a reasonable period of growth for ABC in FY22' in terms of profitability and cash flows. The company booked $8.34Bn in gross profit as mentioned on $2.8Bn in annual operating profit. It also realized $2.7Bn in CFFO, a marginal gain from $2.67Bn the year prior, but still a strong result. It brought this down to $8.15 in GAAP EPS, $8.04 on a fully diluted basis, a YoY gain of ~900bps in both cases.
I mentioned earlier that the revenue model for ABC might be a potential turn-off for investors taking a data-driven approach, in that its gross-to-net profit margins are thin as a percentage of turnover.
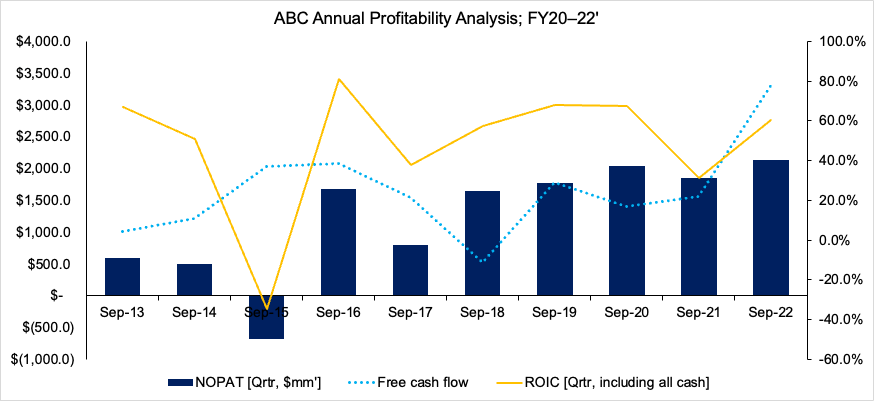
However, this is a company that saw a 113% YoY gain in annual free cash inflows to $3.33Bn, a figure that's also crept up off $1.77Bn in FY19'. Delving a little deeper, you'll see in Exhibit 2 that ABC also recognized $2.13Bn in annual net operating profit after tax ("NOPAT"), a shade off its annual operating income in FY22'. Moreover, the required invested capital [ex-goodwill] was $2.52Bn to produce this NOPAT, and the $238Bn in annual revenues.
Hence, the return on invested capital ("ROIC") for FY22' was north of 60% for the company, which is an outstanding number in our estimation, and a large spread of ~55% above the company's FY22' WACC hurdle of 5.2%. You can see the breakdown of this in Exhibit 4. As such, this gives us great confidence that ABC can fund its growth initiatives and generate future economic value looking ahead. It also creates a wide layer of resiliency in the wake of a looming economic recession.
Hence, $3.3Bn in FCF, $2.12Bn in NOPAT and a ROIC of >60% for the year, leading to an economic value added ("EVA") of ~$2Bn for the period [Exhibit 3]. To us, this screams quality.
Exhibit 2. $2.13Bn in annual NOPAT, generating FY22' ROIC of >60% with corresponding positive free cash inflows of $3.33Bn
Note: Invested capital is calculated without the inclusion of goodwill. Goodwill is not used or required in maintaining operations of the business. (Data: Author, ABC SEC Filings)
Exhibit 3. On the above measures, ABC generated ~$2Bn in annual EVA on a relatively light capital intensity
Data: Author, ABC SEC Filings
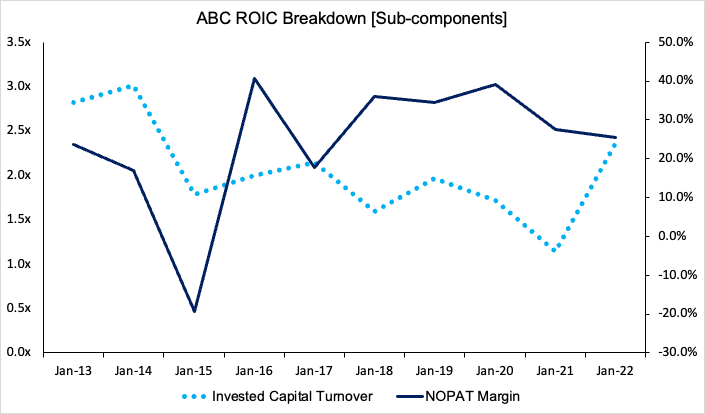
Exhibit 4. ABC's held flat NOPAT margin relative to gross profit, whilst invested capital turnover from the same has curled up to ~2.5x in FY22'.
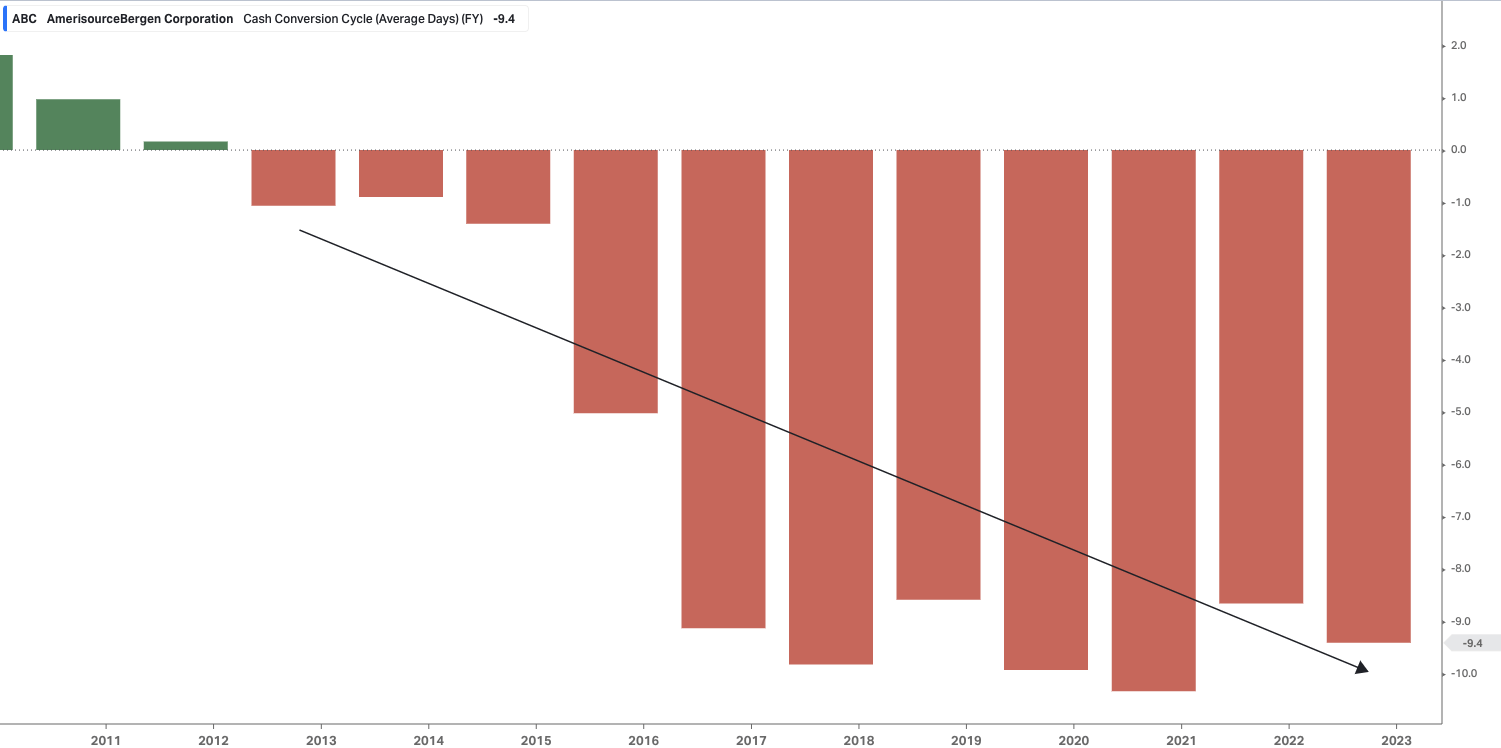
Furthermore, it's worth highlighting that ABC's working capital management is a standout.
For those observing Exhibit 5, you'll see that it has a negative cash conversion cycle, and has held this since FY14' at least on an annual basis. This means it is able to make sales of product before having to pay for them, effectively creating a 'free' form of financing from its suppliers via the favourable terms of payment.
At the same time, inventory turnover remained flat in FY22' versus the last 5-years at 15x, as the days sales outstanding crept up by only 8 days to 28 days [roughly 1 month]. This point offsets the company's negative working capital position of ~$3.9Bn, made primarily from $40.2Bn in accounts payable versus $18.4Bn in receivables.
Exhibit 5. ABC's negative cash conversion cycle adds another layer of torque to the profitability flywheel
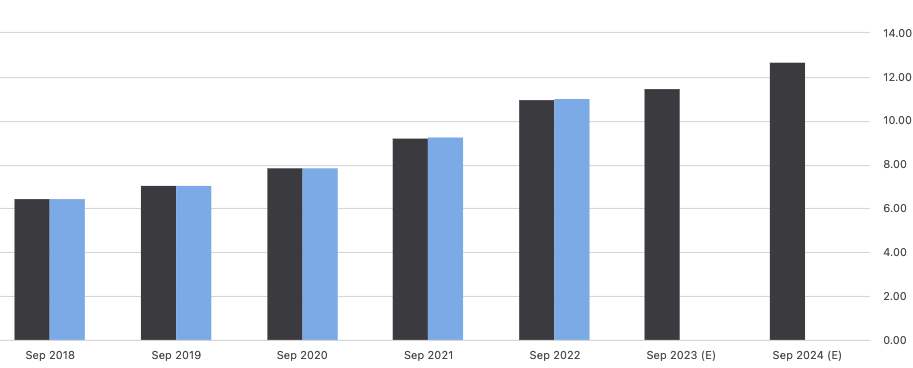
Finally, the earnings ramp for ABC is projected to continue at a reasonable gradient, as seen in Exhibit 6. This calls for ~$11.50 in non-GAAP EPS and $10.65 in GAAP EPS for FY23 [4.3% and 32.5% YoY growth respectively]. This is essential in the forward-looking regime, and with ~5.6% in forecasted FY23' revenue growth, this looks set to create an earnings leverage of ~17.2% for the coming 12 months by our calculations.
Exhibit 6. ABC non-GAAP earnings ramp into FY23 [annual]
Data: Seeking Alpha, ABC, see "Earnings Estimates"
ABC technical and market picture
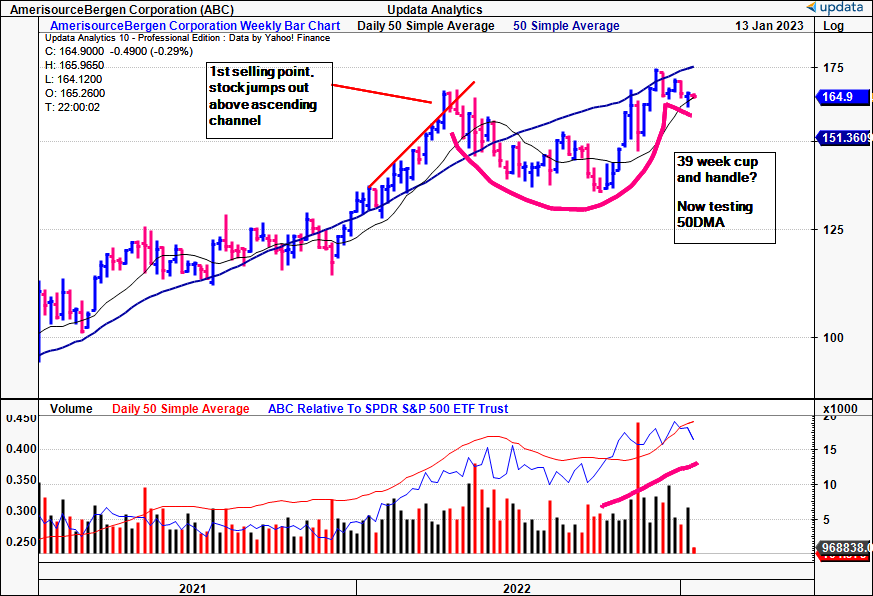
We then turned to the available market data to guide price visibility into FY23'. You can see below that ABC has just formed a potential 39-week cup and handle, creating a solid base to lift from in the coming weeks.
At the same time, the weekly volume trend has been positive. It has recently set new weekly highs as well, above the FY22' highs, and is currently testing the 50DMA as a level of support.
Exhibit 7. ABC potentially forming 39-week long cup and handle
Next question is where the recent inflows have stemmed from. We check this by examining the negative and positive volume indices, ("NVI" and "PVI" respectively) as seen in Exhibit 8. The NVI demonstrates institutional and 'smart-money' flows, and has been inclining across December to date. Hence, this demonstrates that recent inflows may be of an institutional origin, and that, orders may be a large enough ticket size to sustain a further upside move. This must be factored into the investment debate.
Exhibit 8. Potential risk with absence of institutional inflows
Data: Updata
The next question is to understand the magnitude of the overall inflows to see if there's enough buying support to sustain a further rally. As seen in Exhibit 9, daily money flows into ABC have remained positive across the back end of FY22'. Since FY21', deep outflows have actually proven to be good buying points for the stock, so a pullback in order flow would also entice us here, and potentially attract larger accounts to size in. Point is, overall inflows remain positive, and at a high level. This is also seen in the weekly inflows into ABC shown in Exhibit 10.
Exhibit 9. Daily inflows still registering an upside bias, potentially filling order book on the buy-side.
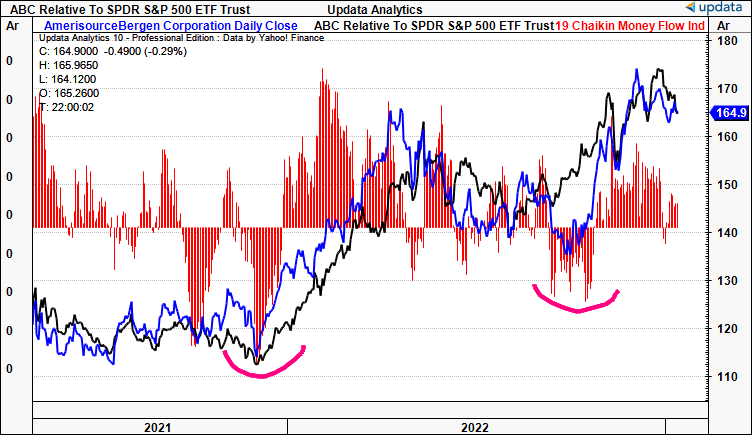
Exhibit 10. Weekly inflows till positive, but have pulled back substantially off FY22' highs.
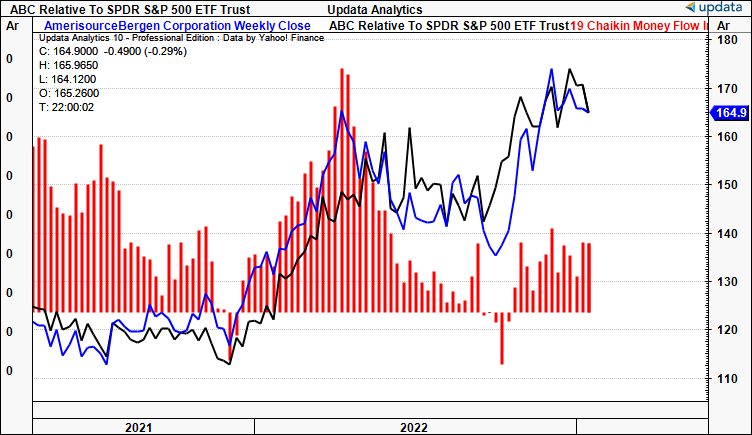
Valuation and conclusion
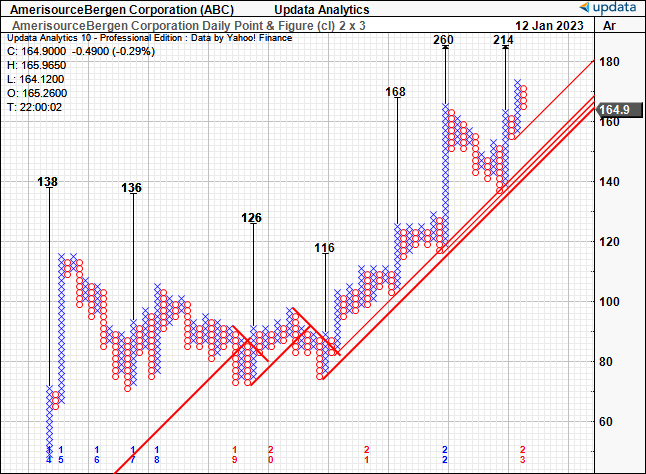
To derive a valuation, we incorporated the market data from above and fundamental drivers listed earlier. The stock trades at 15.5x forward GAAP earnings, and is attractively priced at 12.5x cash flow, with a trailing cash flow yield of 8.1%. Looking at the technical price objectives, we have upside targets to $214 and then $260, as shown in Exhibit 11. You'll note the stock has held within the ascending channel across the testing period, with targets being met at each point along the way.
Exhibit 11. Upside price targets to $214, then $260
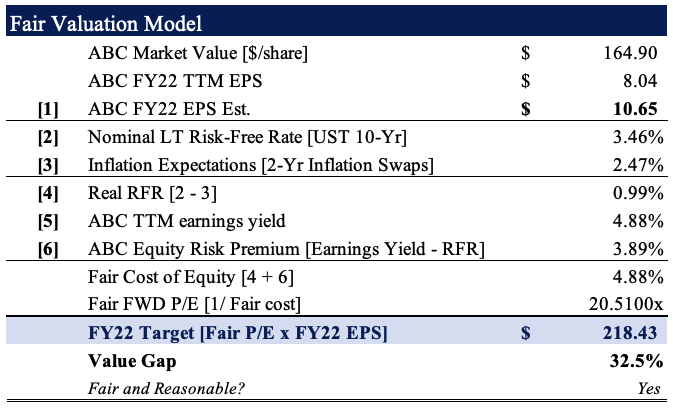
Furthermore, we believe the stock should trade fairly at ~20.5x forward earnings [Exhibit 12], on the consensus GAAP EPS target of $10.65. At these numbers, this derives a price target of $218, in-line with the targets derived above. We therefore are searching for price objectives of $214 then $218 in the coming 6-12 months for ABC.
Exhibit 12. Valuation upside of 32.5% with price target of $218, or 20.51x earnings.
Net-net, we believe there's scope for ABC to re-rate and provide valuation upside in FY23'. The market has priced in the potential fall out from the DoJ investigation, and this gives a further sense of confidence to this point. We see a potential re-rating to the $214–$218 range, providing 32.5% upside potential from the current market price.
For further details see:
AmerisourceBergen Screams Quality At 15x Earnings, 60% ROIC