HRMY - Amphastar Pharmaceuticals: Great Growth At A High Price
2023-10-10 21:41:26 ET
Summary
- Amphastar Pharmaceuticals has implemented aggressive corporate strategies to maximize margins and increase sales, resulting in impressive EBIT and revenue growth.
- The company's focus on high-margin products and strategic acquisitions has contributed to its success.
- While the company's growth prospects and pipeline are promising, the current share price may pose a risk for investors.
Amphastar Pharmaceuticals, Inc. ( AMPH ) is a pharmaceutical company that since 2020 has been going through a period of strong changes in terms of corporate strategies aimed at aggressively modifying the mix of products placed on the market with the target of maximizing margins and increasing sales. The results were not long in coming as the EBIT reached the impressive target of 24.5% [TTM] and the revenue is growing by 10.5% [CAGR] on an annual basis. New acquisitions and a pipeline full of high-margin products in thriving markets represent a green card for future quarters or years. The ability to continue following the same path in the coming semesters is the key element to seal such significant growth rates. To date, we have recorded a decreasing trend in the share price starting from August and this element could represent an excellent investment opportunity in the coming weeks. In fact, at current prices the risk of an investment with low returns is high. My rate is on Hold pending any further price reductions.
Company Overview
Amphastar Pharmaceuticals, founded in 1996 in California and located in Rancho Cucamonga, CA, is a biopharmaceutical firm that develops, produces, markets, and sells generic and proprietary injectable, inhalation, and intranasal medications, as well as products containing the active pharmaceutical ingredient ((API)), insulin. The company now manufactures and markets about 20 products and all are prescription medications.
To find the lowest competition, Amphastar produces technically difficult items thanks to diverse technological skills. Complex molecule characterization, peptide and protein analysis and synthesis, and immunogenicity research are some of these abilities.
To enable organic and internal growth and expertise, the company has made many strategic acquisitions in terms of companies and products. The products markets are based on Injectable and Inhalation.
The main strategies can be summarized as developing proprietary goods with a focus on high-margin products and integrating strategic acquisitions.
Financial Highlights
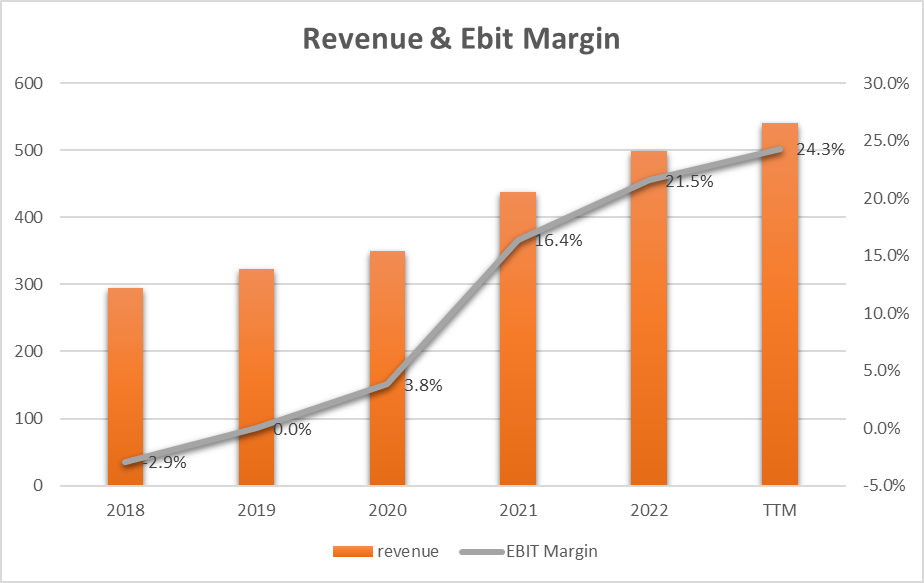
Revenue & Margins
revenue and EBIT (AMPH 10-K + Author Graphics)
The company has been able to grow revenue over the last 5 years at a rate of 10.7% per year [CAGR] from almost $ 300M in 2018 to 541 [TTM]. Growth is important and was driven by the development of internal products but also by targeted acquisitions.
In any case, the most important aspect that we can grasp from the graph above is that relating to EBIT which went from negative to an astonishing 24.3%. This extraordinary success is due to two factors. The gross margin managed to rise by around 15 percentage points and this underlines how the management was able to invest in the sales of high-margin products. On the other hand (also thanks to the increase in revenue) operating costs dropped by around 10 percentage points. These dual effects combined to completely transform EBIT.
Going into detail about the growth in sales and moving on to the last year we can underline that the greatest impacts are due to two products: glucagon and phytonadione. The question that may arise spontaneously is whether these growths can persist or continue. Listening to the latest earnings call Dan Dischner (Senior Vice President of Corporate Communications) said:
standout performer has been our glucagon injection product, which has achieved an exceptional sales milestone reaching $27.3 million. This remarkable achievement can be attributed to our expanded market share in this space, gaining market share in the diagnostic market, and our carefully planned capacity increase, resulting in an impressive 131% growth on an annualized basis. We anticipate the glucagon injection demand to remain durable.
And Bill Peters (Chief Financial Officer) said:
Glucagon sales more than doubled …, primarily due to continuing strong market demand as some suppliers discontinued selling glucagon. Phytonadione sales increased ….in the second quarter of last year as a result of supplier shortages.
From these statements, we can extrapolate two fundamental concepts. The main growth products have seen greater market penetration with a market share that has grown and also on the other hand a supplier shortage. The forecast is for continuity in this sense.
Looking at the last part of the year and 2024 we can also identify some important developments in terms of sales:
- BAQSIMI acquisition from Lilly (LLY) - completed on June 23 - will increase the diabetes portfolio and will become part of Amphastar sales in the second half of the year. The previous owner has highlighted recorded sales up 20% from the second quarter of 2022.
- Glucagon injection will be launched in Canada a new geographical market.
- Medroxyprogesterone, which is a larger product in the other finished pharmaceutical products category was stopped in sales due to API supplier crushes. The company thinks that the new supplier will reach FDA approval in the first part of 2024. At this time the sales will begin again.
- The FDA has approved the name Ruxovi for the new intranasal naloxone product. The Company has planned to start the sales in the fourth quarter of 2023.
The forecasts for glucagon plus these new products and markets lay the foundations for hypothesizing continued growth in sales in the coming months. Likewise, margins should maintain the levels achieved in the last period.
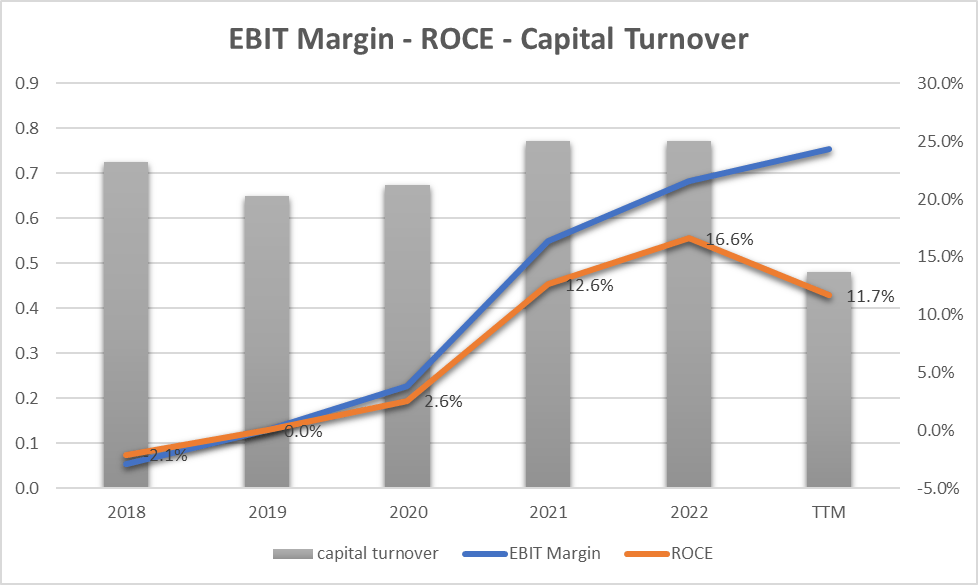
Capital Turnover and ROCE
The graph above shows us how the acquisition of BAQSIMI has impacted the use of capital (capital turnover which has fallen below 0.5 from 0.8) and above all how the profitability of the use of capital [ROCE] has dropped by approximately 5 percentage points (from 16.6% in 2022 to 11.7% in 2023). Everything is largely explained by the use of capital in the acquisition which to date has not yet produced sales and if this is a major element of challenge on the one hand it can also be seen as the new profitability objective for the coming months on the other hand that is, to recover "at least" the 5 percentage points lost in profitability.
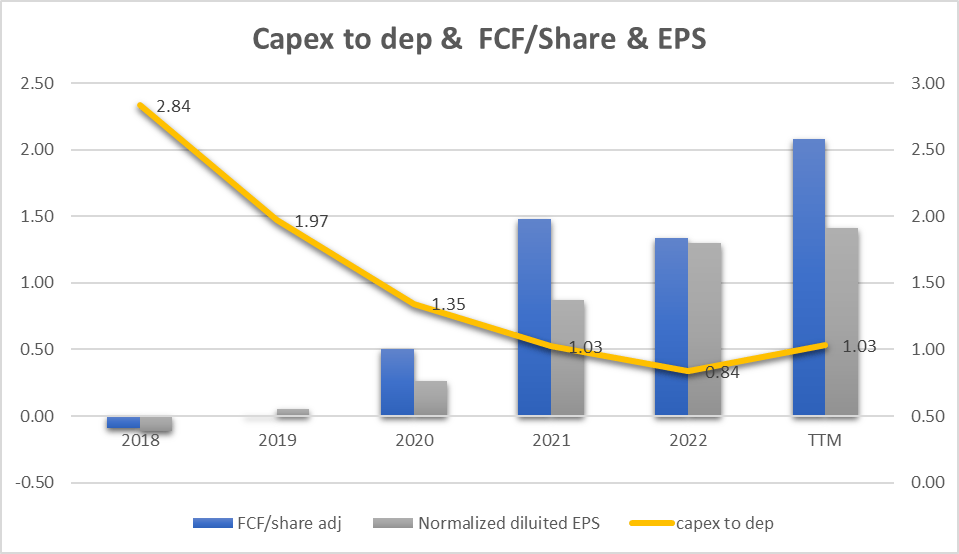
EPS, FCF, and Capex
The graph shows how the company has been able to generate Earnings and Free Cash Flow for positive and constantly growing shares since 2020. Extending the analysis to a period of 10 years we record an annual growth in EPS [CAGR] of 17.5%, a very important figure which underlines the growth propensity of the company. Likewise, FCF followed EPS and this is also a positive result.
The blue bars represent FCF/share and we can see that company profits have generated an increasing FCF over the last 5 years. The only slightly negative trend is recorded in 2022 where the FCF/share drops to $1.34 compared to $1.48 in 2021. The main reason for this decrease is attributable to a negative effect of Inventory (2022) for an impact of $-11.7M. Inventory in 2023 was then improved and FCF was positively impacted.
The yellow line instead relates the expenditure in terms of Capex referred to as depreciations. This parameter allows us to understand how much the company invests in development compared to the assets already launched. The decreasing trend, in this case, does not imply a virtuous aspect or rather identifies a trend, at least over the last 5 years, which identifies a substantial reduction in investments. Only in 2023 will there be a recovery with the parameter above unity. For a company like Amphastar, growth should be correlated with continuous investments in R&D and the parameter should always be above 1.
Cash on hand and liquidity
Looking at the net change in cash for the last quarter [Q2] we can see that the balance is negative by $25.6M. The figure is largely explained by previous debts repaid for $67.5M and this, in addition to other operational and financial needs, has probably directed the company to request a new injection of liquidity ( private offering of $300M of convertible senior notes ). These funds will mainly be used to repay maturing loans ($200M) and also to buy back own shares ($50M). It is possible that the repaid debts could bring a benefit on interest expenses but we will only be able to have visibility when we have clear data from the last quarter [Q3]. Regarding the share buyback program, this will probably lead to an improvement in profitability on the share price.
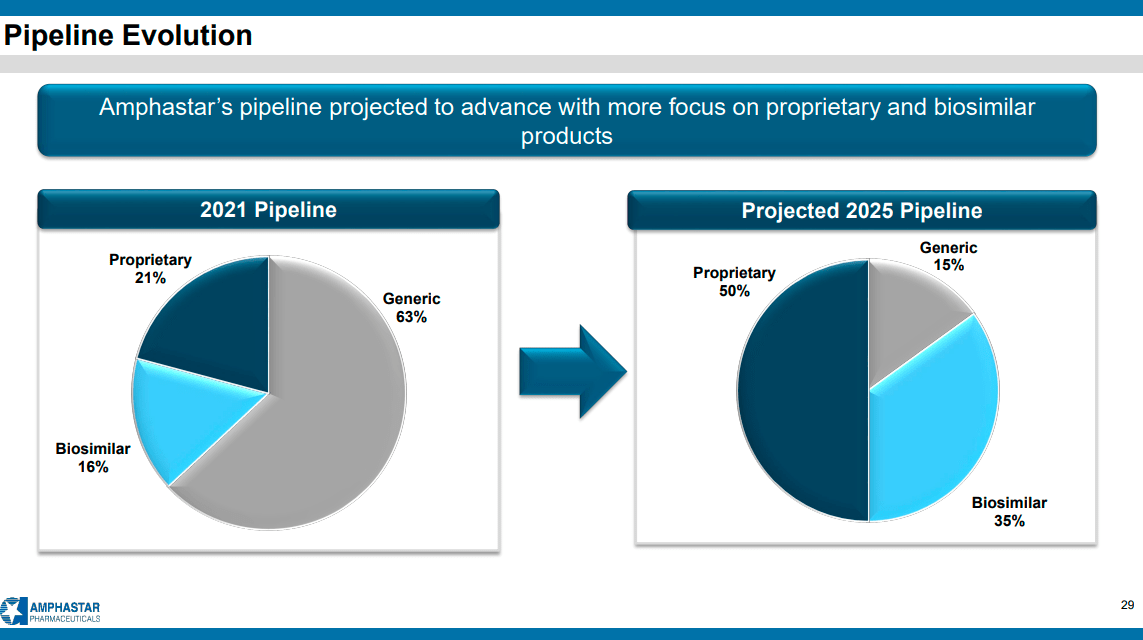
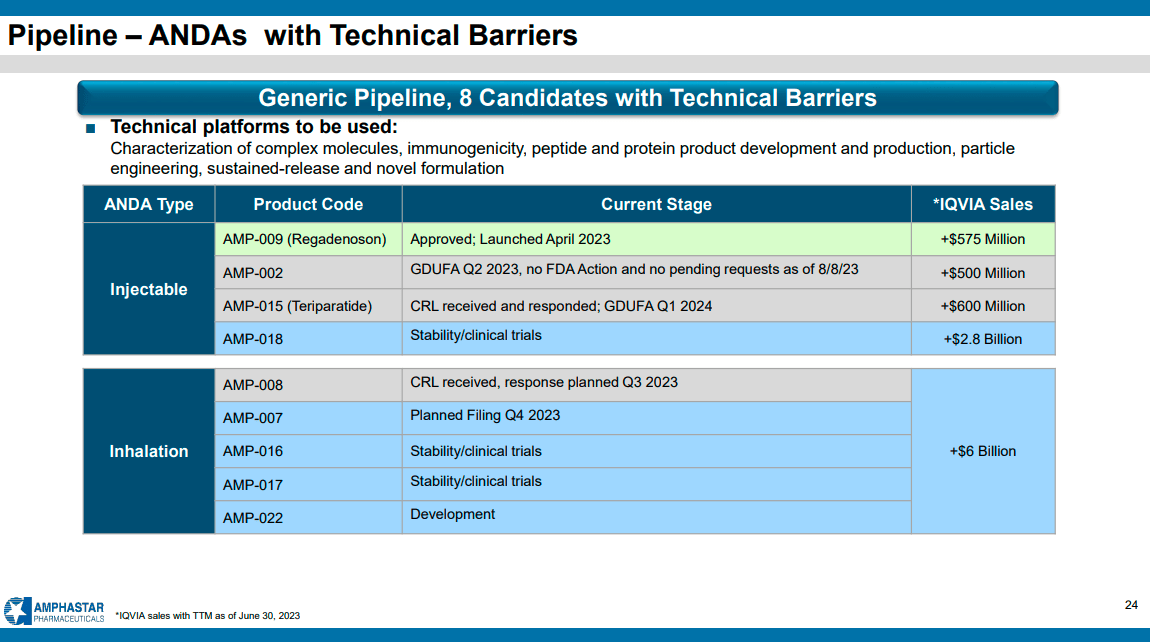
Pipeline
The company strategy in terms of new product development is very clear and envisages a substantial change in mix in favor of proprietary products which will have to more than double in the next two years while generic products will have to reduce by around a third. This strategy implies a clear path aimed at seeking greater profitability on the one hand and at creating technical barriers to entry into the relevant markets.
AMPH Corporate Presentation 2023
Going into a little more detail we can see how in the two main markets (injectable and inhalable) the company has 9 products in the pipeline for a market target exceeding $ 10 billion (IQVIA Sales). Specifically, there is $1.675 Million ready to be attacked in 2024 (injectable market)
AMPH Corporate Presentation 2023
Corporate strategy and sales market potential represent two elements of sure interest and establish a clear growth path which, if put to the ground, could lead to achieving growth rates even higher than those of recent years.
Share price valuation
AMPH and Earnings Power Value
Assuming that the cash profit remains constant over the long term, I use the EPV (earnings power value) method to calculate the intrinsic share price value.
The method starts with EBIT. The second step is to add depreciation and amortization and then subtract stay-in-business CAPEX.
The result is the Cash Trading Profit
I then subtract the taxes by calculating the amount using the actual tax rate that the company pays.
The result is the After-Tax Cash Trading Profit
At least to calculate the total company enterprise value I divide the After-Tax Cash Profit by the interest Rate I define as fine for this kind of Company (AMPH could be a medium-risk company so I decided to use 8%)
The result is the Total Company Earnings Power Value. Dividing the result by the total number of shares we find the value per single share.
The table below shows the calculation for AMPH
| EBIT |
| 131.40 |
| Dep & amort |
| 29.50 |
| CAPEX |
| -30.50 |
| Cash Trading Profit |
| 130.40 |
| TAX |
| 20.90% |
| TAX |
| -27.2536 |
| After TAX cash profit |
| 103.15 |
| Interest Rate |
| 8% |
| EPV |
| 1289.33 |
| Share in issue |
| 48.8 |
| EPV per share |
| 26.4 |
$26.4 represents the share price valuation using the EPV method. If we compare the data with the current market price ($47.2) we see that the current price could be seen as expensive.
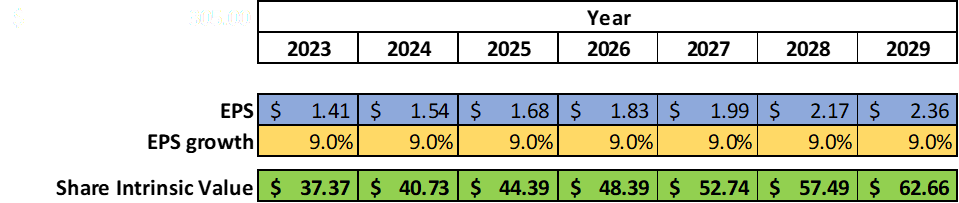
EPS Growth Model
The EPV approach may be a little bit conservative as there is no growth in earnings. Therefore I need to implement an alternative comparison method based on the estimated EPS growth in the next few years. Since the company is growing in terms of revenue and EPS, I decided to use the EPS growth parameter in the last ten years which is 17.5% [CAGR], and halve it to maintain a 50% safety margin. So 9% is the estimated growth rate [CAGR] of EPS.
The Formula is (by popular investor Benjamin Graham):
Intrinsic value per share = EPS x (8.5 + 2 g)
Where
EPS = earnings per share
g = EPS growth rate = 9%
Example of calculation for 2023:
Intrinsic value per share = EPS x (8.5 + 2 g) = 1.41x(8.5+2x9) = $37.37
The last intrinsic value of $62.66 for 2029 underlines an annualized return of 4,8% as the current share price is $47.19.
4.8% is a low figure and is the annualized expected return for my investment in AMPH.
Peer comparison
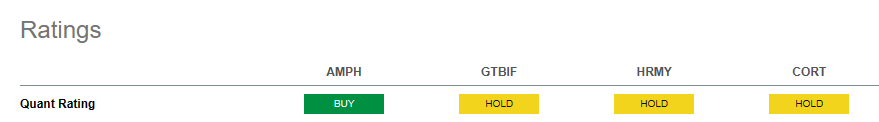
To compare AMPH with similar companies in the same Pharmaceuticals industry I have defined the following peers:
- Green Thumb Industries Inc. ( GTBIF )
- Harmony Biosciences Holdings, Inc. ( HRMY )
- Corcept Therapeutics Incorporated ( CORT )
Using Seeking Alpha's Quant Ratings we have a ‘Buy’ rate related to the ‘Hold’ rating of the other company. These assessments highlight a favorable moment for Amphastar compared to the other companies.
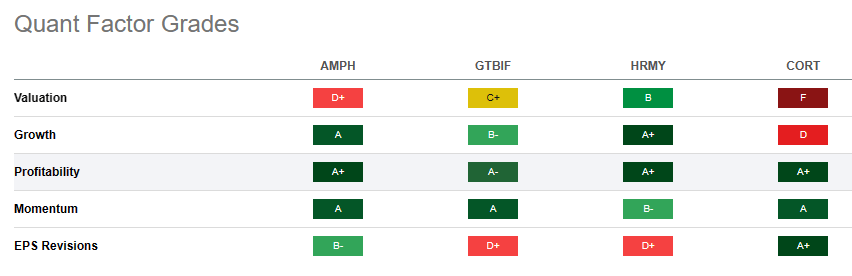
From the Quant Factor Grades point of view, we can see how AMPH is outstanding in Profitability and has a green label in Growth, Momentum, and EPS Revisions. Only in Valuation, the grade is ‘D+‘ and both GTBIF and HRMY reach the best grade, CORT is less preferable. Momentum is ‘A‘ and if compared with peers AMPH is in line and this could represent a great moment for the industry sector. Globally AMPH has the best mix factor grades and, at the moment, represents one of the best investment opportunities.
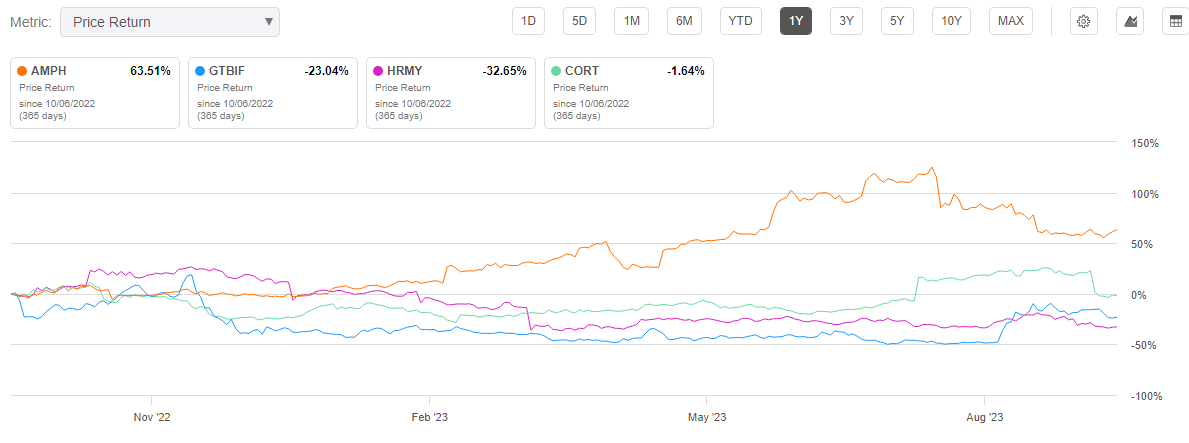
Looking at the share price trend we can see how AMPH has been the best performer in the last year with a 63.51% return but if we observe the trend starting from August we can see how the advantage has almost halved. This downward trend that has been going on for about two months could offer an excellent entry opportunity in the coming weeks.
Price represents the main Risk
The company's future success depends mainly on the capacity to develop, acquire, and market new products.
We have seen how the company strategy is bringing excellent results in terms of growth and profitability during 2023. We have also seen how the pipeline is such that we can hypothesize future growth comparable to that which occurred in the past. The economic indicators also tell us that the company is in good health and has the foundations to be able to face the challenges of the next quarters. The real risk, in my opinion, is represented by a purchase price of the share that is too high. In other words, entering the market under current conditions we must take into account that an annual EPS growth rate of 9-10% is not sufficient to guarantee suitable profitability for the investment in the long term. We should therefore assume, at the current purchase price, growth above at least 15% [CAGR] which represents a high risk in my opinion.
Conclusion
Amphastar Pharmaceuticals represents an excellent investment opportunity in the pharmaceutical sector. The company is growing exponentially both in terms of sales and margins. All thanks to an excellent product acquisition strategy and reorganization of the market mix. In the last year, even exogenous factors such as the shortage of suppliers have had positive effects on sales and margins but new products and new markets should largely compensate for these effects which will probably diminish over time. The only element of high risk remains the purchase price which, at this moment, appears to be a little too high and therefore generates a strong element of risk. The price trend of the last two months is decreasing and could be an excellent signal to enter a long position in the next few weeks if the price drops by around a further 25%. My rate for now is Hold.
For further details see:
Amphastar Pharmaceuticals: Great Growth At A High Price