EWBC - An Investment Case For East West Bancorp
2023-09-12 10:39:20 ET
Summary
- East West Bancorp has a history of organic growth and strong EPS figures, making its current valuation reasonable.
- The bank has successfully navigated risks, including the US-China relationship, and has a unique value proposition in this space.
- The bank's balance sheet and capital ratios are strong.
Introduction
My thesis is that there is an investment case for East West Bancorp (EWBC). Management has a history of navigating risks and they continue to grow EPS organically such that today's valuation looks very reasonable.
The Numbers
The EPS figures have come a long way over the years, especially through organic growth as opposed to acquisitions. These numbers are in millions except for EPS and weighted average shares. The 2013 net income to common shareholders is after a preferred dividend of $3.43 million. The EPS numbers and other figures come from 10-K filings which can vary from what is shown in annual reports depending on factors such as the way management looks back on acquisitions:
| Net Interest Income |
| Provision For Credit Losses |
| Non Interest Income |
| Noninterest Expense |
| Pretax Income |
| Tax |
| *Net Income |
| Pref. Div. |
| Net Income To Common Shareholders |
| EPS |
| Weighted Avg. Shares |
| 1996 |
| $40 |
| $(4) |
| $6 |
| $35 |
| $6 |
| $2 |
| $3 |
| $3 |
| $0.13 |
| 23,775,000 |
| 1997 |
| $44 |
| $(6) |
| $8 |
| $29 |
| $18 |
| $7 |
| $11 |
| $11 |
| $0.46 |
| 23,775,000 |
| 1998 |
| $56 |
| $(5) |
| $10 |
| $33 |
| $28 |
| $10 |
| $18 |
| $18 |
| $0.76 |
| 23,775,000 |
| 1999 |
| $72 |
| $(5) |
| $15 |
| $40 |
| $42 |
| $14 |
| $28 |
| $28 |
| $1.23 |
| 22,757,000 |
| 2000 |
| $89 |
| $(4) |
| $15 |
| $50 |
| $50 |
| $15 |
| $35 |
| $35 |
| $1.58 |
| 22,448,000 |
| 2001 |
| $99 |
| $(6) |
| $22 |
| $62 |
| $53 |
| $14 |
| $39 |
| $39 |
| $1.69 |
| 23,033,000 |
| 2002 |
| $117 |
| $(10) |
| $25 |
| $64 |
| $69 |
| $20 |
| $49 |
| $49 |
| $2.06 |
| 23,596,000 |
| 2003 |
| $143 |
| $(9) |
| $33 |
| $78 |
| $90 |
| $31 |
| $59 |
| $59 |
| $1.23 |
| 48,112,000 |
| 2004 |
| $199 |
| $(17) |
| $32 |
| $93 |
| $121 |
| $43 |
| $78 |
| $78 |
| $1.54 |
| 50,654,000 |
| 2005 |
| $280 |
| $(16) |
| $30 |
| $124 |
| $170 |
| $62 |
| $108 |
| $108 |
| $2.03 |
| 53,454,000 |
| 2006 |
| $367 |
| $(6) |
| $34 |
| $162 |
| $234 |
| $90 |
| $143 |
| $143 |
| $2.41 |
| 59,605,000 |
| 2007 |
| $408 |
| $(12) |
| $50 |
| $183 |
| $262 |
| $101 |
| $161 |
| $161 |
| $2.63 |
| 61,180,000 |
| 2008 |
| $355 |
| $(226) |
| $(25) |
| $201 |
| $(97) |
| $(47) |
| $(50) |
| $9 |
| $(59) |
| $(0.94) |
| 62,673,000 |
| 2009 |
| $486 |
| $(529) |
| $391 |
| $243 |
| $105 |
| $23 |
| $77 |
| $49 |
| $28 |
| $0.35 |
| 78,770,000 |
| 2010 |
| $895 |
| $(200) |
| $39 |
| $478 |
| $256 |
| $91 |
| $165 |
| $43 |
| $121 |
| $0.88 |
| 137,478,000 |
| 2011 |
| $903 |
| $(95) |
| $11 |
| $436 |
| $383 |
| $138 |
| $245 |
| $7 |
| $238 |
| $1.62 |
| 147,093,000 |
| 2012 |
| $919 |
| $(65) |
| $(6) |
| $423 |
| $426 |
| $144 |
| $282 |
| $7 |
| $275 |
| $1.94 |
| 141,457,000 |
| 2013 |
| $956 |
| $(22) |
| $(92) |
| $416 |
| $426 |
| $131 |
| $295 |
| $3 |
| $292 |
| $2.12 |
| 137,342,000 |
| 2014 |
| $1,041 |
| $(49) |
| $(12) |
| $565 |
| $415 |
| $73 |
| $342 |
| $342 |
| $2.40 |
| 142,952,000 |
| 2015 |
| $950 |
| $(14) |
| $183 |
| $541 |
| $579 |
| $194 |
| $385 |
| $385 |
| $2.67 |
| 143,818,000 |
| 2016 |
| $1,033 |
| $(27) |
| $183 |
| $616 |
| $572 |
| $141 |
| $432 |
| $432 |
| $3.00 |
| 144,087,000 |
| 2017 |
| $1,185 |
| $(46) |
| $258 |
| $661 |
| $735 |
| $229 |
| $506 |
| $506 |
| $3.50 |
| 144,444,000 |
| 2018 |
| $1,387 |
| $(64) |
| $211 |
| $714 |
| $819 |
| $115 |
| $704 |
| $704 |
| $4.86 |
| 144,862,000 |
| 2019 |
| $1,468 |
| $(99) |
| $222 |
| $747 |
| $844 |
| $170 |
| $674 |
| $674 |
| $4.63 |
| 145,497,000 |
| 2020 |
| $1,377 |
| $(211) |
| $236 |
| $716 |
| $686 |
| $118 |
| $568 |
| $568 |
| $3.99 |
| 142,336,000 |
| 2021 |
| $1,532 |
| $35 |
| $286 |
| $796 |
| $1,056 |
| $183 |
| $873 |
| $873 |
| $6.16 |
| 141,826,000 |
| 2022 |
| $2,046 |
| $(74) |
| $299 |
| $859 |
| $1,412 |
| $284 |
| $1,128 |
| $1,128 |
| $7.98 |
| 141,326,000 |
Net income to common shareholders was $634,470 thousand for 1H23 relative to $495,981 thousand for 1H22. As such, trailing twelve month ("TTM") net income to common shareholders through June 2023 was $1,266.5 million or $634.5 million + $1,128 million - $496 million.
The reported EPS for 1999, the first year East West was public, came in at $1.23. In 23 years, this grew to $7.98 by 2022 for a CAGR of 8.5%. EPS increases have been higher than this average during years when overall growth was done organically as opposed to years in which the share count was diluted when growth was done with acquisitions.
The time period from 2007 to 2015 shows EPS growth suffered during a time when we went from the peak of an old cycle and it navigated through a large acquisition. The 2007 10-K shows basic EPS of $2.63 and a share count of 61,180,000. 8 years later, the 2015 10-K shows basic EPS is relatively flat at $2.67 while the share count has ballooned to 143,818,000 due to acquisitions.
The period from 2015 to 2022 centered more on organic growth as the share count actually decreased from 143,818,000 down to 141,326,000. EPS grew from $2.67 to $7.98 during this 7 year period for a CAGR of nearly 17%. CEO Dominic Ng talked about continuing organic growth in the 4Q20 call (emphasis added):
If we reflect that, from the last, very tiny acquisition that we made was in 2014, for MetroBank, in Texas, a very small institution for about $2 billion in size. And at that time, since then, we've been growing organically. And we've doubled our size in less than six years . So we've done pretty well, organic growth through organic growth. [Our] challenge really is more internal, the internal issue is that, how do we justify any acquisition, when we have the ability to double our size in less than six years , and so look like going forward, we still have that ability to continue to grow organically. And so from that perspective, any kind of potential acquisition that we looked at, it needs to be very attractive.
The efficiency ratio is defined in the 2022 10-K as noninterest expense divided by total revenue and it has improved over the years. Note that some of the older 10-K filings used another calculation for this metric but this spreadsheet stays with the 2022 definition over the years. The ROA below is based on average assets as opposed to year-end assets. Total year-end assets below are in millions:
| *ROA |
| ROE |
| Per-share Div. Decl. |
| Payout Ratio |
| NIM |
| *Efficiency Ratio |
| *Liabilities To Equity |
| Total Assets |
| 1996 |
| 0.22% |
| 3% |
| 2.82% |
| 78% |
| 1997 |
| 0.70% |
| 9% |
| 2.92% |
| 55% |
| 1998 |
| 1.00% |
| 13% |
| 3.22% |
| 50% |
| 1999 |
| 1.35% |
| 19% |
| $0.12 |
| 10% |
| 3.62% |
| 46% |
| 2000 |
| 1.51% |
| 22% |
| $0.12 |
| 8% |
| 4.03% |
| 48% |
| 2001 |
| 1.47% |
| 18% |
| $0.12 |
| 7% |
| 3.98% |
| 51% |
| 2002 |
| 1.61% |
| 18% |
| $0.27 |
| 13% |
| 4.11% |
| 45% |
| 10.0 |
| $3,321 |
| 2003 |
| 1.64% |
| 18% |
| $0.20 |
| 16% |
| 4.26% |
| 44% |
| 10.2 |
| $4,055 |
| 2004 |
| 1.57% |
| 18% |
| $0.20 |
| 13% |
| 4.24% |
| 40% |
| 10.7 |
| $6,029 |
| 2005 |
| 1.55% |
| 18% |
| $0.20 |
| 10% |
| 4.22% |
| 40% |
| 10.3 |
| $8,278 |
| 2006 |
| 1.46% |
| 16% |
| $0.20 |
| 8% |
| 3.98% |
| 40% |
| 9.6 |
| $10,824 |
| 2007 |
| 1.45% |
| 15% |
| $0.40 |
| 15% |
| 3.94% |
| 40% |
| 9.1 |
| $11,852 |
| 2008 |
| $0.40 |
| 3.19% |
| 61% |
| 7.0 |
| $12,423 |
| 2009 |
| 0.55% |
| 5% |
| $0.05 |
| 13% |
| 3.76% |
| 28% |
| 8.0 |
| $20,559 |
| 2010 |
| 0.82% |
| 7% |
| $0.04 |
| 5% |
| 5.05% |
| 51% |
| 8.8 |
| $20,701 |
| 2011 |
| 1.14% |
| 11% |
| $0.16 |
| 10% |
| 4.66% |
| 48% |
| 8.5 |
| $21,969 |
| 2012 |
| 1.29% |
| 12% |
| $0.40 |
| 21% |
| 4.63% |
| 46% |
| 8.5 |
| $22,536 |
| 2013 |
| 1.25% |
| 13% |
| $0.60 |
| 29% |
| 4.38% |
| 48% |
| 9.5 |
| $24,730 |
| 2014 |
| 1.24% |
| 13% |
| $0.72 |
| 30% |
| 4.03% |
| 55% |
| 9.1 |
| $28,738 |
| 2015 |
| 1.27% |
| 13% |
| $0.80 |
| 30% |
| 3.35% |
| 48% |
| 9.4 |
| $32,351 |
| 2016 |
| 1.30% |
| 13% |
| $0.80 |
| 27% |
| 3.30% |
| 51% |
| 9.1 |
| $34,789 |
| 2017 |
| 1.41% |
| 14% |
| $0.80 |
| 23% |
| 3.48% |
| 46% |
| 8.7 |
| $37,122 |
| 2018 |
| 1.83% |
| 17% |
| $0.86 |
| 18% |
| 3.78% |
| 45% |
| 8.3 |
| $41,042 |
| 2019 |
| 1.59% |
| 14% |
| $1.06 |
| 23% |
| 3.64% |
| 44% |
| 7.8 |
| $44,196 |
| 2020 |
| 1.16% |
| 11% |
| $1.10 |
| 28% |
| 2.98% |
| 44% |
| 8.9 |
| $52,157 |
| 2021 |
| 1.47% |
| 16% |
| $1.32 |
| 22% |
| 2.72% |
| 44% |
| 9.4 |
| $60,871 |
| 2022 |
| 1.80% |
| 20% |
| $1.60 |
| 20% |
| 3.45% |
| 37% |
| 9.7 |
| $64,112 |
It's impressive how the declared dividend increased from $83.3 million in 2013 to $229 million in 2022 as the payout ratio decreased from 28.57% to 20.32% and the weighted average number of shares remained somewhat stable. These ratios continue to look good for the first half of 2023. Per the 2Q23 presentation , ROA was 2.01% in 1Q23 and 1.85% in 2Q23. ROE was 21.1% and 19.4%, respectively. NIM was 3.96% and 3.55%, respectively. The efficiency ratio was 30.5% and 31.8%, respectively.
During the 2Q22 call , CEO Dominic Ng talks about doubling the balance sheet organically in a 5 year time period (emphasis added):
Now reflecting back several years ago, obviously, most banks were actively doing buyback and East West was one of the isolated few that is not. But if you look at what we've done, in the last 4 to 5 years, we have actually almost doubled our balance sheet organically, not acquisition, organically . So obviously, we knew we have the engine that can grow, and we did not want to spend the capital into buyback when we knew that we have plenty of growth [opportunities].
Based on management's track record, I believe they will continue to find ways to grow the business organically.
Valuation Overview
We have to weigh risks in order to make reasonable bets about the future earnings power and today's valuation. History doesn't necessarily repeat itself exactly but there are times in which it rhymes. The tech sector cooled before interest rates changed and Silicon Valley Bank ("SVB") failed in March. China's economy has been cooling and it makes sense to study risks for East West Bancorp in this new interest rate environment. Lehman Brothers failed during the financial crisis when residential real estate values collapsed and today people are talking about commercial real estate values falling.
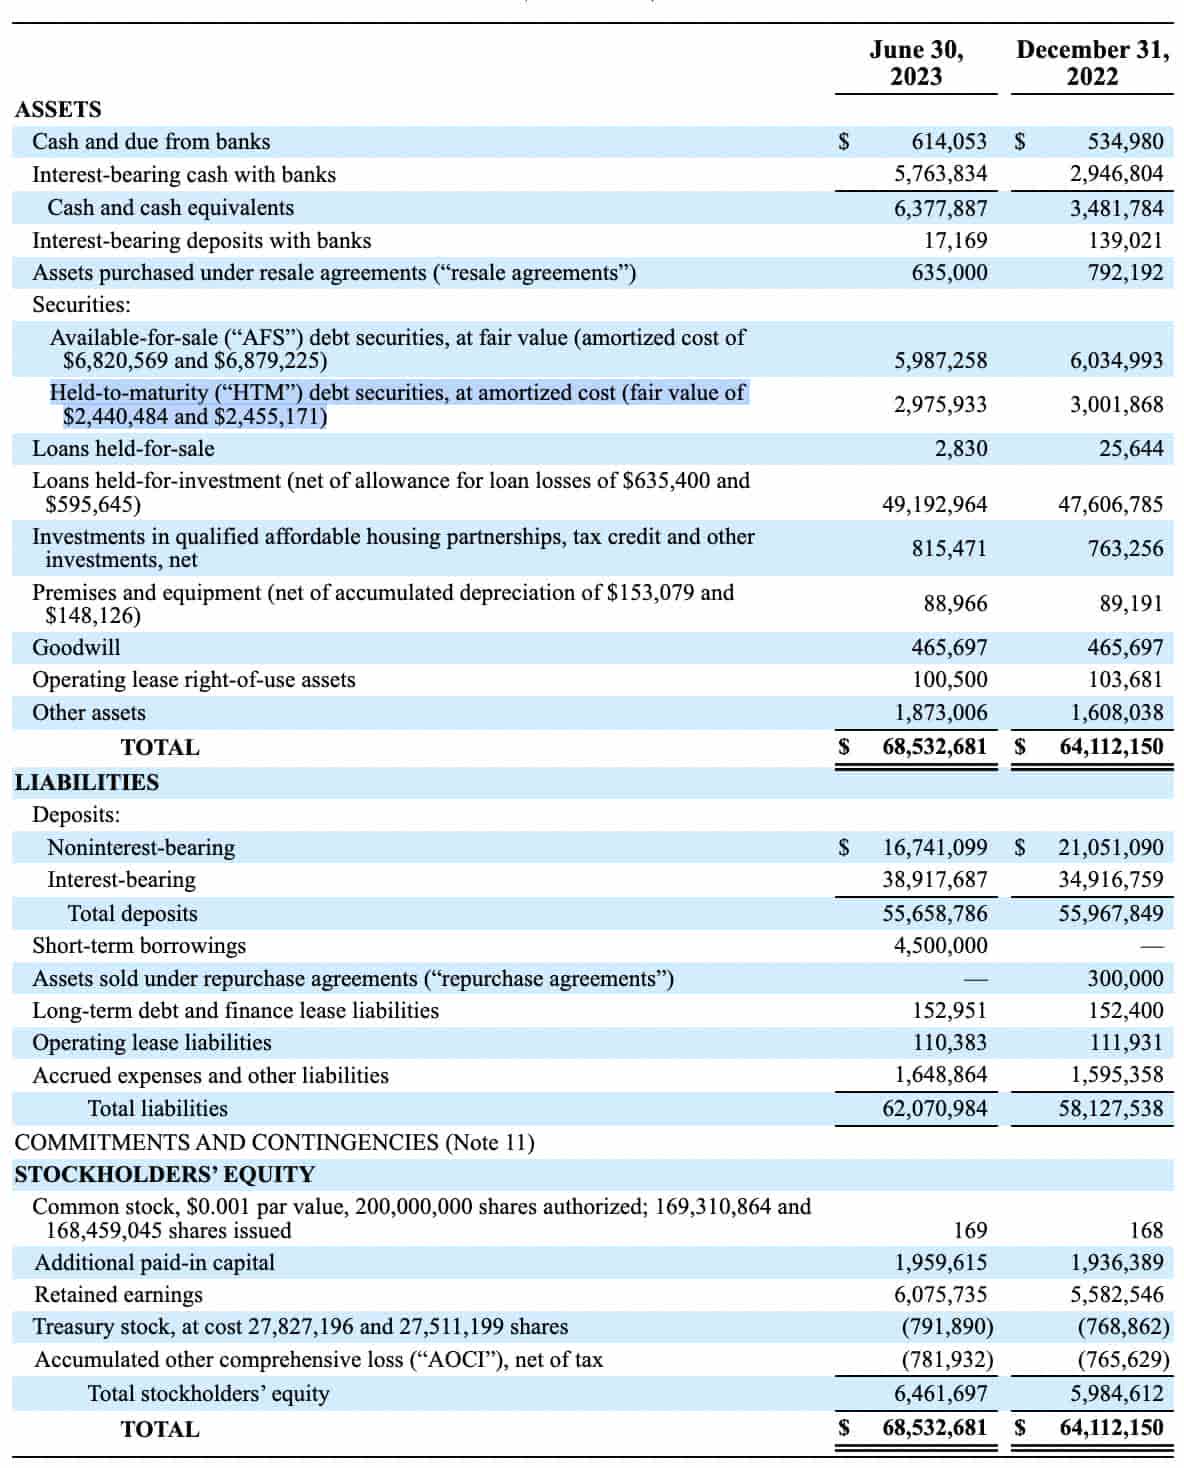
East West Bancorp's 2Q23 balance sheet shows $49,193 million in loans held-for-investment. This figure is $49.8 billion without the $635 million allowance for loan losses and the 2Q23 presentation shows a breakdown of the 3 pillars as follows:
$15.7 billion Commercial and industrial ("C&I")
$19.9 billion Commercial real estate ("CRE")
$14.2 billion Residential mortgage and other consumer
----------
$49.8 billion
I believe the CRE and residential mortgage loans are somewhat stable seeing as they have weighted-average loan-to-value ("LTV") ratios of about 50%. The 2Q23 10-Q balance sheet reveals these 3 pillars represent $49.2 billion of the overall $68.5 billion in assets:
China Risk
Looking at East West Bancorp's $55.7 billion deposit figure, we see China deposits of $1.5 billion plus Hong Kong deposits of $1.4 billion. From a direct risk standpoint, China and Hong Kong are a small percentage of overall deposits although there are some indirect risks as many of the US deposits are ultimately tied to China.
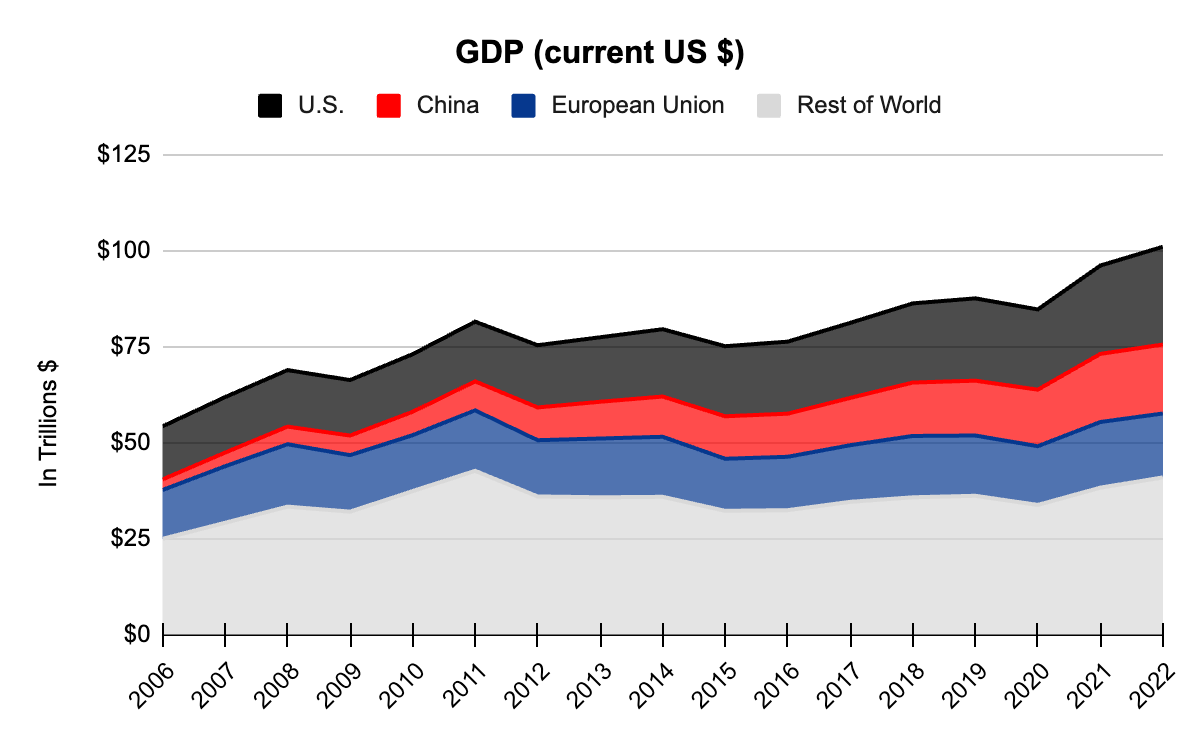
East West Bancorp is a financial bridge between China and the US and I believe some risks are smaller now than they were 15 years ago in 2007 when China's GDP was a fraction of its current size. Despite rhetoric in headlines, I believe there will be ways in which the US and China will work together in the years ahead now that China is too big to ignore. The World Bank shows how China's GDP has increased prodigiously from 2006 to 2022:
China's GDP (Author's spreadsheet based on numbers from the World Bank.)
The 1Q22 call featured a question about China from Ebrahim Poonawala of BofA ( BAC ). Deglobalization was brought up along with the risk of the US-China relationship deteriorating. CEO Dominic Ng pointed out that at the time, the combined China and Hong Kong loan portfolio was only 5% of total loans. He also explained how East West always finds opportunities in the US-China landscape when other banks shy away (emphasis added):
In 1991 - so we doubled our size during the savings and loan financial crisis. In 2009, we doubled our size during the global financial crisis. While today, we weren't able to just double our size in one year, but since the Trump administration started taking the reins in the US in 2017 to today, we doubled our size also. But we doubled - we took a little bit longer, but we doubled our size organically. So all I'm trying to get at is that East West Bank always will find a way to grow our business. And we have history to demonstrate that in 30 years.
Saying they understand risks involved in the US-China relationship better than anyone, CEO Dominic Ng went further in the call, claiming they are confident about their position (emphasis added):
And the key thing for us when we get down to the end is that - we are a bank that has a very unique value proposition. We understand that business and we have shown for many years and have proven for many years we know how to navigate through this US-China relationship and continue to be able to have sustainable growth. And we feel very confident that in the next many years we'll continue to - we'll be able to outperform our peer banks because of this unique value proposition.
Per a September 6th FT article , iconic investor Li Lu is from China. I think Li Lu and the management at East West know more about the risks with China than the average investor in the US. The FT article says Li Lu's Himalayas firm currently manages $14 billion of assets and we see from Whale Wisdom that they bought 2,296,300 shares of East West in 1Q23 plus another 480,051 shares in 2Q23.
I am optimistic that East West Bancorp will continue to do a good job navigating the various risks with China and find opportunities that other banks don't recognize.
Silicon Valley Bank ("SVB") Type Interest Rate Risks
I think about the securities portfolio risk we saw at SVB leading up to their March failure relative to the securities portfolio risk we see at East West today. Banks have held-to-maturity ("HTM") securities and available-for-sale ("AFS") securities. HTM securities are shown on the balance sheet based on amortized cost as opposed to fair value. A March 2023 article by Sandy Peters from the CFA institute makes the point that fair value is important (emphasis added):
Sophisticated investors adjust the value of a bank's balance sheet for fair values , and in periods of stress, more attention should be paid to the balance sheet and cash flows. HTM only delays the recognition of these realities and - as I noted in the above 2009 quote - helps investors see the value of the company rather than ensure it stays around because of an inability to discern the real economics. Hence, held-to-maturity becomes hide-until-maturity - until the jig is up and an SVB-style bank run breaks out.
I agree that investors should view the balance sheet through more than one lens. If a bank can truly hold HTM securities to maturity then the GAAP balance sheet figures have merit. However, it also makes sense to look through the fair value lens - especially when evidence shows periods of stress are ahead. In an April memo from Brookfield Corporation's Oaktree ( BN ), Howard Marks explained how SVB failed in March after the Fed raised rates such that HTM securities lost value (emphasis added):
In short order, the market value of SVB's bond holdings was down $21 billion. Word of the bank's losses caused depositors to start withdrawing their money . To meet the withdrawals, SVB had to sell bonds. Consequently, the bonds could no longer be considered HTM. Instead, they had to be categorized as [AFS].
SVB's 2022 10-K showed the $91,321 million GAAP amortized cost HTM securities figure in the balance sheet relative to the $76,169 million fair value figure. Their 2022 10-K broke down $2,533 million in unrealized AFS losses and $15,160 million gross HTM losses which were $15,152 million net. An April 2023 article by Edward Mendlowitz from Accounting Today talks about the fact that SVB's 2022 equity dropped to about $1 billion if we shifted from the GAAP lens to the fair value lens:
SVB's Dec. 31, 2022, balance sheet shows the cost of its HTM securities at $91.321 (these amounts are in billions) while parenthetically its fair value was $76.169. This represents an "unrecognized loss" of $15.152. Its stockholders' equity was $16.295. If for some reason the HTM securities were valued at fair value, its equity would pretty much be wiped out (brought down to $1 billion). However, GAAP does not provide for this.
Again, the 2022 GAAP lens for SVB showed $16,295 million in equity based on $211,793 million in assets less $195,498 million in liabilities. The HTM fair value lens was drastically different with just $1,109 million in equity based on $196,611 million in assets less $195,498 million in liabilities. The combined losses above of $2,533 million on the AFS side plus $15,160 million on the HTM side were also enormous relative to the earning power of SVB. They had net income available to common shareholders of $1,191 million in 2020, $1,770 million in 2021 and $1,509 million in 2022.
East West Bancorp also has unrealized AFS and HTM losses but they are much smaller than the SVB losses relative to the balance sheet and earnings power. Per the 2Q23 East West balance sheet, the difference between using the GAAP amortized cost figure of $2,976 million for HTM securities versus the fair value figure of $2,441 million for HTM securities is relatively minor relative to the GAAP total assets figure of $68,533 million.
East West's 2Q23 10-Q shows unrealized HTM and AFS losses for 2Q23 were less than 4Q22 but more than 1Q23. The 2Q23 figures are $834 million on the AFS side and $535 million on the HTM side. Again, these figures are relatively small compared to what we saw at SVB. The 2Q23 GAAP lens for East West Bancorp shows $6,462 million in equity based on $68,533 million in assets less $62,071 million in liabilities. The view through the HTM fair value lens is somewhat close with $5,927 million in equity based on $67,998 million in assets less $62,071 million in liabilities. The combined HTM and AFS losses at East West Bancorp are also manageable relative to earnings power. We saw above that East West Bancorp had TTM net income available to common shareholders of $1,266.5 million through June 2023.
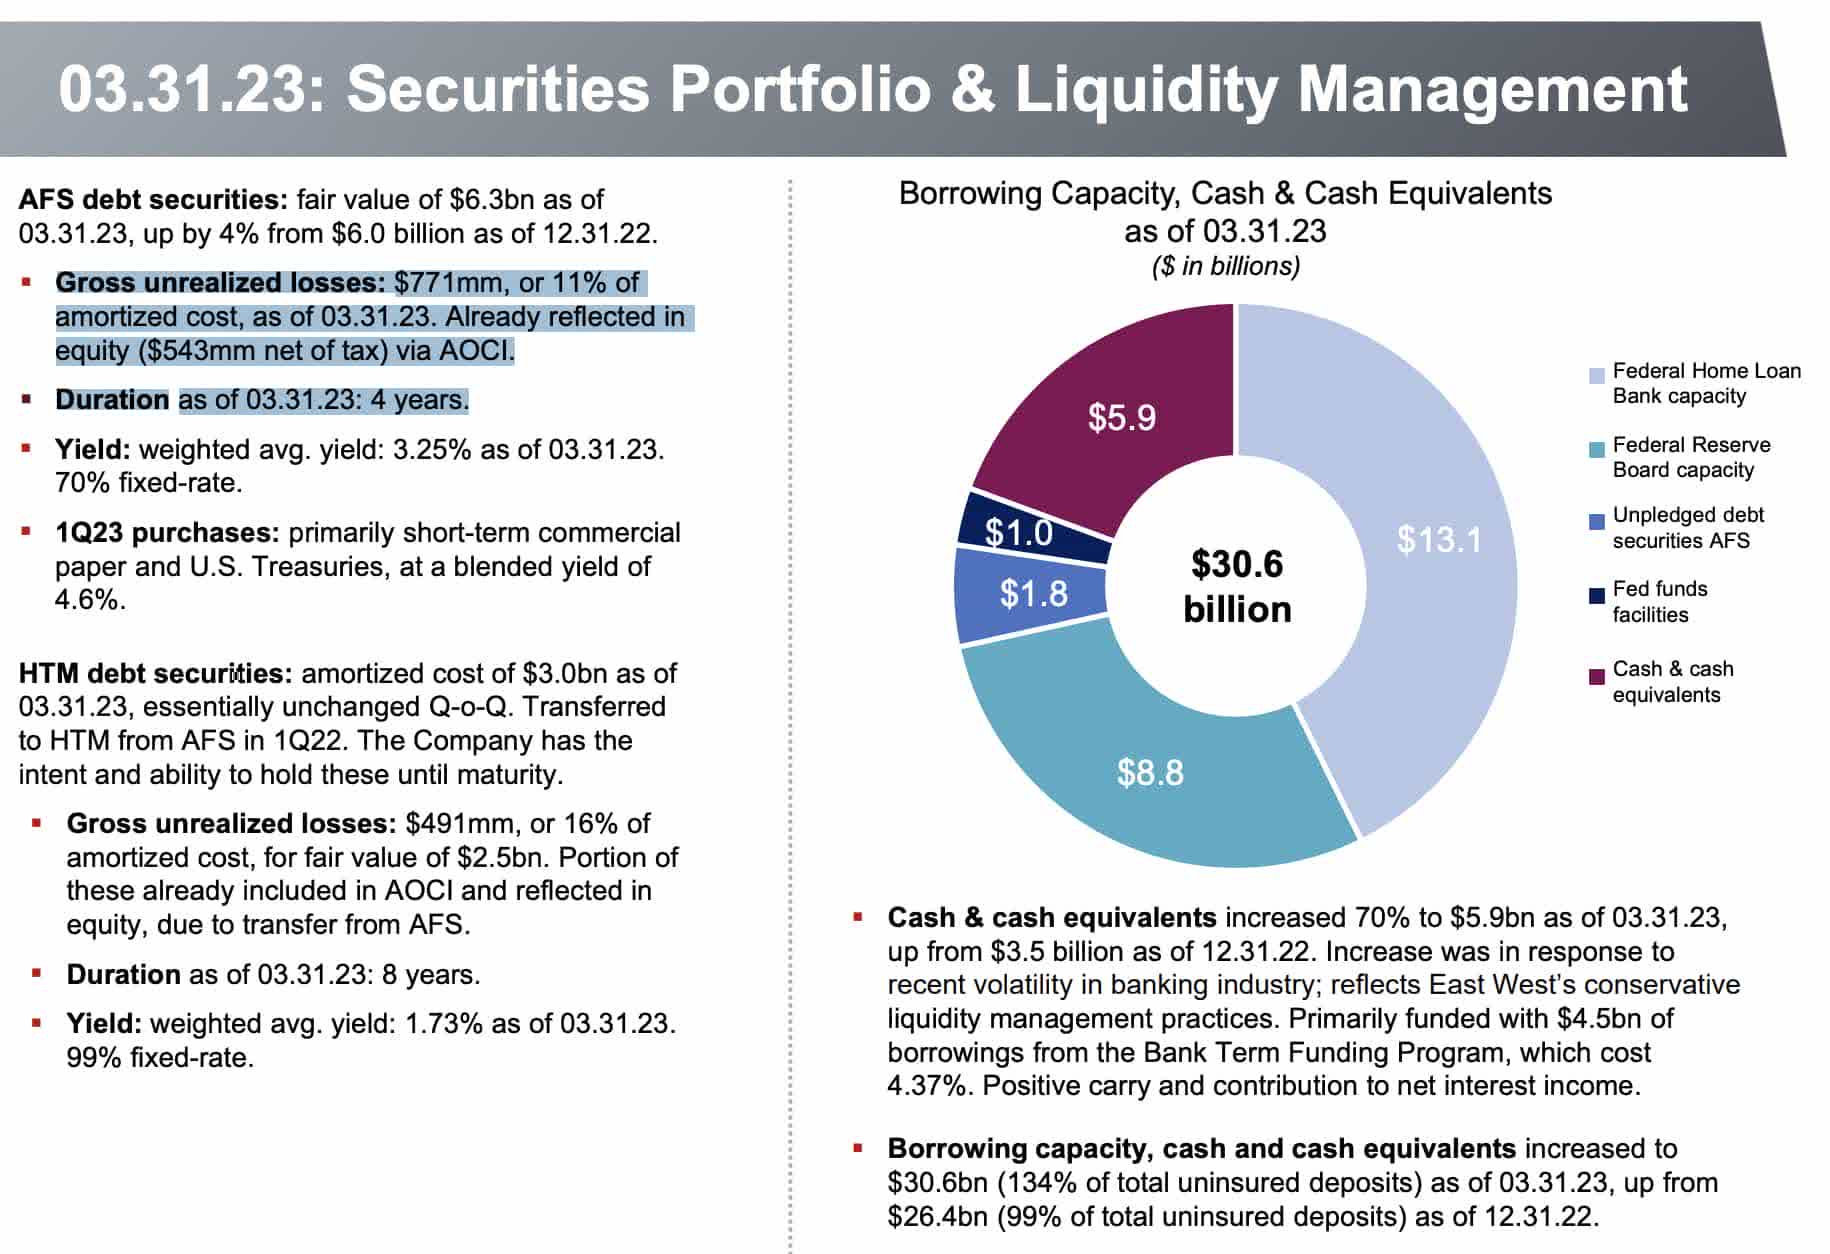
East West's 1Q23 presentation shows unrealized AFS losses of $771 million plus unrealized HTM losses of $491 million:
In the 1Q23 earnings call , CFO Irene Oh said East West has the ability and intent to hold HTM securities to maturity and she went on to say many actions have been taken since the failure of SVB in March:
First, we increased our on-balance sheet liquidity. Our cash and cash equivalents increased 70% to $5.9 billion as of March 31, up from $3.5 billion as of December 31. This increase was primarily funded with $4.5 billion in borrowings to the Bank Term Funding Program at a cost of 4.37%. Thus, the on-balance sheet liquidity has provided a positive carry and contribution to NII. Also, we swiftly added to our borrowing capacity by pledging additional assets for the Federal Reserve and the FHLB San Francisco. Our total borrowing capacity plus cash and cash equivalents were $30.6 billion as of March 31, and is equivalent to 134% of our total uninsured and uncollateralized deposits.
In summary, I think unrealized HTM and AFS losses at East West Bancorp are under control as they look nothing like the numbers we saw in SVB's 2022 10-K.
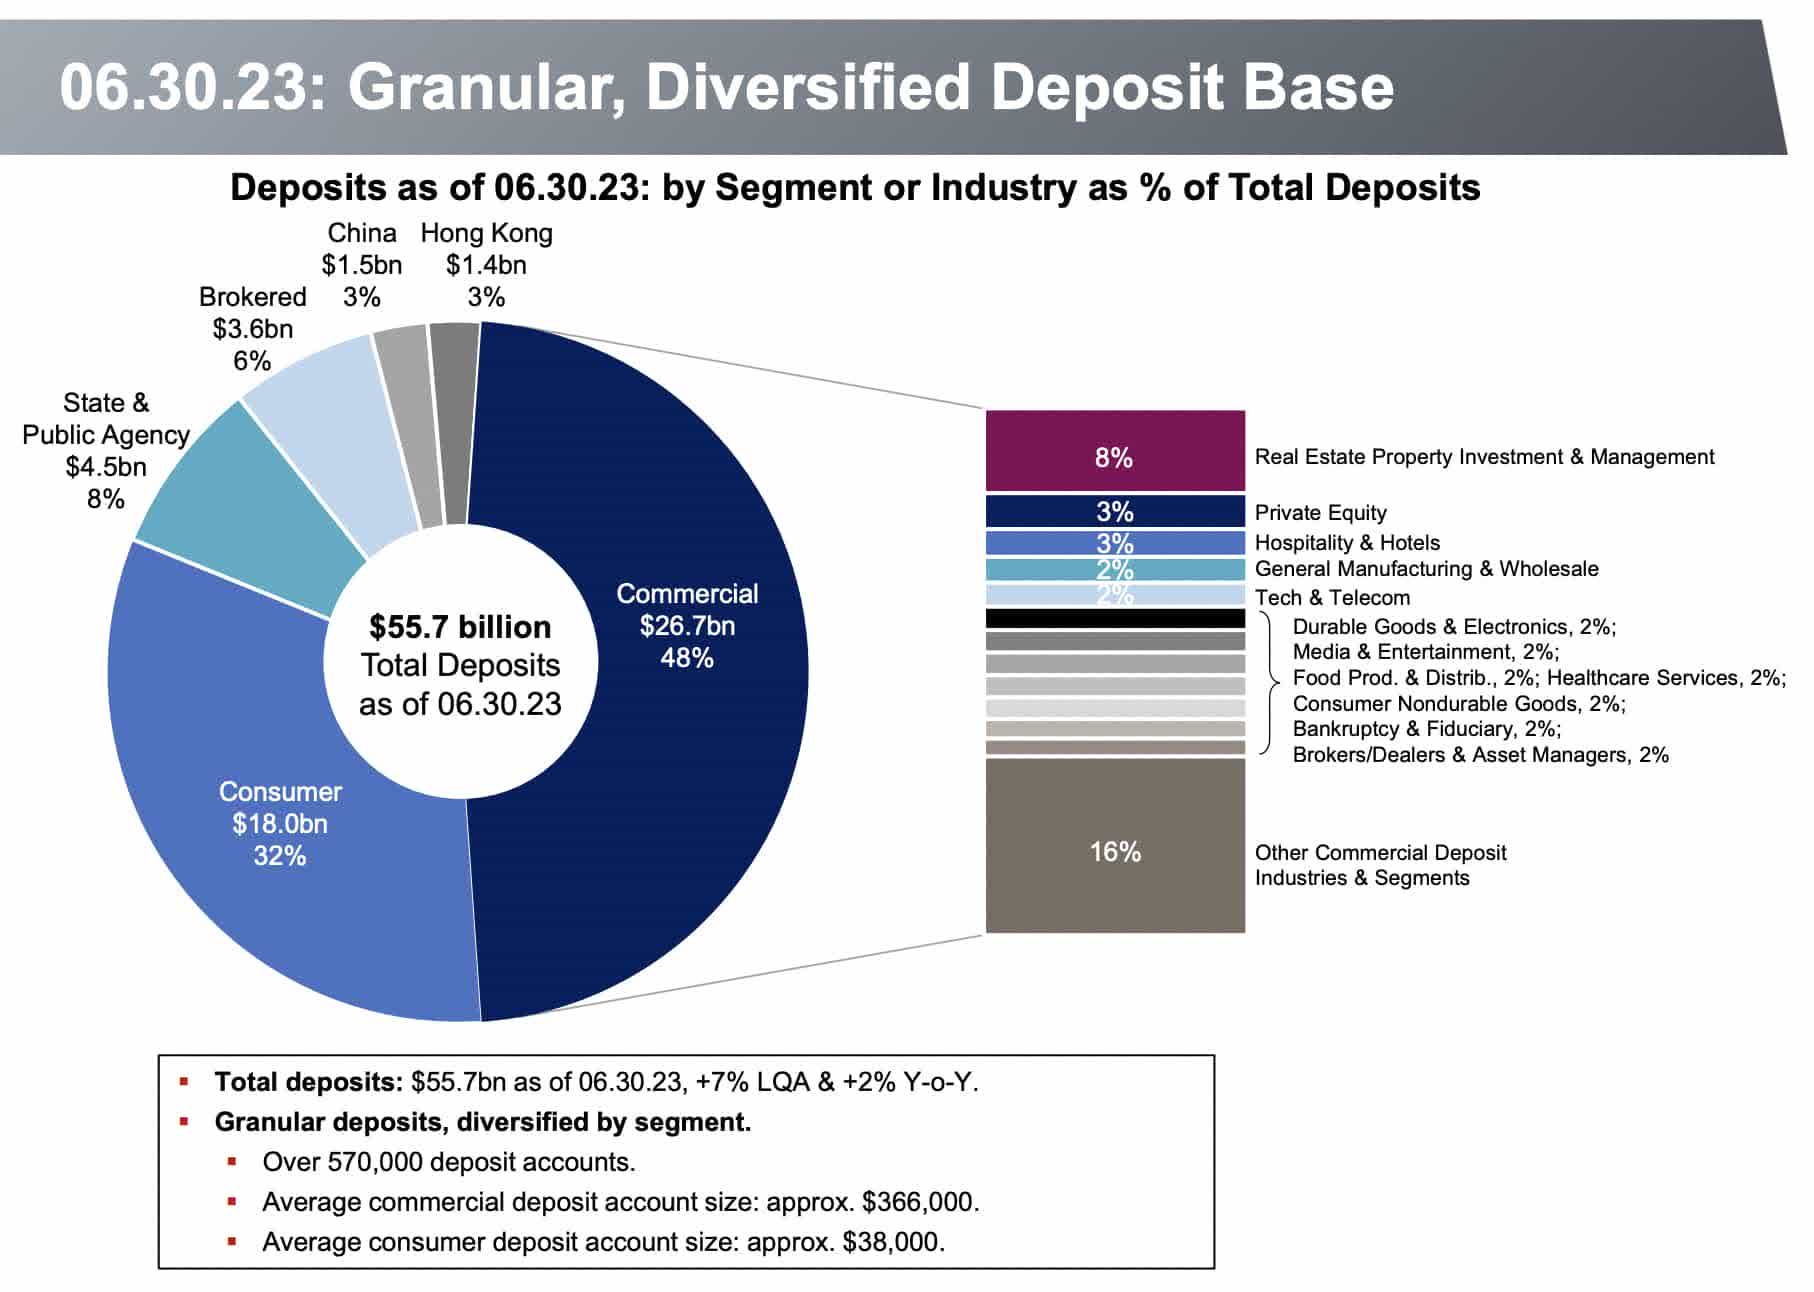
One of the reasons SVB failed is because the vast majority of their deposits were uninsured so customers pulled out their money quickly when bad news surfaced. Their 2022 10-K showed uninsured deposits of $151.5 billion which was the bulk of the $173.1 billion deposit figure on the balance sheet. The East West Bancorp 2Q23 10-Q shows their uninsured domestic deposits have declined from 51% at the end of December to 40% at the end of June. In other words, when we exclude collateralized and affiliate deposits, only $21,472 million of East West's $53,153 million domestic deposits are uninsured. Per the 2Q23 balance sheet, the $53,153 million figure for domestic deposits above makes up the overwhelming majority of the overall deposits figure of $55,659 million. East West's 2Q23 presentation shows a diverse deposit base with over 570,000 accounts. The average commercial deposit account is $366 thousand and the average consumer deposit account is $38 thousand. China's portion of deposits is only $1.5 billion and Hong Kong's portion is a mere $1.4 billion:
Bank runs due to factors such as interest rates are always a concern but I am optimistic that East West Bancorp management will continue to keep this risk under control.
Lehman Brothers Type Financial Crisis Risks
The last 10-K from Lehman Brothers before they failed came from 2007 and it showed the liabilities of $668,573 million were 29.7x more than the equity of $22,490 million. Also, Lehman Brothers was doing Repo 105 maneuvers with the accounting for their balance sheet such that the true economic ratio was even worse. Over the years this ratio has looked much better for East West as it tends to be less than 10x. In addition, US regulators have put in new standards since the financial crisis and East West is well clear of them. The Basel III table in the 2022 East West 10-K shows they're well capitalized:
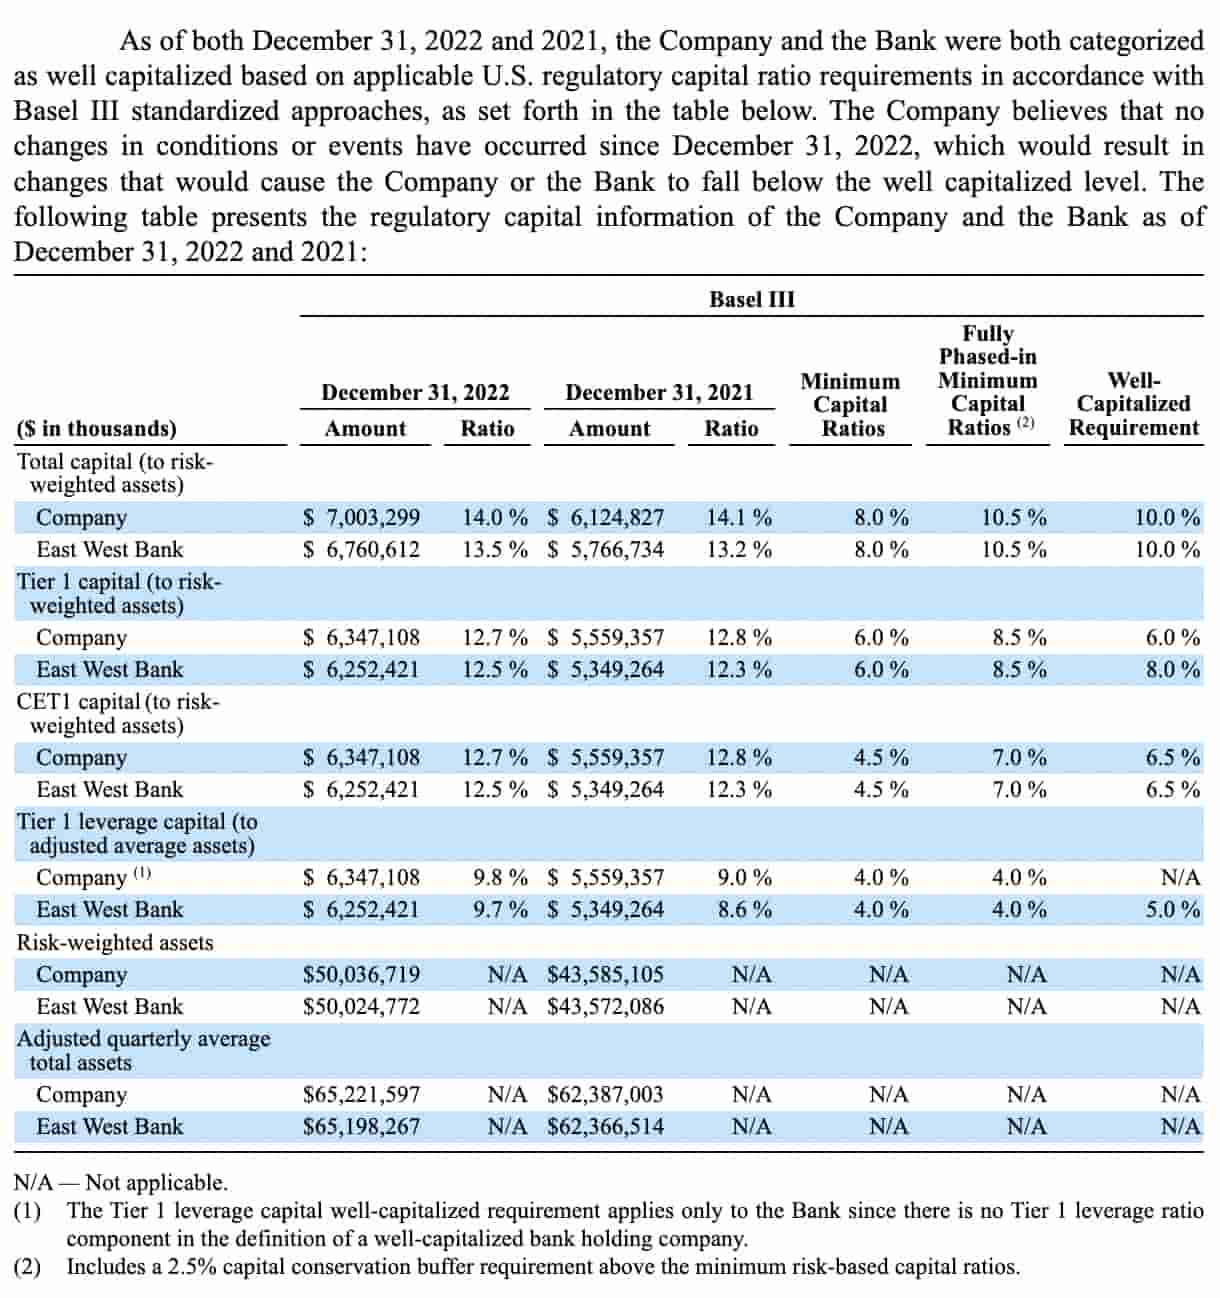
The 2022 East West call report gives us some background behind the above tier 1 capital figure of $6,252,421 thousand in the 2022 10-K above. The second part of the call report balance sheet gives us the items for the stock component:
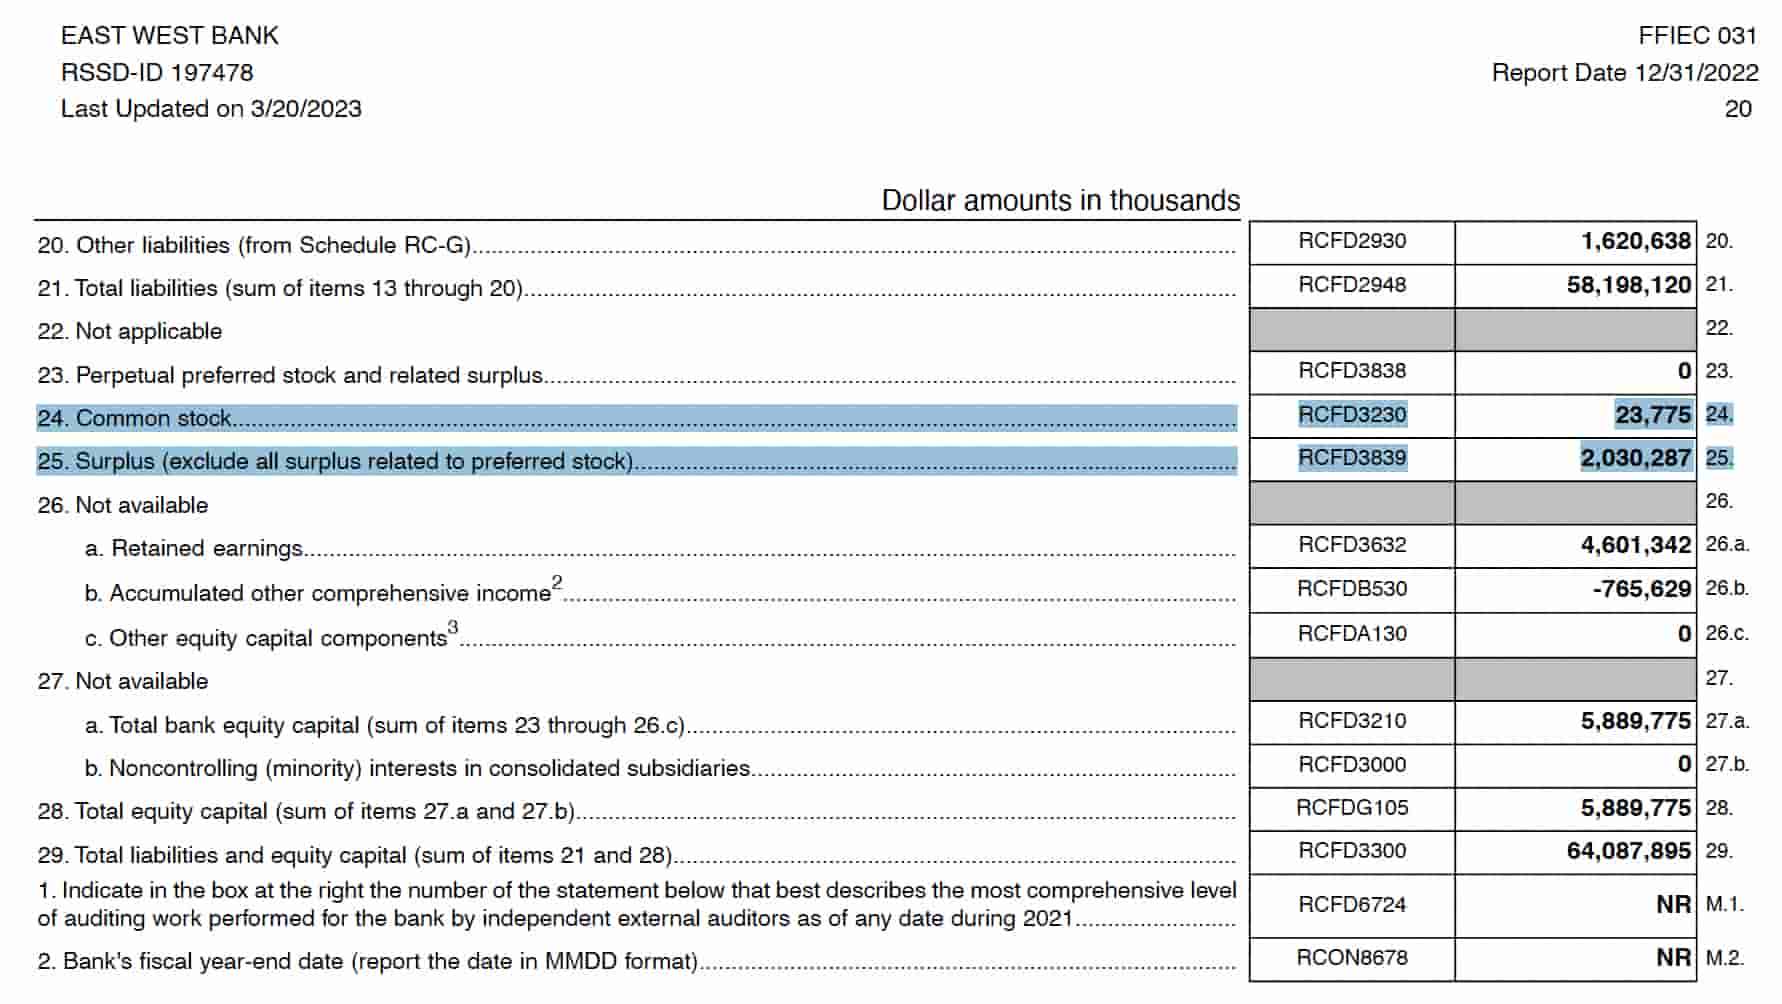
We look at the capital component and ratio table to arrive at the $6,252,421 thousand tier 1 capital figure. The stock consideration from the above balance sheet is $2,054,062 thousand or $23,775 thousand common + $2,030,287 thousand surplus. The retained earnings consideration is $4,686,823 thousand which is $85,481 thousand more than the $4,601,342 thousand retained earnings figure from the call report balance sheet above and there is a footnote as follows:
Institutions that have adopted ASU 2016-13 and have elected to apply the 3-year or the 5-year 2020 CECL transition provision should include the applicable portion of the CECL transitional amount or the modified CECL transitional amount, respectively, in this item.
Here is the capital component and ratio table which arrives at the $6,252,421 thousand regulatory tier 1 capital figure. In other words, 5,975,256 - 465,547 - 1,634 + 594,503 + 49,530 + 100,313 equals 6,252,421 in thousands:
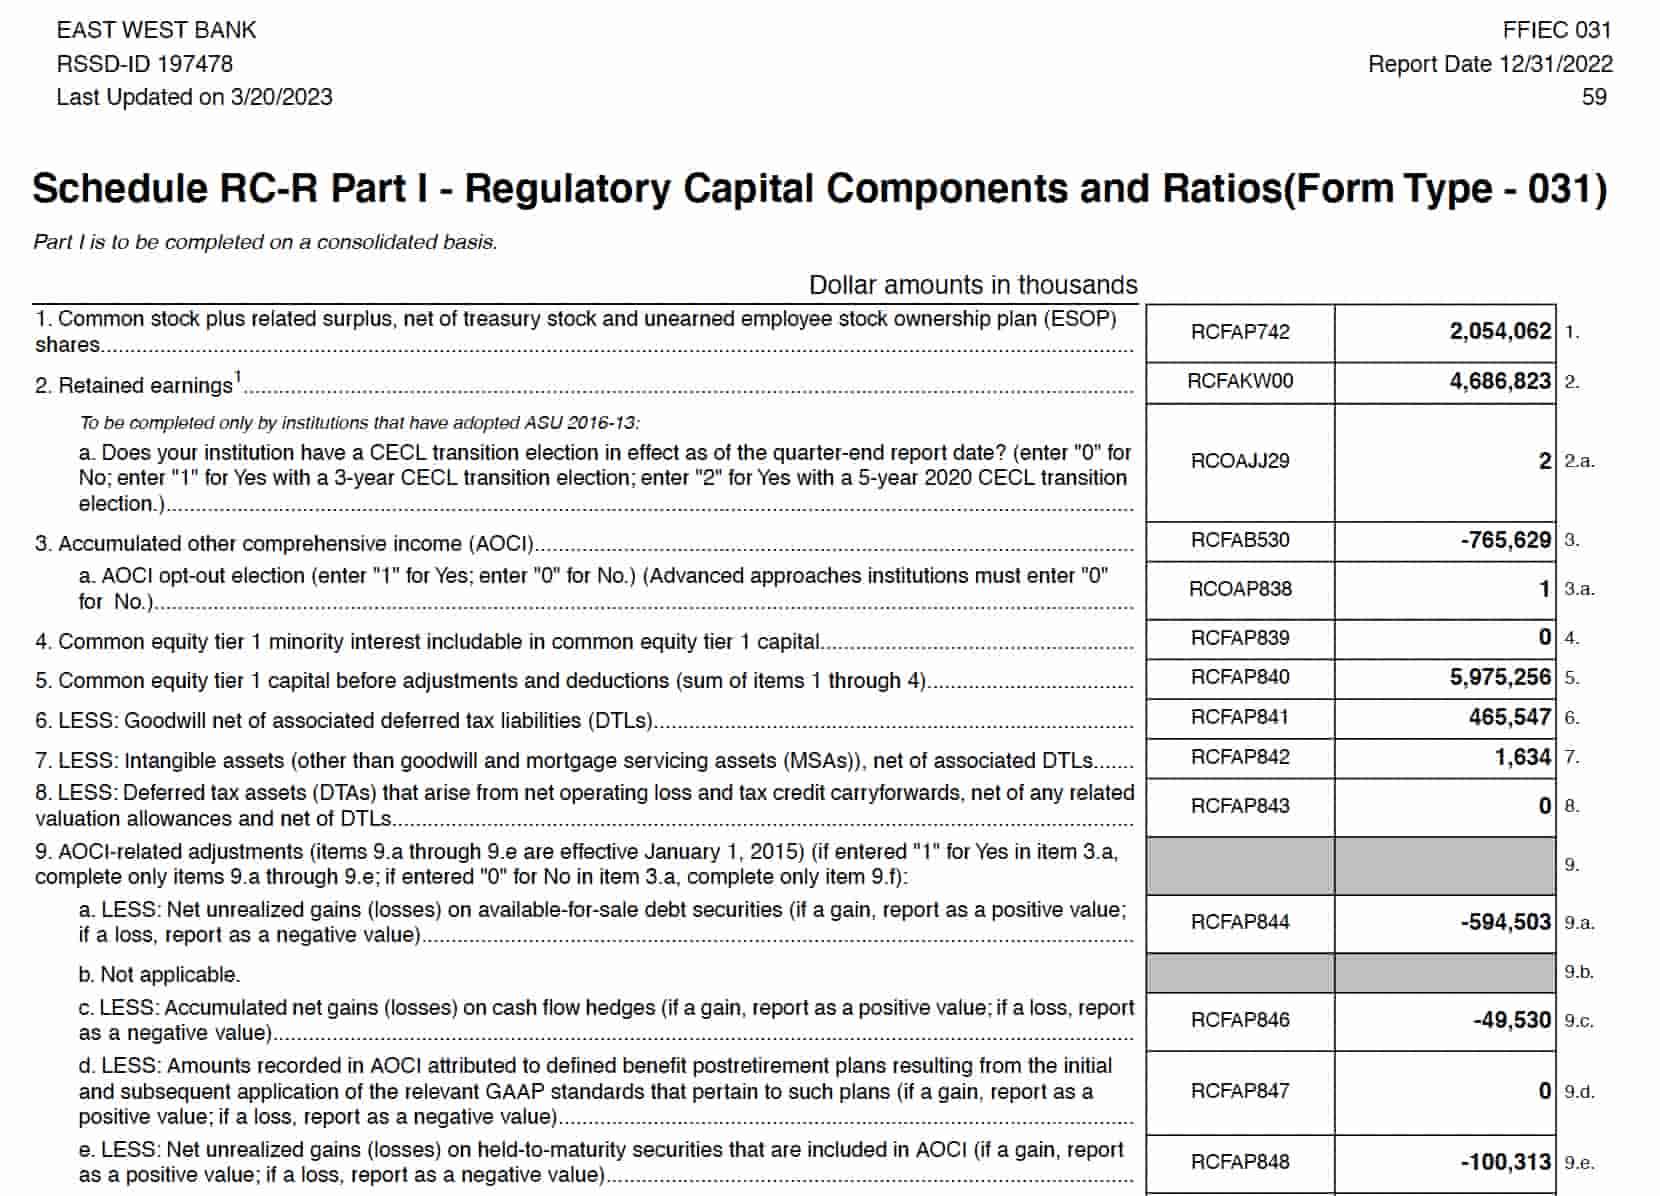
East West is well above the regulatory thresholds that were put in place after the financial crisis and I believe it is unlikely for them to encounter the degree of problems we saw at Lehman Brothers.
Other Risks
A September 6th WSJ article warns about the dangers of the current commercial real estate market. Slide 8 of East West's 2Q23 presentation breaks down the $19.9 billion CRE portfolio, showing $2,354 million for office and $4,203 million for retail. These are further broken down in slides 8 and 9, respectively, where it says the number of loans over $30 million are only 6 and 8, respectively.
Valuation Specifics
East West is a company that has been valued at more than 10x earnings for most of the last decade per BigCharts. This multiple should come down a reasonable amount now that we are in a higher interest rate environment but the degree to which it has come down is drastic:
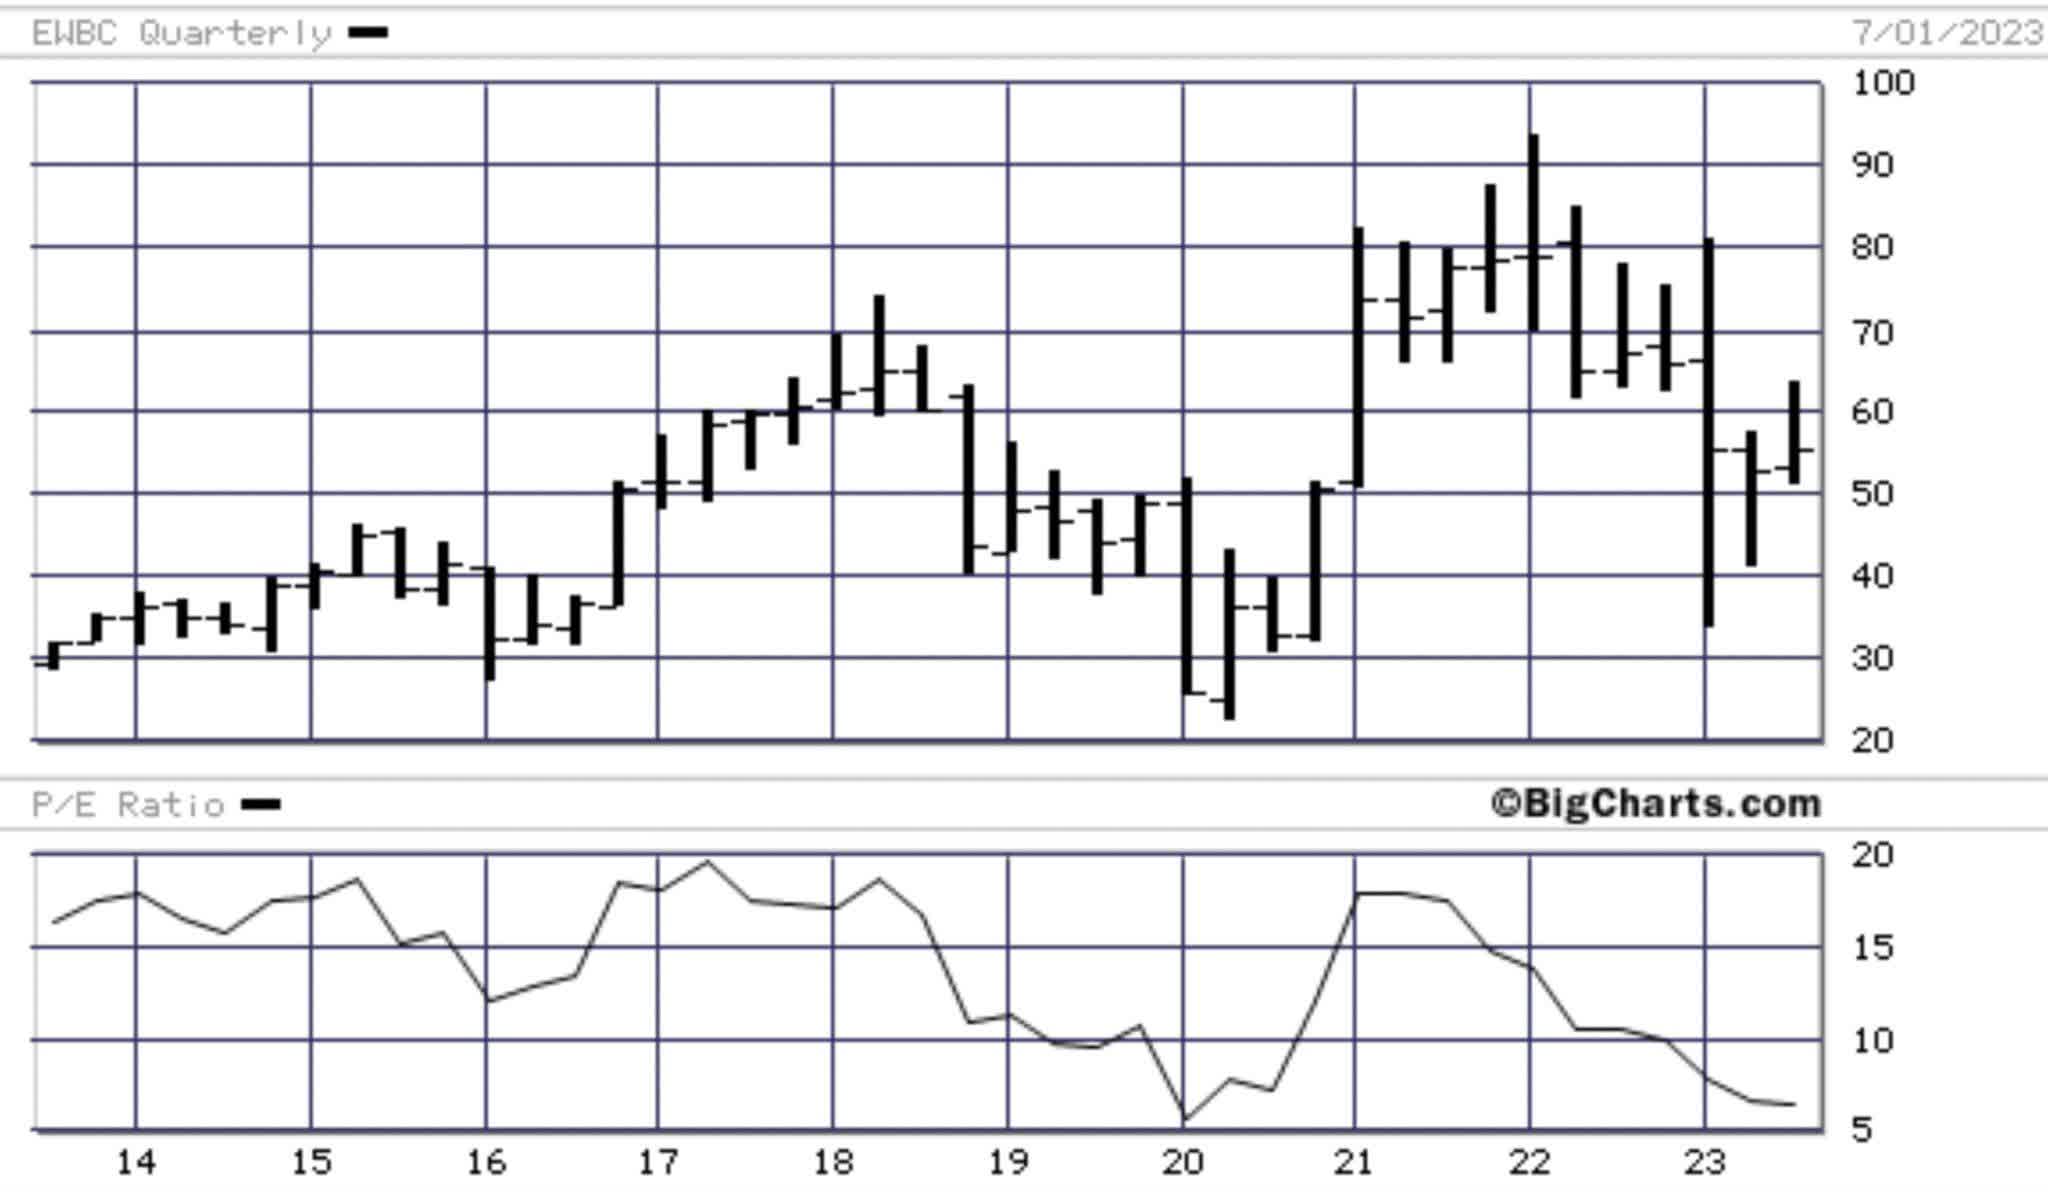
Again, TTM net income available to common shareholders through June 2023 is $1,266.5 million. Anything can happen in the short term but I'm optimistic that long-term EPS growth will continue to be large like it has the last decade. Per thoughts shared above, I think risks are manageable. Looking through a long-term lens, I think East West Bank is worth 10 to 12x net income which is $12.7 to $15.2 billion.
Per the 2018 annual report, East West's market cap was just $229 million when they went public in February 1999. The 2Q23 10-Q shows 141,483,668 shares outstanding as of July 31st. Multiplying by the August 30th share price of $53.43 gives us a current market cap of $7.6 billion. The market cap is much lower than my valuation range so I think the stock is a buy for long-term investors.
Disclaimer: Any material in this article should not be relied on as a formal investment recommendation. Never buy a stock without doing your own thorough research.
For further details see:
An Investment Case For East West Bancorp