VTI - An Update On What's Jamming The Fed's Transmission (Mechanism)
2023-06-26 12:47:02 ET
Summary
- Three factors have delayed the impact of the Fed's interest rate increases: the decline in gas prices, and pandemic-related supply chain issues in vehicle production and housing construction.
- The U.S. economy has been able to avoid a downturn due to these factors, but the challenges will increase as the year progresses.
- Additionally, the historical impact of leading manufacturing indicators has lessened as manufacturing plays a sharply reduced role in the U.S. economy.
- The downturn is likely only delayed, not denied, as these factors begin to fade and the impact of the Fed's interest rate increases takes hold.
Introduction
The Fed began a near-record rate of interest rate increases 15 months ago. Despite this, and despite almost all financial and manufacturing indicators having turned down for 8 to 18 months, no actual downturn has arrived, leading some to christen this the “Waiting for Godot” recession forecast.
It is the thesis of this article (and much of what I have written in the past 6 months) that three factors have created this logjam: (1) the sharp downturn in gas prices late last year; and pandemic-related supply chain backups in (2) vehicle production and (3) housing construction. An additional background factor is the sharp relative decline in the formerly decisive leading sector of manufacturing in the U.S. economy.
A fuller discussion appears below.
What’s jamming the Fed’s transmission (mechanism)
1. Gas prices’ steep decline in the 2nd half of 2022
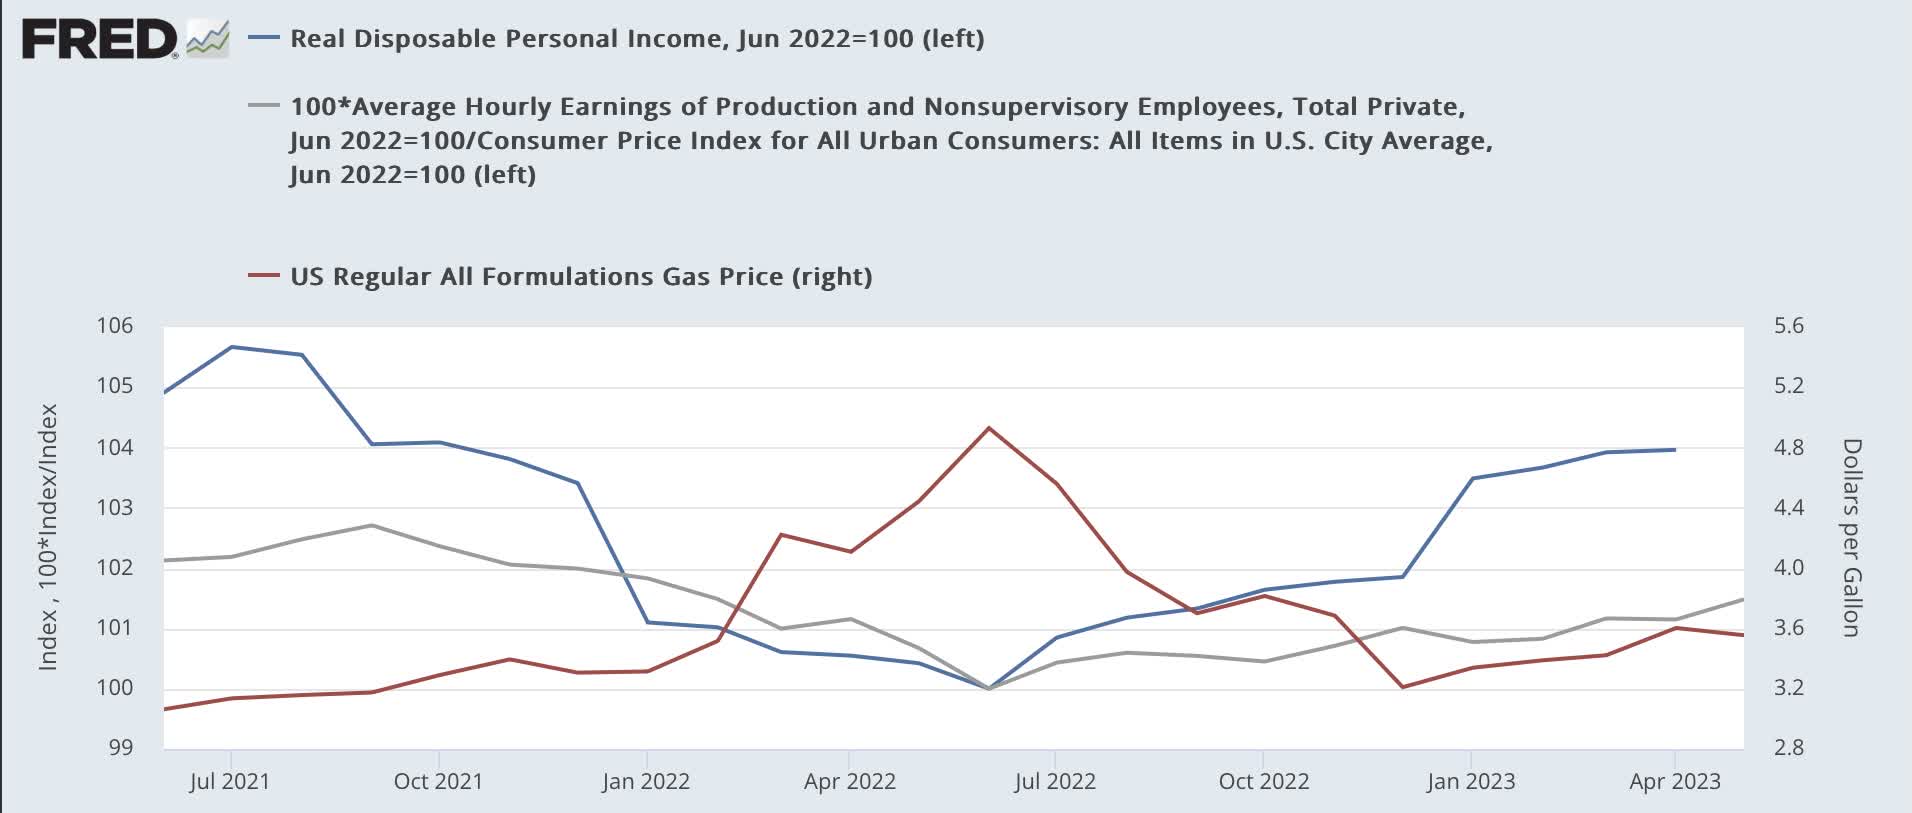
Gas prices went from $3.25/gallon to $5/gallon in the first half of last year due to Russia’s invasion of Ukraine. Then, particularly as Europe successfully weaned itself from Putin’s energy supplies, prices went right back down to $3/gallon last December. Since then, they’ve gradually increased back up to about $3.50/gallon.
Not coincidentally, almost every “real” measure of income and spending by U.S. consumers - 70% of the entire economy - turned higher. For example, below are real disposable personal income and real average hourly wages for non-managerial workers for the last 24 months, normed to 100 as of last June (left scale), compared with gas prices (right scale):
Real income and spending vs. gas prices (FRED)
It is in retrospect unsurprising that the U.S. economy stumbled, with 2 quarters of negative GDP, in the first half of 2022 as gas prices sharply increased. And it is no surprise at all that the economy got a tailwind thereafter from gas prices’ steep decline. Since June of last year, real average hourly wages are up 1.1%, and real disposable income is up 4.0%. It’s hard to develop a recession when consumers are doing that much better.
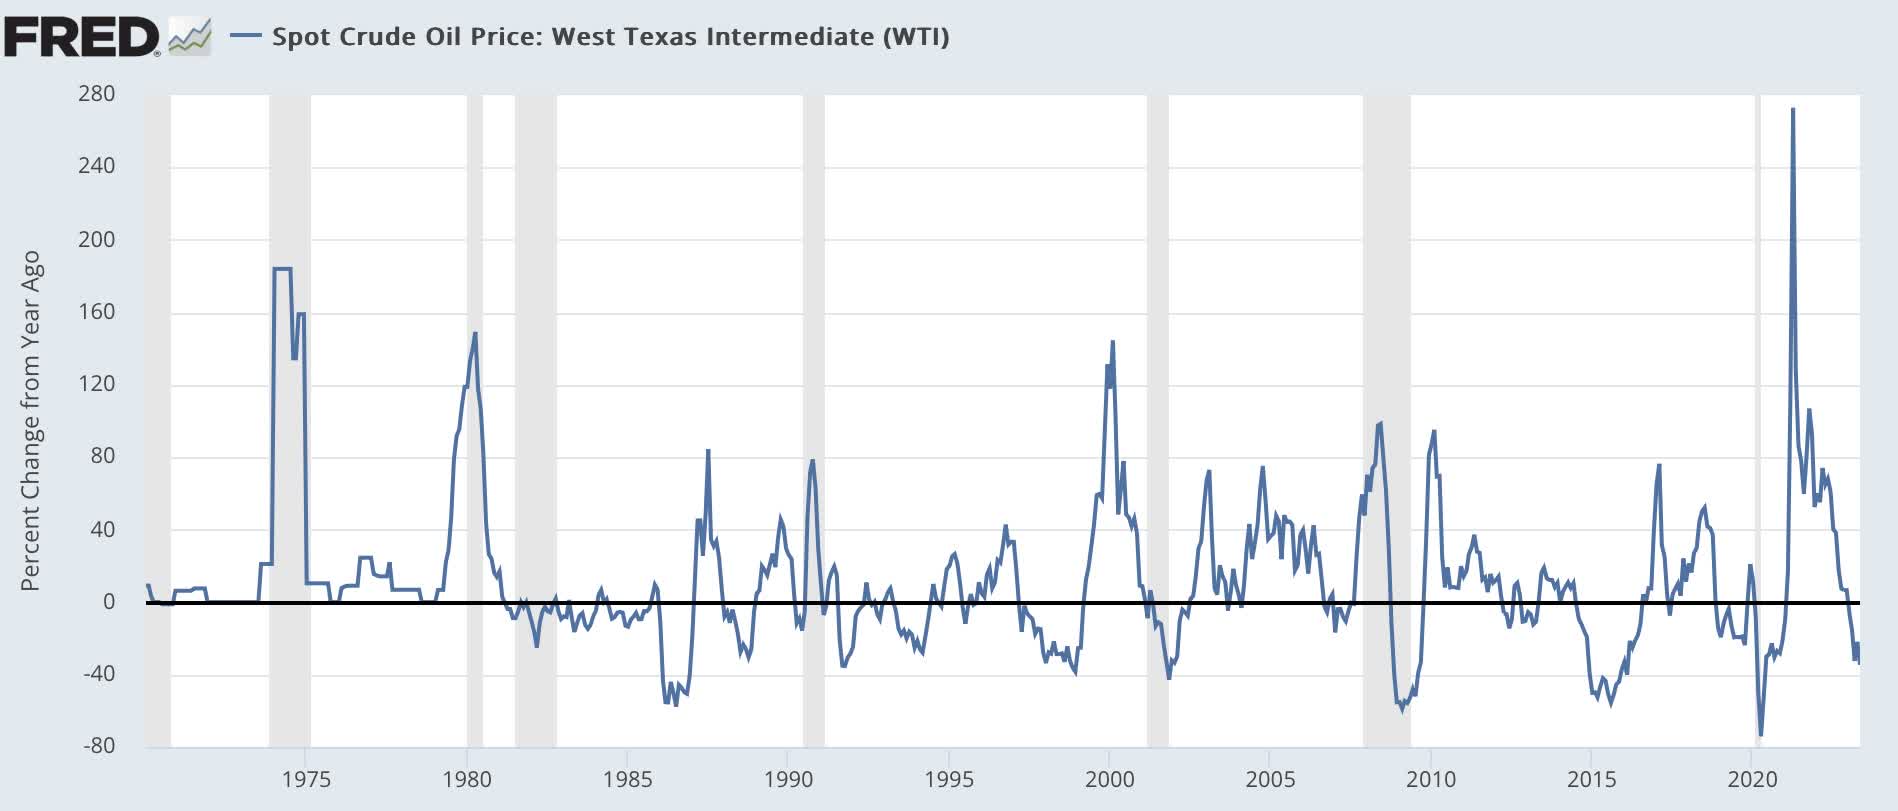
And indeed, in case your memory needs refreshing, big increases in energy prices have been associated with the onset of most of the U.S. recessions during the past half century, while big declines have been associated with their ending:
But the virtuous comparisons will become much more challenging as that big gift to consumers’ pocketbooks fades.
2. Pent-up demand for new motor vehicles
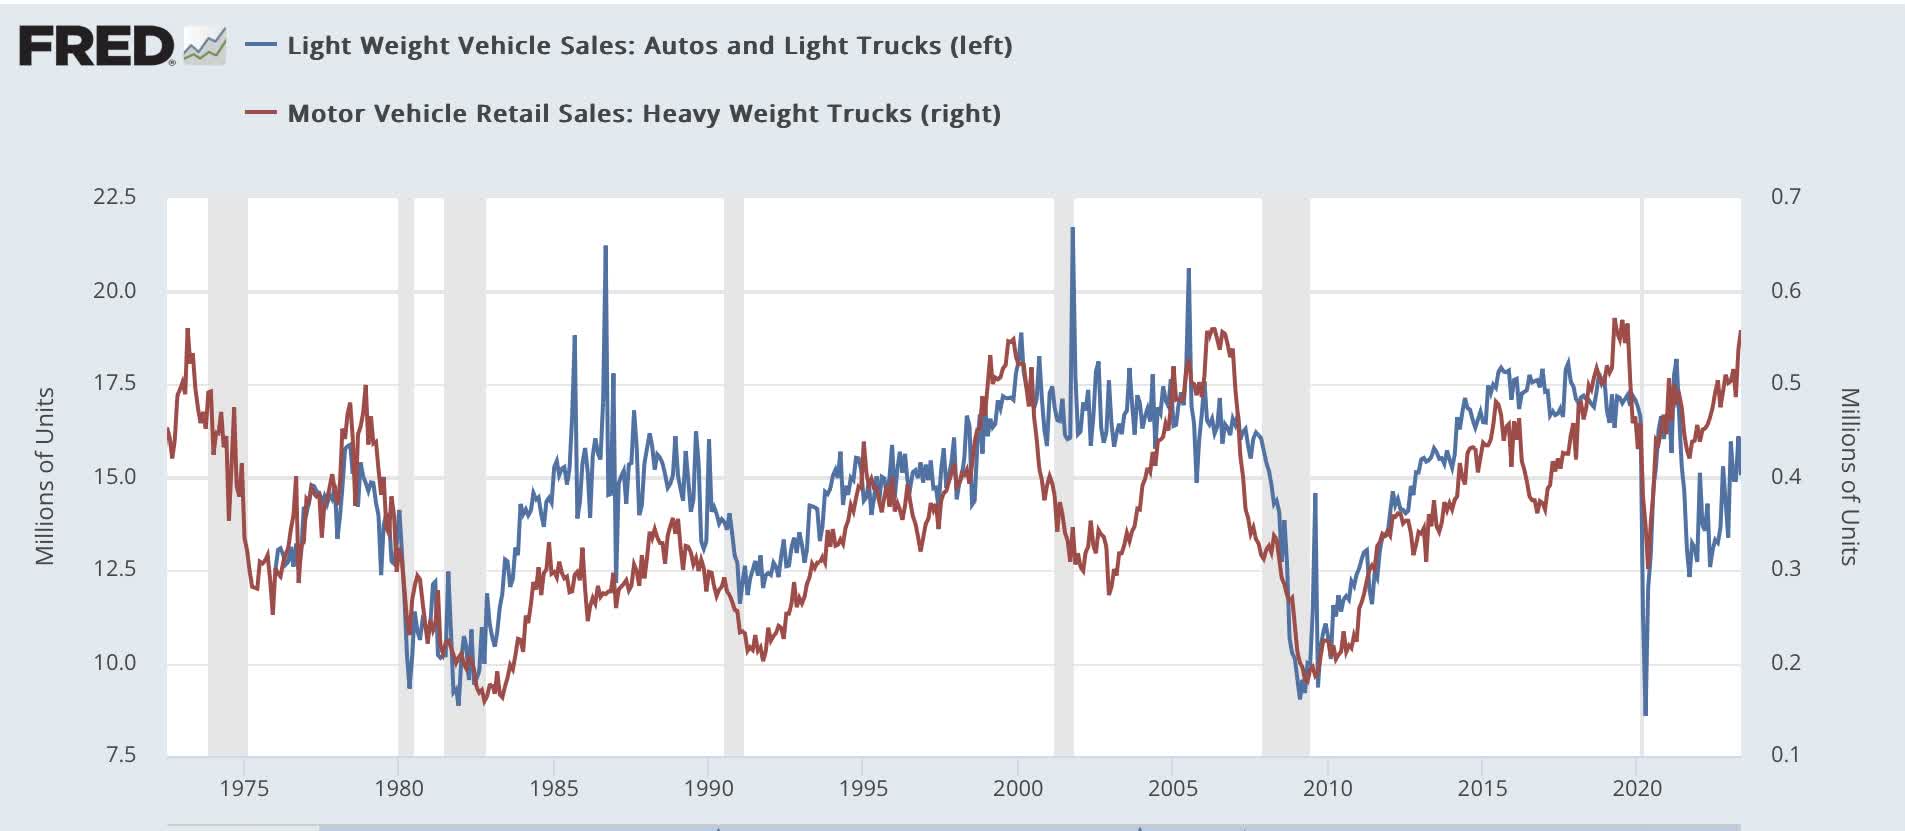
Consumer spending on motor vehicles has been a reliable if noisy leading indicator for recessions for the past 50 years, and spending on heavyweight trucks even better:
During expansions, production of motor vehicles has typically averaged between 15 to 18 million units annualized.
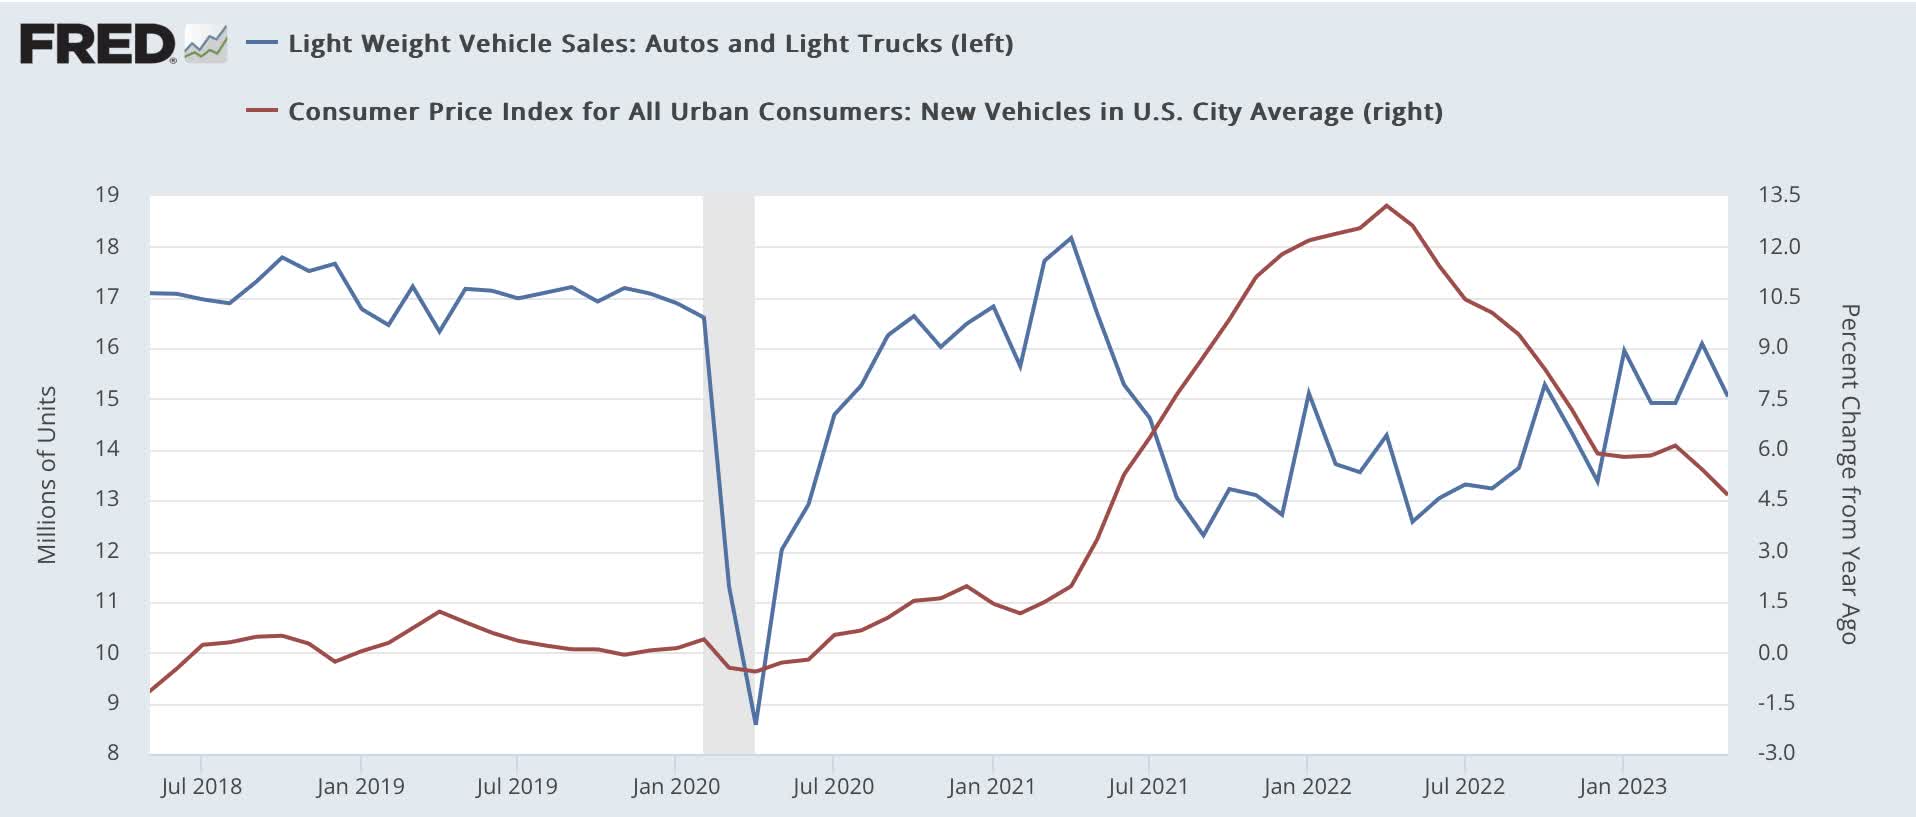
Due to overseas production issues, supply components for motor vehicles decline sharply in spring 2021, such that sales dropped to a miserable 12 million units annualized. Unsurprisingly, prices increased sharply, up as much as 13.2% YoY in April 2022:
Post-pandemic vehicle sales vs. YoY prices (FRED)
Those prices have remained, and continued even higher, albeit at a lower rate.
It is only since January of this year that sales of motor vehicles increased above 15 million units annualized. This addresses normal demand, but does not yet address the pent-up demand of 2020-22. There is still a cumulative shortfall on the order of 10 million+ vehicles that need to be produced to meet that pent-up demand. So long as consumers have increased income to spend, that demand will remain an economic tailwind, bucking the Fed’s attempts to tamp it down.
3. A logjam in housing construction
Another important sector that had pandemic-related supply shortfalls was in housing construction materials.
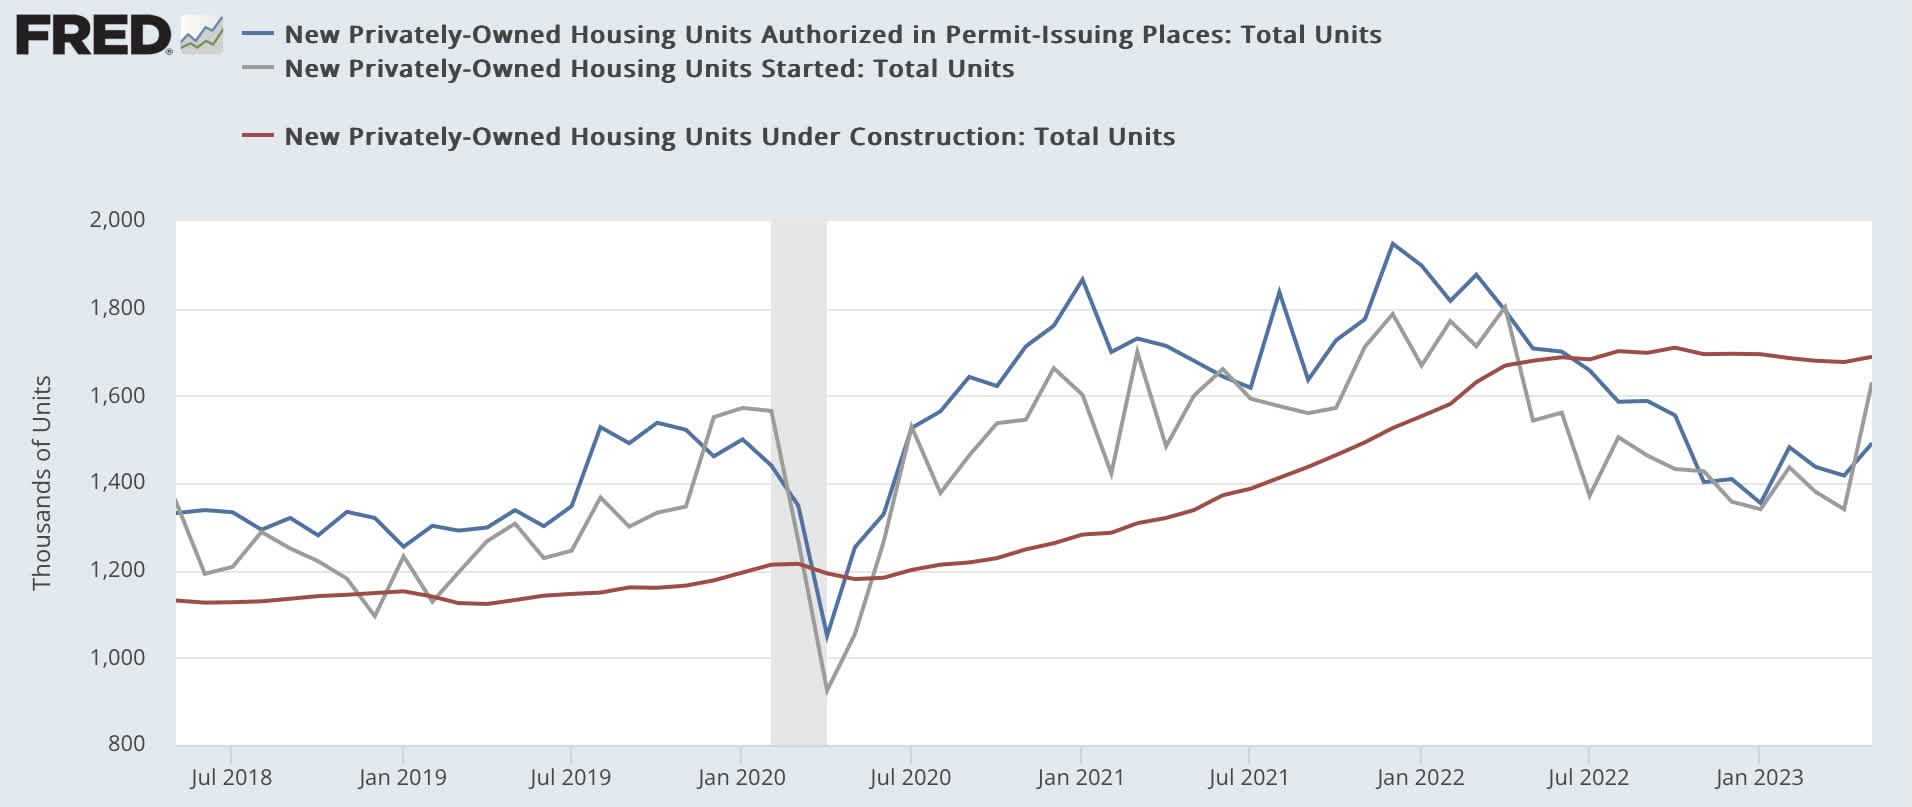
In 2019, housing permits had their best year of the entire 10+ year expansion, with as many as 1.5 million permits being issued on an annualized basis per month. The pandemic briefly ended that, but as soon as July 2020 new 10-year records in permits issued were being set, with permits rising to as high as 1.95 million annualized in December 2021, as the bond and mortgage markets began to anticipate interest rate increases:
Post-pandemic housing permits, starts, and consturction (FRED)
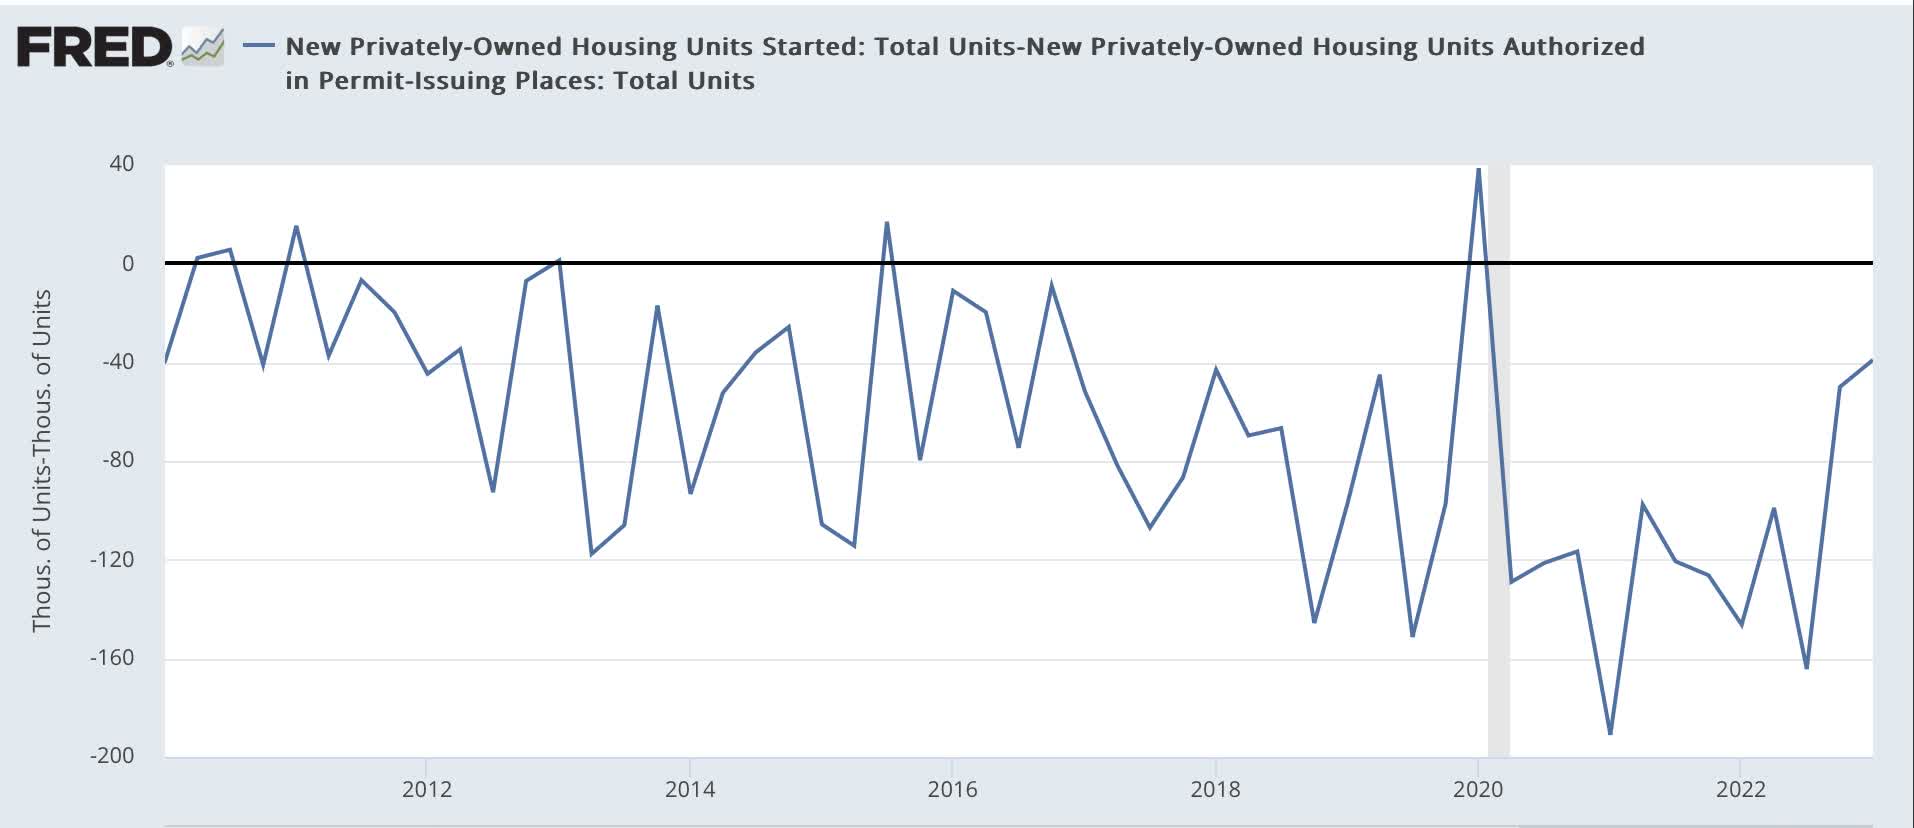
But housing starts lagged, as an average of over 100,000 fewer housing units were actually started compared with permits during 2020 through 2022:
Housing permitted minus construction (FRED)
Thus, as shown above, even though permits have declined sharply, and starts soon followed, the number of housing units under construction - the best measure of actual economic activity from this very leading sector - rose to an all-time record in 2022, and is off less than 2% since then.
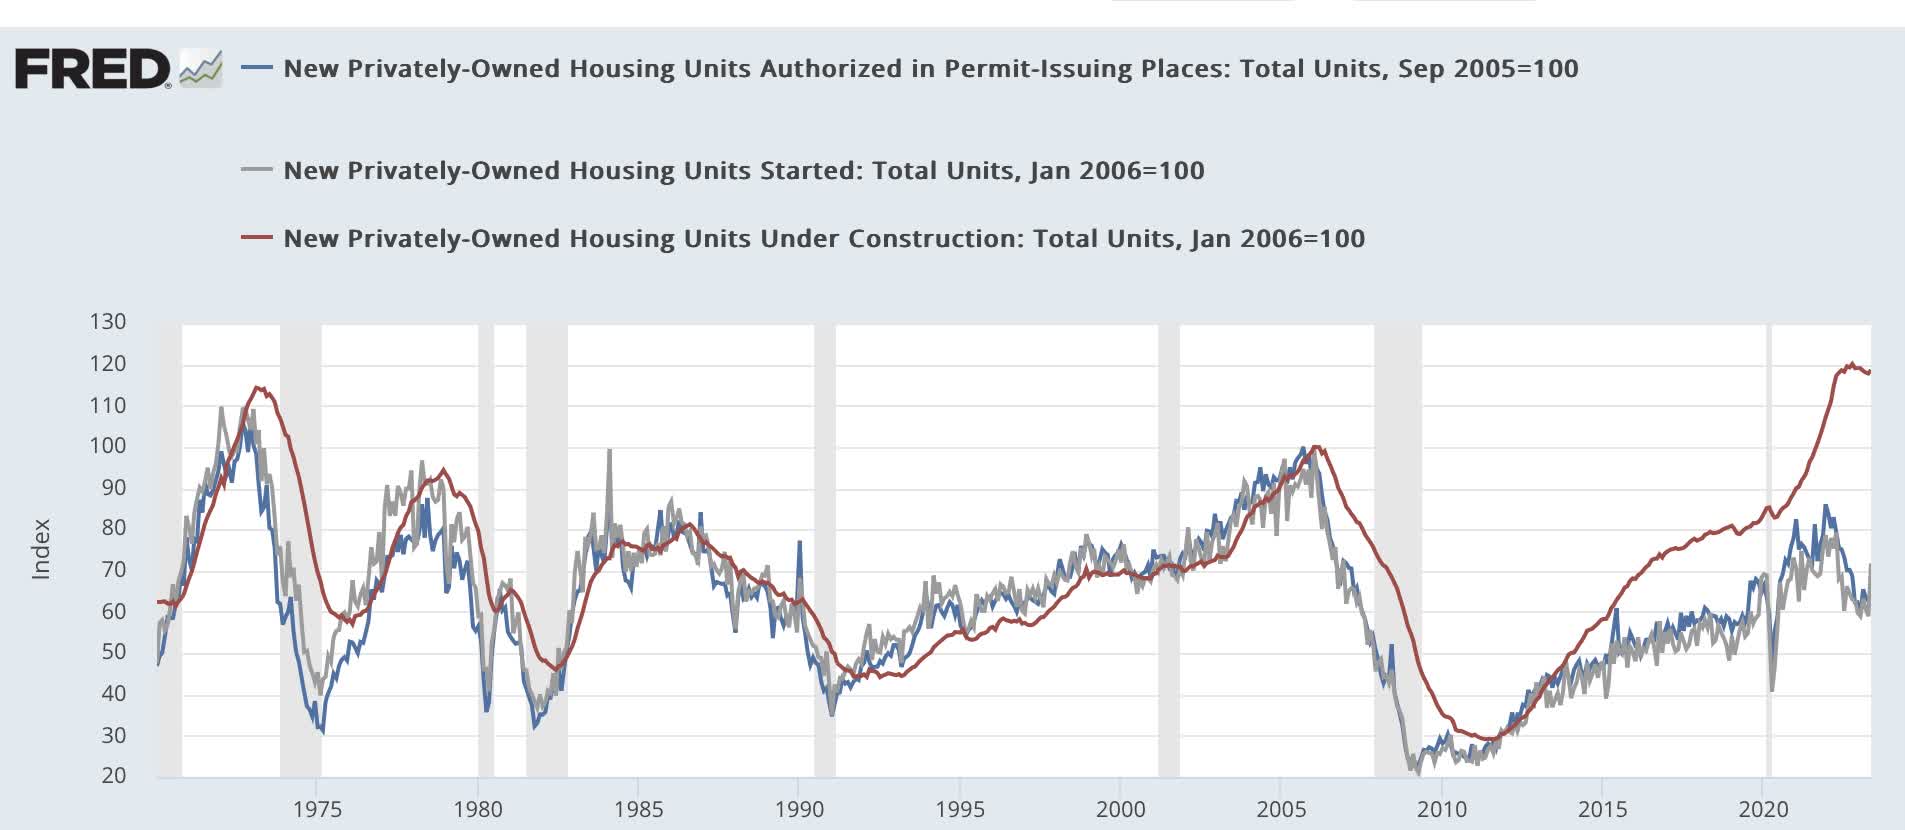
An extended graph of the above for the entire 50-year history before the pandemic, normed to 100 as of the peak of the 2000s housing bubble, shows that construction never falls quite as much as permits during the downturns. And although this is harder to make out, construction ramps up very quickly in upturns, but turns down more slowly during downturns:
Historical housing permits, starts, and construction (FRED)
Construction has usually peaked 4 to 6 months after permits, with the notable exceptions of the 1980s and the present. But the downturn in construction has normally taken about 25%-40% longer than permits to reach bottom. And the total downturn in construction has with several important exceptions, notably in the 1980s, been between 50%-75% of the downturn in permits.
Quite simply, for all of the Fed’s sharp interest rate increases, the real economic production in the housing sector has barely been touched.
A note on the secular downturn in the importance of manufacturing
This isn’t so much a special consideration in our current economy, as it is a background condition very much affecting the traditional array of leading indicators.
Ever since World War 2, various indexes of leading indicators have featured several manufacturing elements, notably:
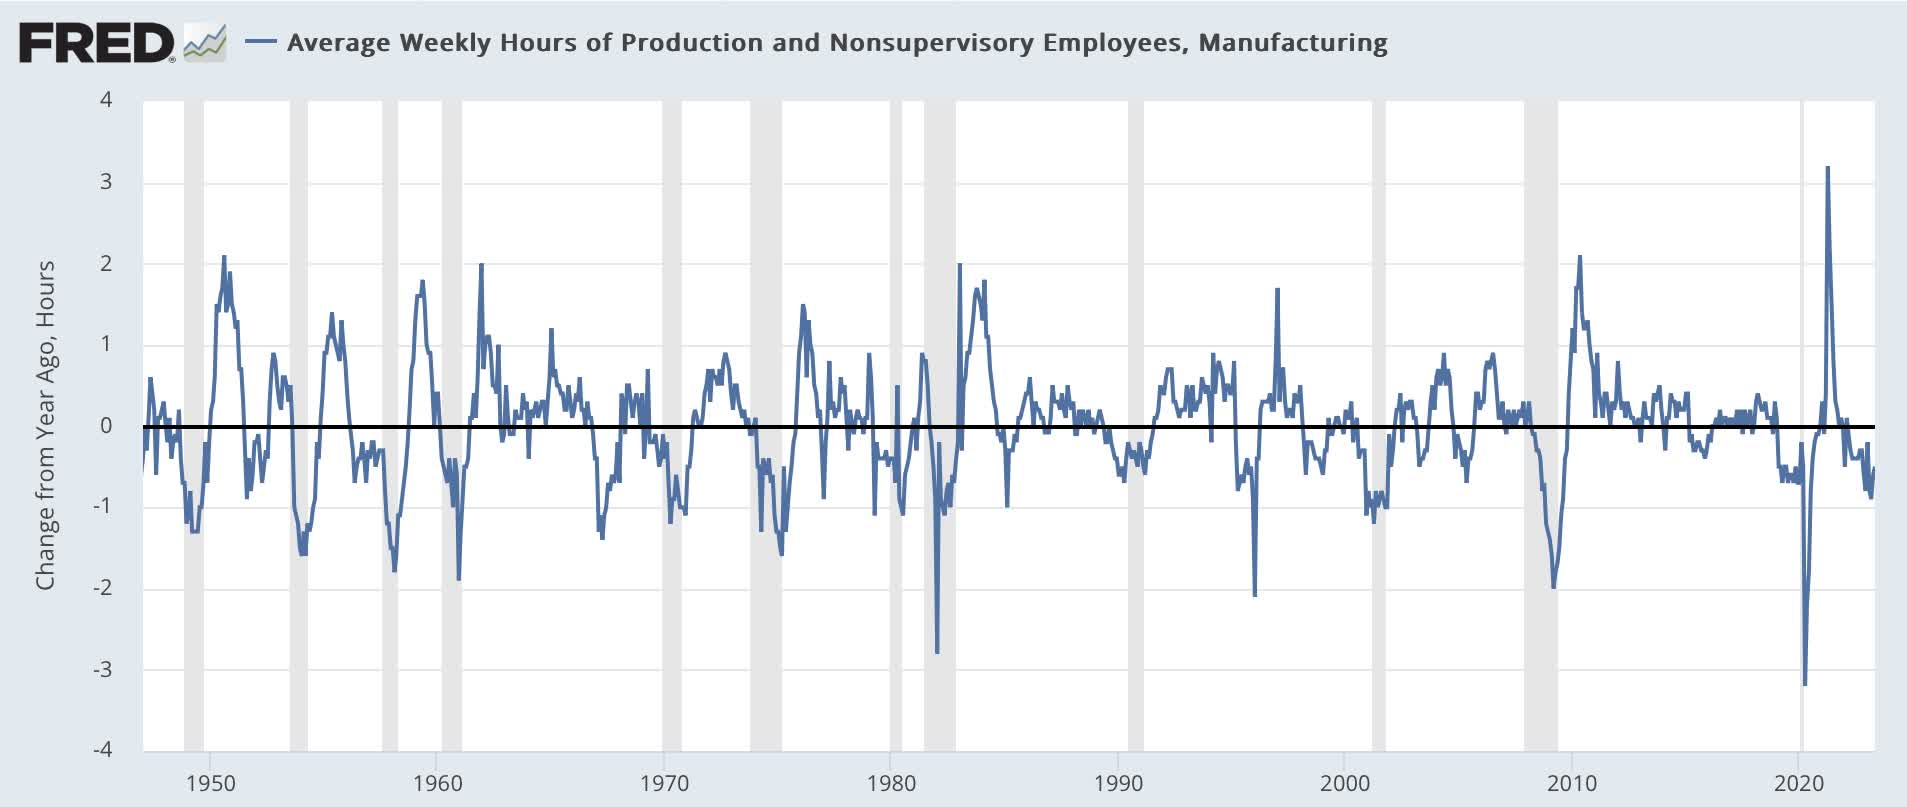
the average workweek for manufacturing workers,
Average weekly hours manufacturing workers (FRED)
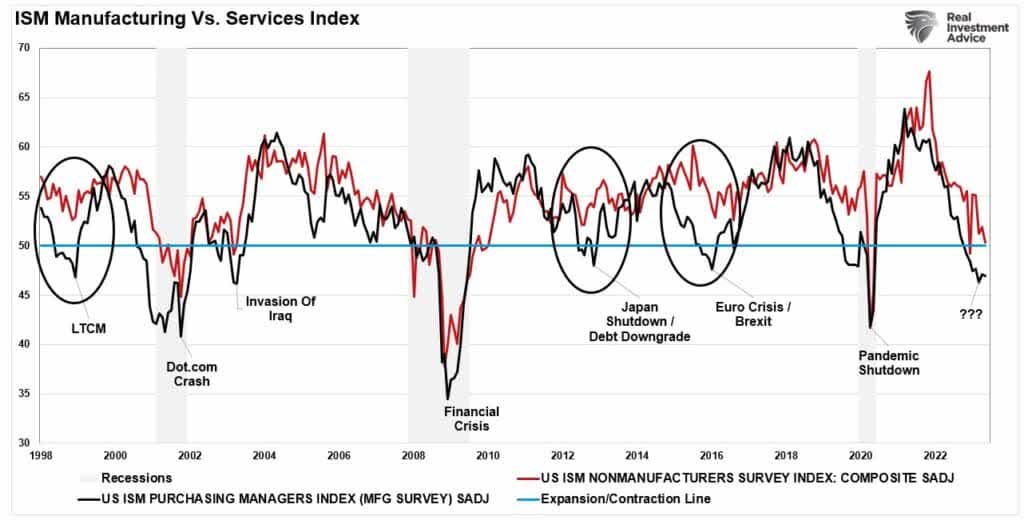
the new orders or vendor deliveries subindexes of the ISM manufacturing index,
ISM manufacturing index (Lance Roberts via Seeking Alpha)
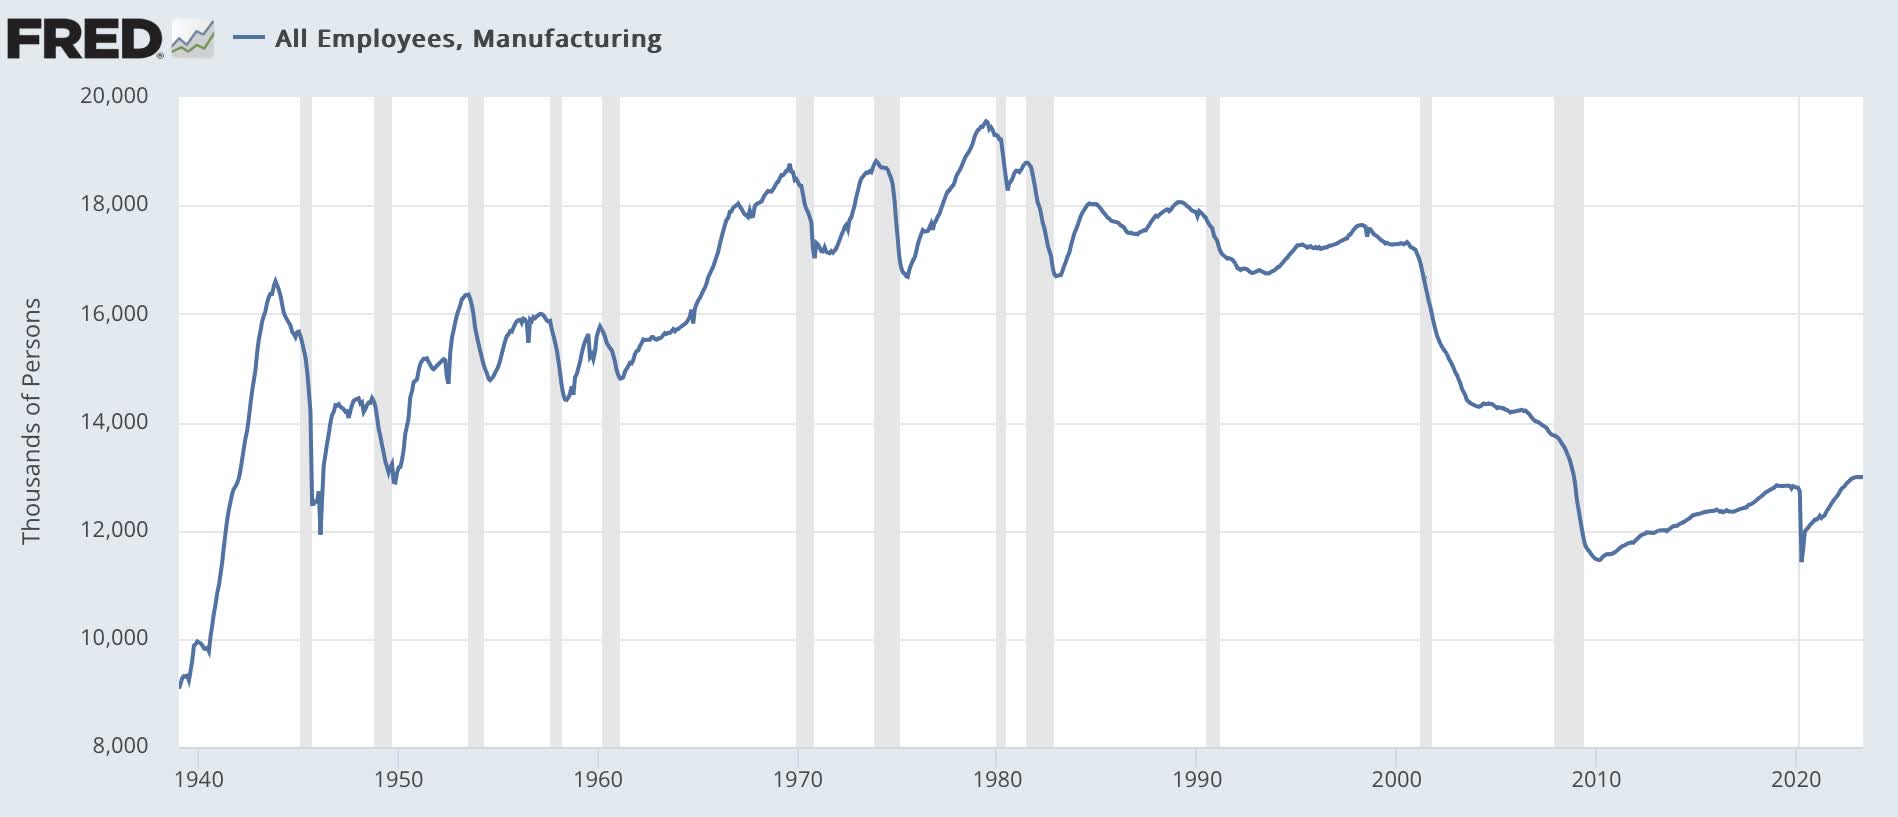
but also including manufacturing employment from the payrolls survey:
Manufacturing employment (FRED)
But in the past 20+ years, at nearly half a dozen times these indicators turned down to levels where they had previously indicated a recession was imminent, but no such recession took place.
The present may yet be another such case.
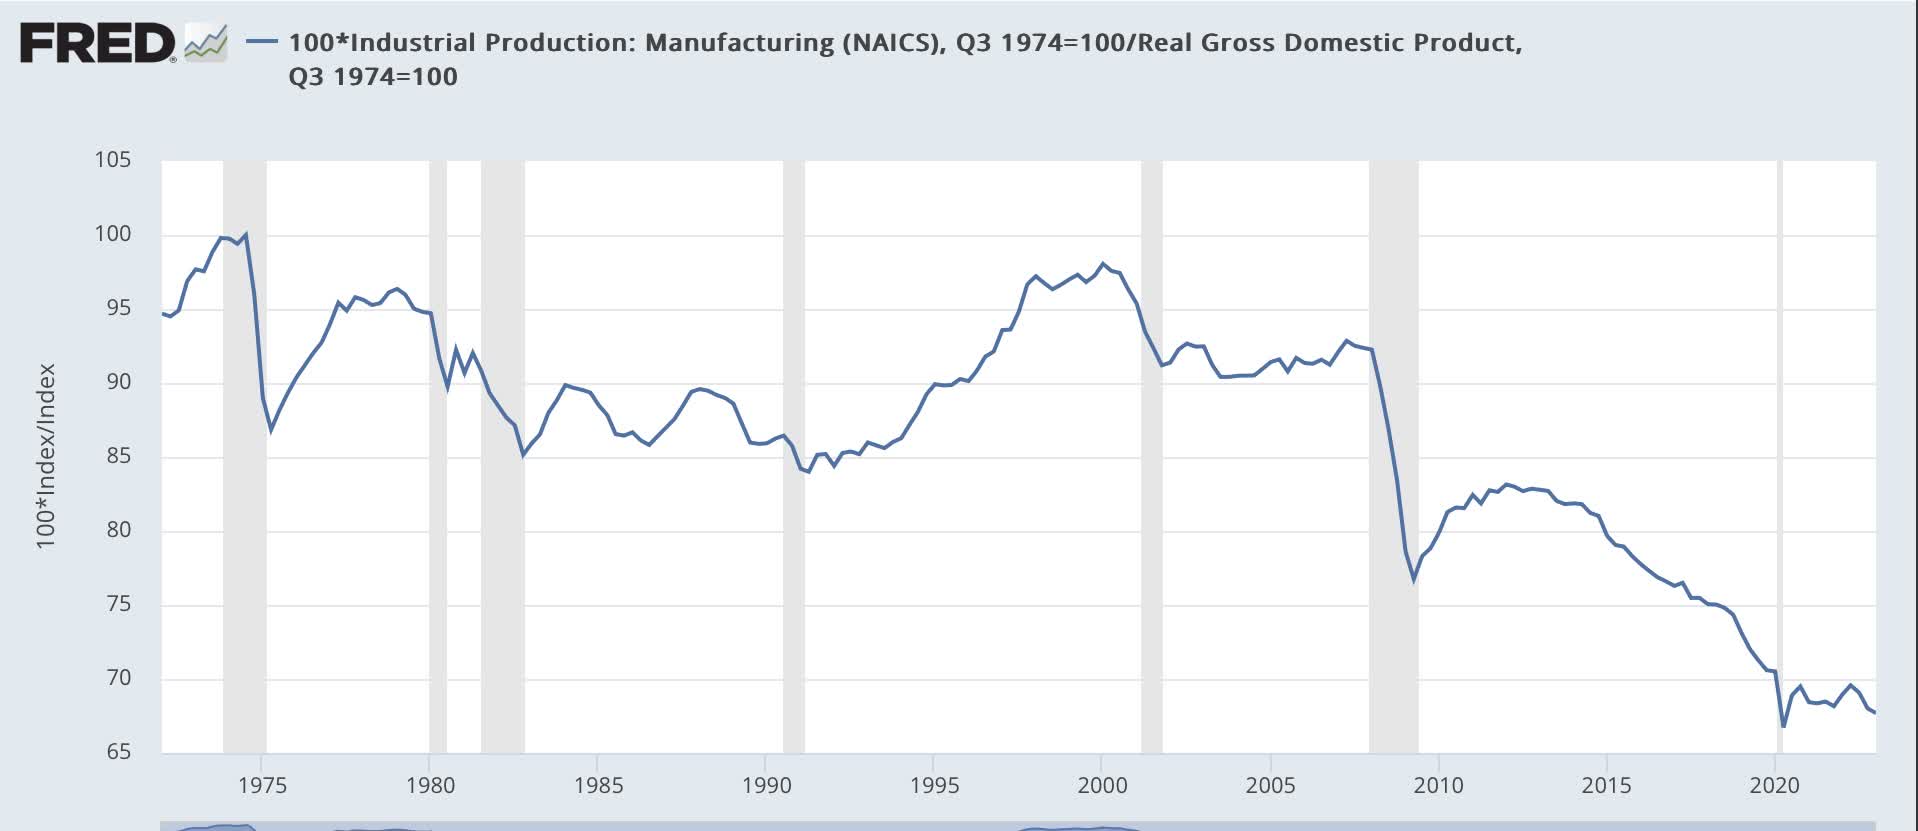
Simply put, the importance of domestic manufacturing to the U.S. economy has faded considerably since China was granted most favored nation trading privileges in 1999, a/k/a the “China shock,” that is most notable in the long-term graph of manufacturing production as a share of real GDP:
Manufacturing production as a share of GDP (normalized) (FRED)
Manufacturing’s share of the real economy has declined about 25% since the late 1990s.
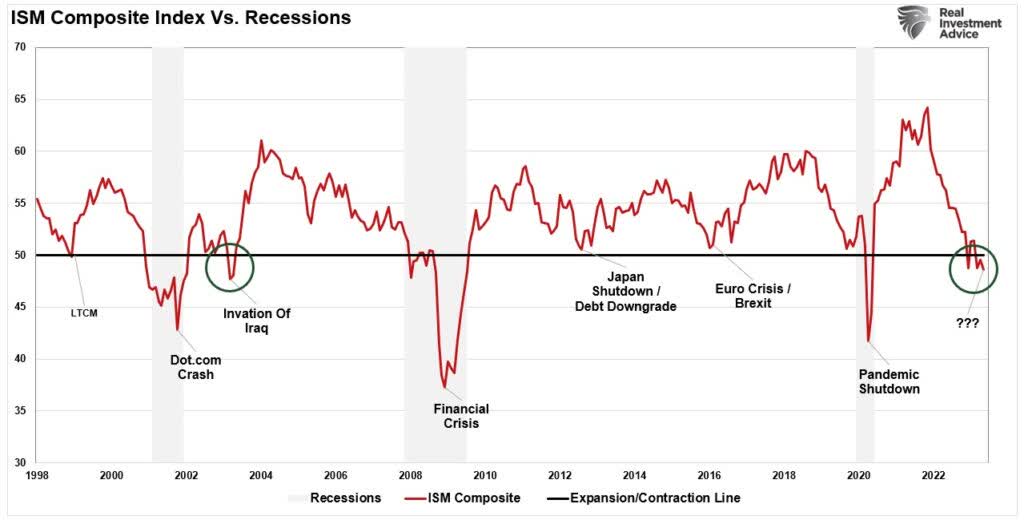
So an equivalent downturn in manufacturing production or employment does not convey the same impact on the broader economy than it once did. Lance Roberts had an excellent discussion of this, and suggested that an economically-weighted graph of the USM manufacturing and non-manufacturing indexes better indicates the direction of the economy:
ISM weighted manufacturing & non-manufacturing (Lance Roberts via Seeking Alpha)
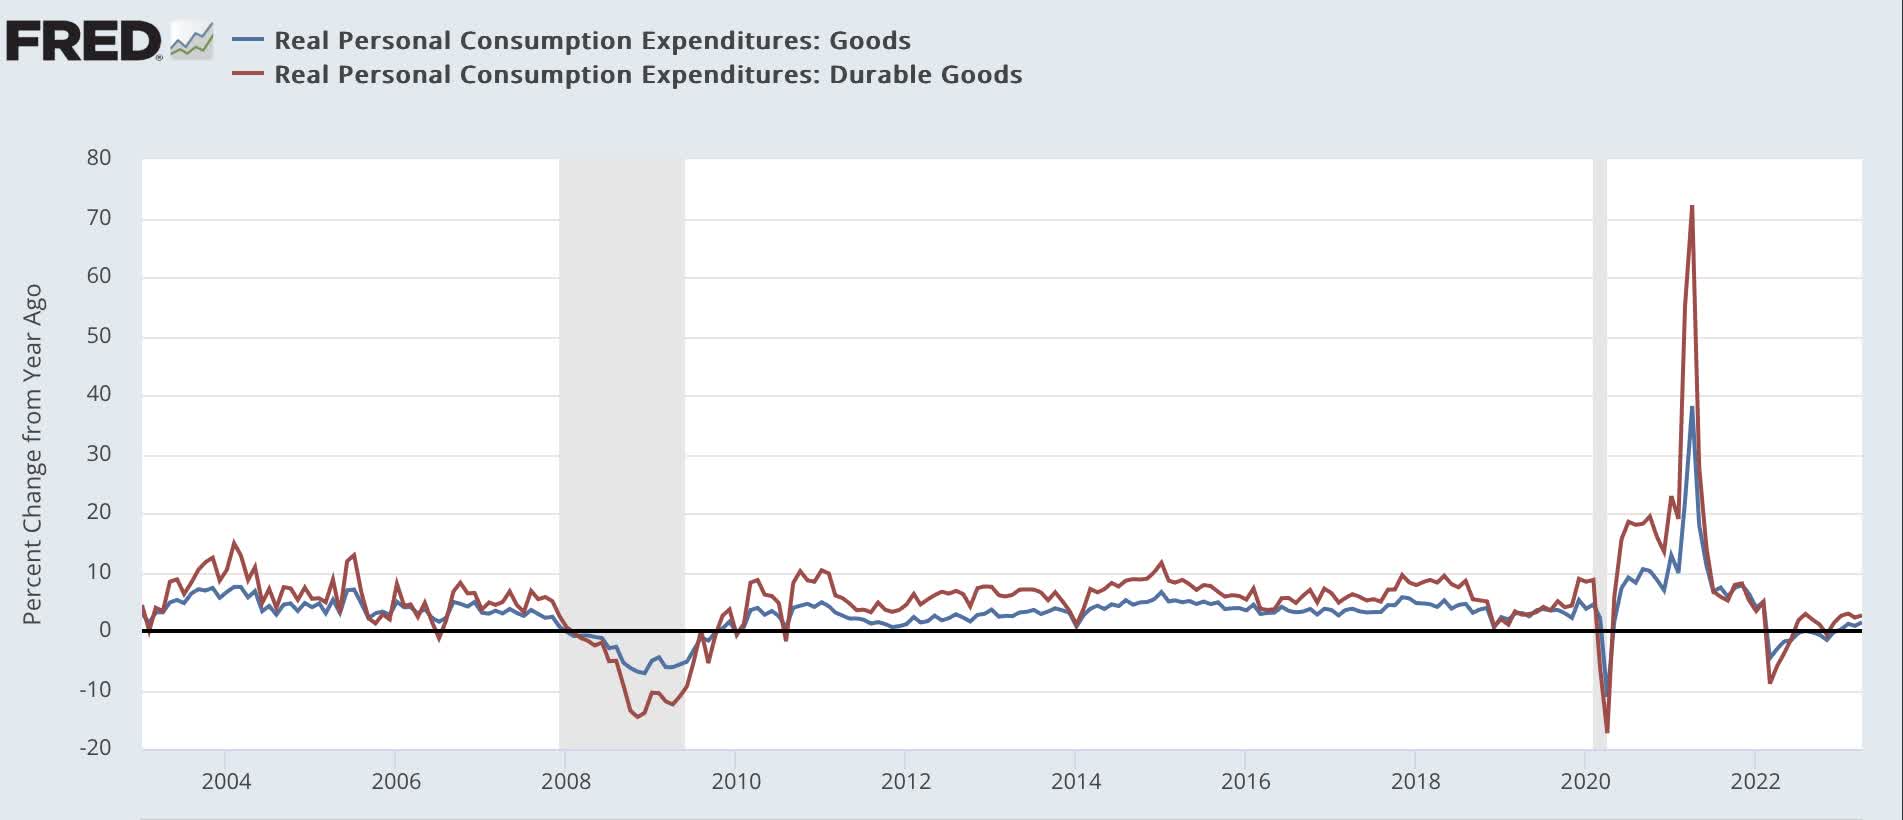
This doesn’t mean that these historic leading indicators are no longer valid. It just means that they are less significant than they used to be. Things like consumer purchases of durables and other goods remain significant and leading, which is why I have come to pay much more attention to real personal consumption of goods, which will be reported for May this Friday:
Real spending on goods and durable goods (FRED)
Conclusion
Three factors have delayed the constrictive dynamic of the Fed’s sharp interest rate increases: (1) the steep decline in gas prices late last year. YoY comparison will become much more challenging as the 2nd half of this year progresses; (2) the logjam in housing under construction dating back to pandemic-related shortages. This is being worked through very slowly, and is unlikely to fully abate until at least the end of this year; and (3) pent-up demand for motor vehicles, also due to pandemic-related supply shortages. This is abating rapidly now, but vehicle manufacturing is still not at a pace that will quickly work through this demand.
But the strong likelihood is that this is only Downturn Delayed, not Downturn Denied.
For further details see:
An Update On What's Jamming The Fed's Transmission (Mechanism)