AOD - AOD: Underperforming Global Fund
2024-01-15 23:21:03 ET
Summary
- abrdn Total Dynamic Dividend Fund has performed well, returning 11.2% in total returns on market price since my last article.
- Compared to passive ETFs, the AOD fund has lagged. In fact, the AOD fund lags on average 150-250 bps every year.
- While AOD's 8.6% distribution yield looks attractive, investors can easily create a superior distribution stream using low-cost passive ETFs and fixed withdrawals.
A little more than a year ago, I wrote a cautious article on the abrdn Total Dynamic Dividend Fund ( AOD ). Although I liked the fund's distribution yield, I was concerned that the fund underperformed a passive global index fund. Since my article, the AOD fund has actually performed well, returning 11.2% in total returns on market price (Figure 1).
Figure 1 - AOD performed well in 2023 (Seeking Alpha)
As we begin 2024, I wanted to refresh my thesis on the AOD fund, to see if I was too harsh in my prior assessment.
Brief Fund Overview
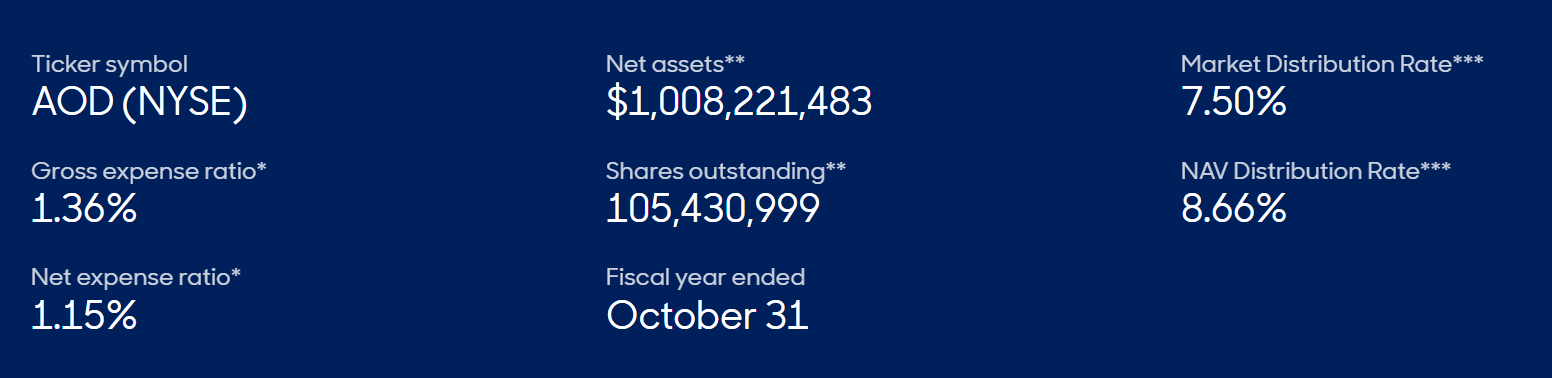
The abrdn Total Dynamic Dividend Fund seeks high current dividend income from a global portfolio of dividend-paying stocks. The AOD fund had over $1 billion in net assets as of December 31, 2023, and charges a 1.15% net expense ratio (Figure 2).
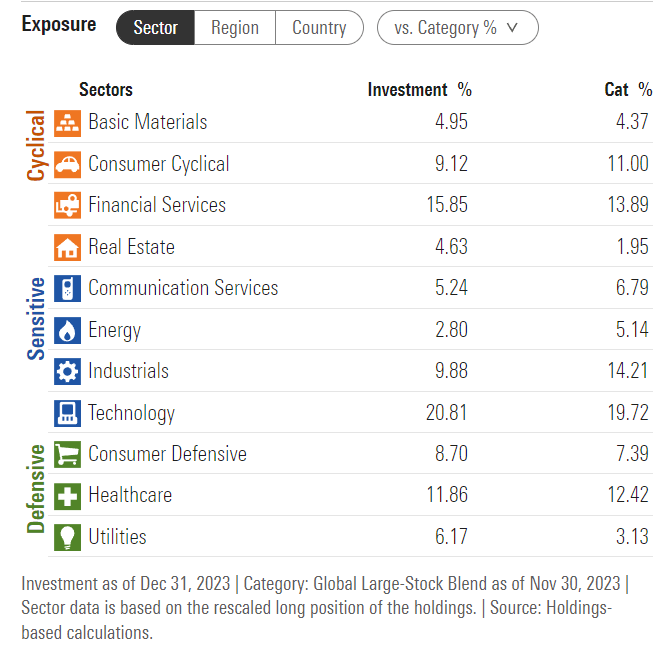
Figure 3 shows the AOD fund's sector allocation as of December 31, 2023. Overall, there does not appear to be a big sector tilt to the AOD fund compared to its peers of Global Large-Stock Blend funds.
Figure 3 - AOD sector allocation, December 31, 2023 (morningstar.com)
Relative to the sector allocation from my last article (October 2022), AOD's sector allocation has also been fairly stable, with the only notable change being technology stocks increasing from 17.2% to 20.8% of the portfolio at the expense of minor decreases in other sectors (Figure 4).
Figure 4 - AOD sector allocation, October 31, 2022 (morningstar.com)
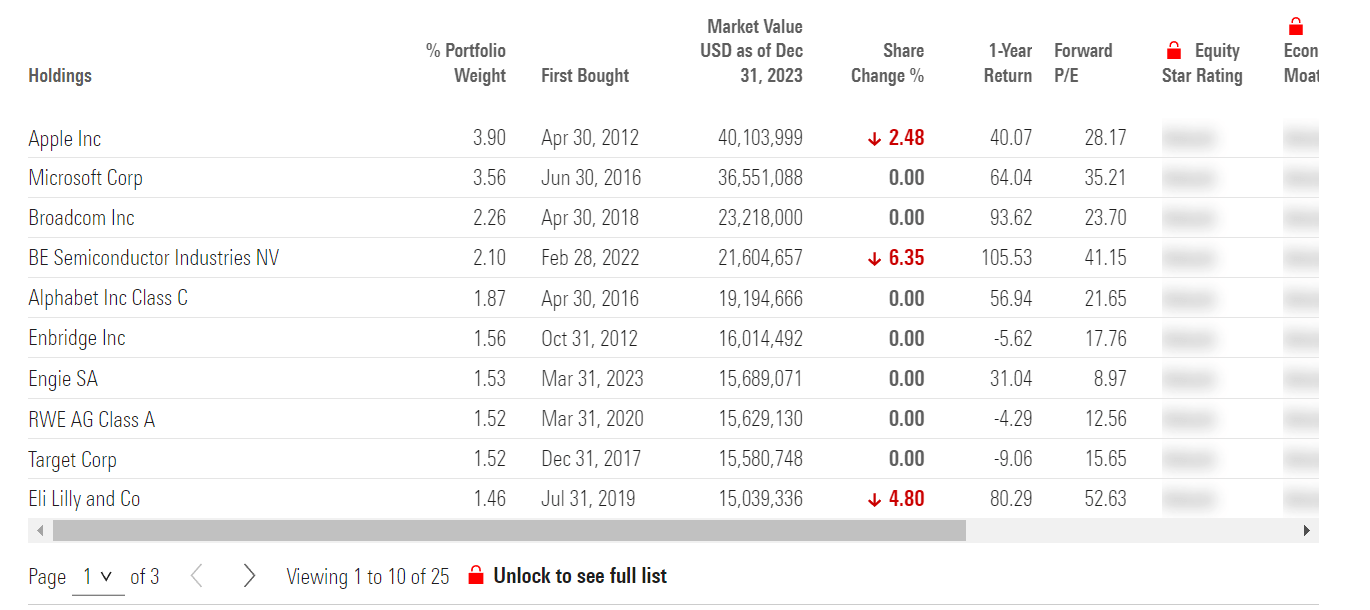
AOD's top 10 holdings currently account for 21% of the portfolio and show the shift towards technology investments, with 5 of the top 10 investments being from the Technology and Communications sectors (Figure 5).
Figure 5 - AOD top 10 holdings, December 31, 2023 (morningstar.com)
In contrast, in October 2022, only the top 3 holdings were from the Technology and Communications sectors (Figure 6).
Figure 6 - AOD top 10 holdings, October 31, 2022 (morningstar.com)
Solid Performance In 2023 But Still Lagging Passive Investments
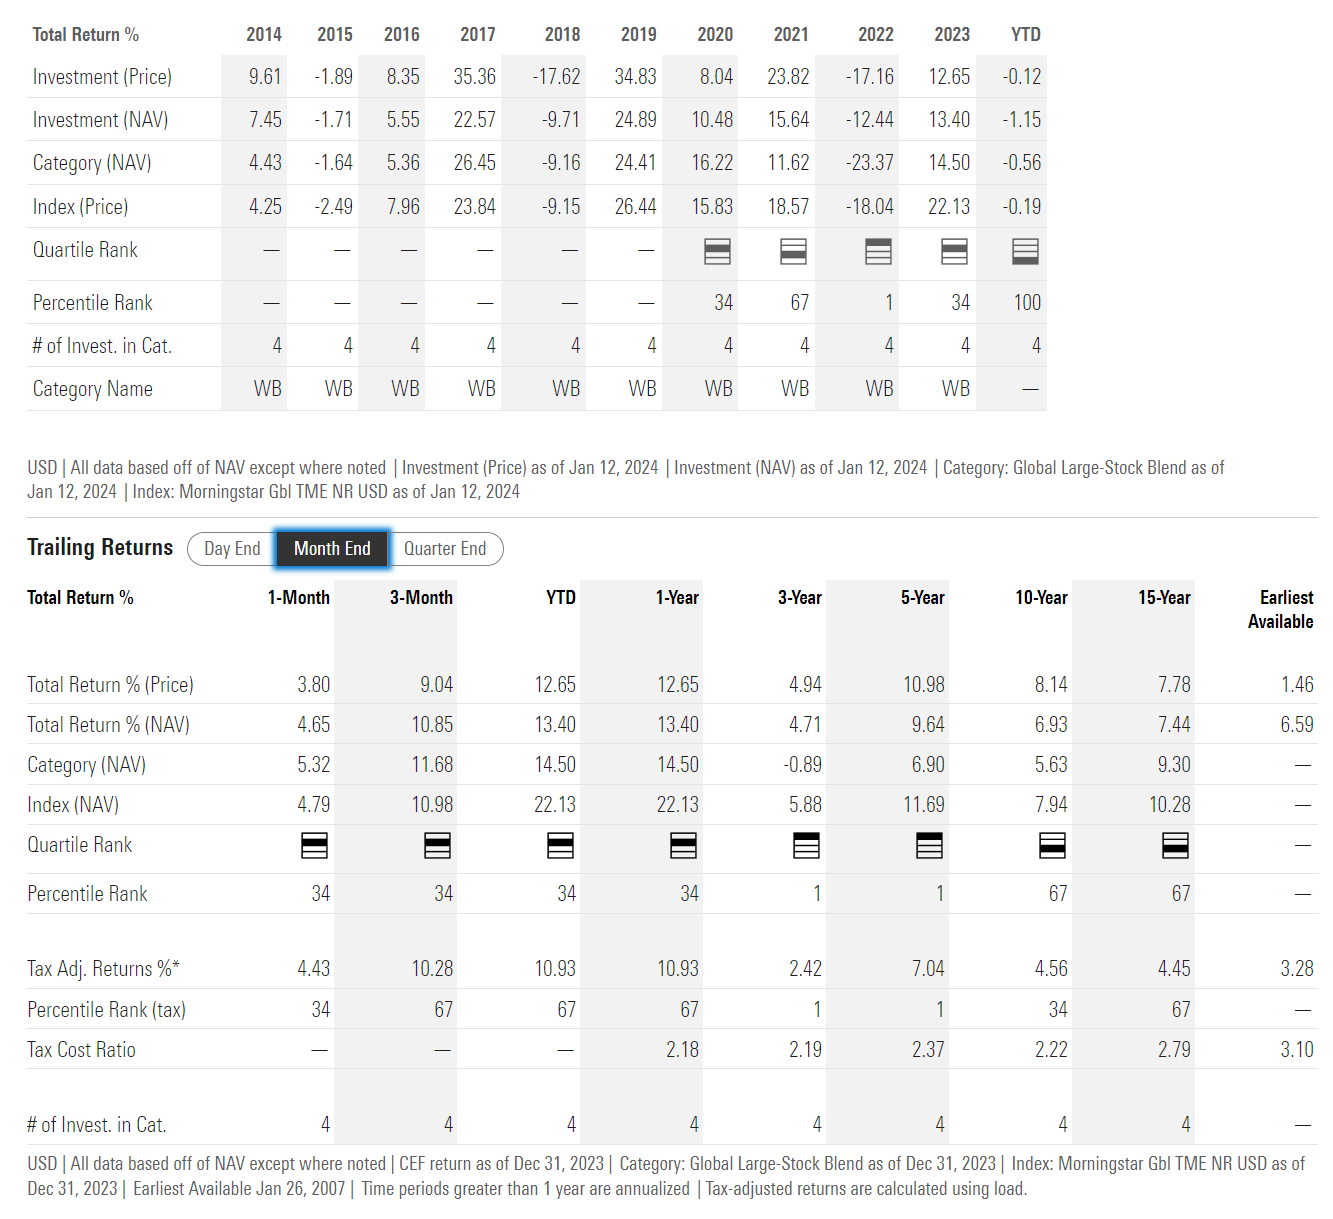
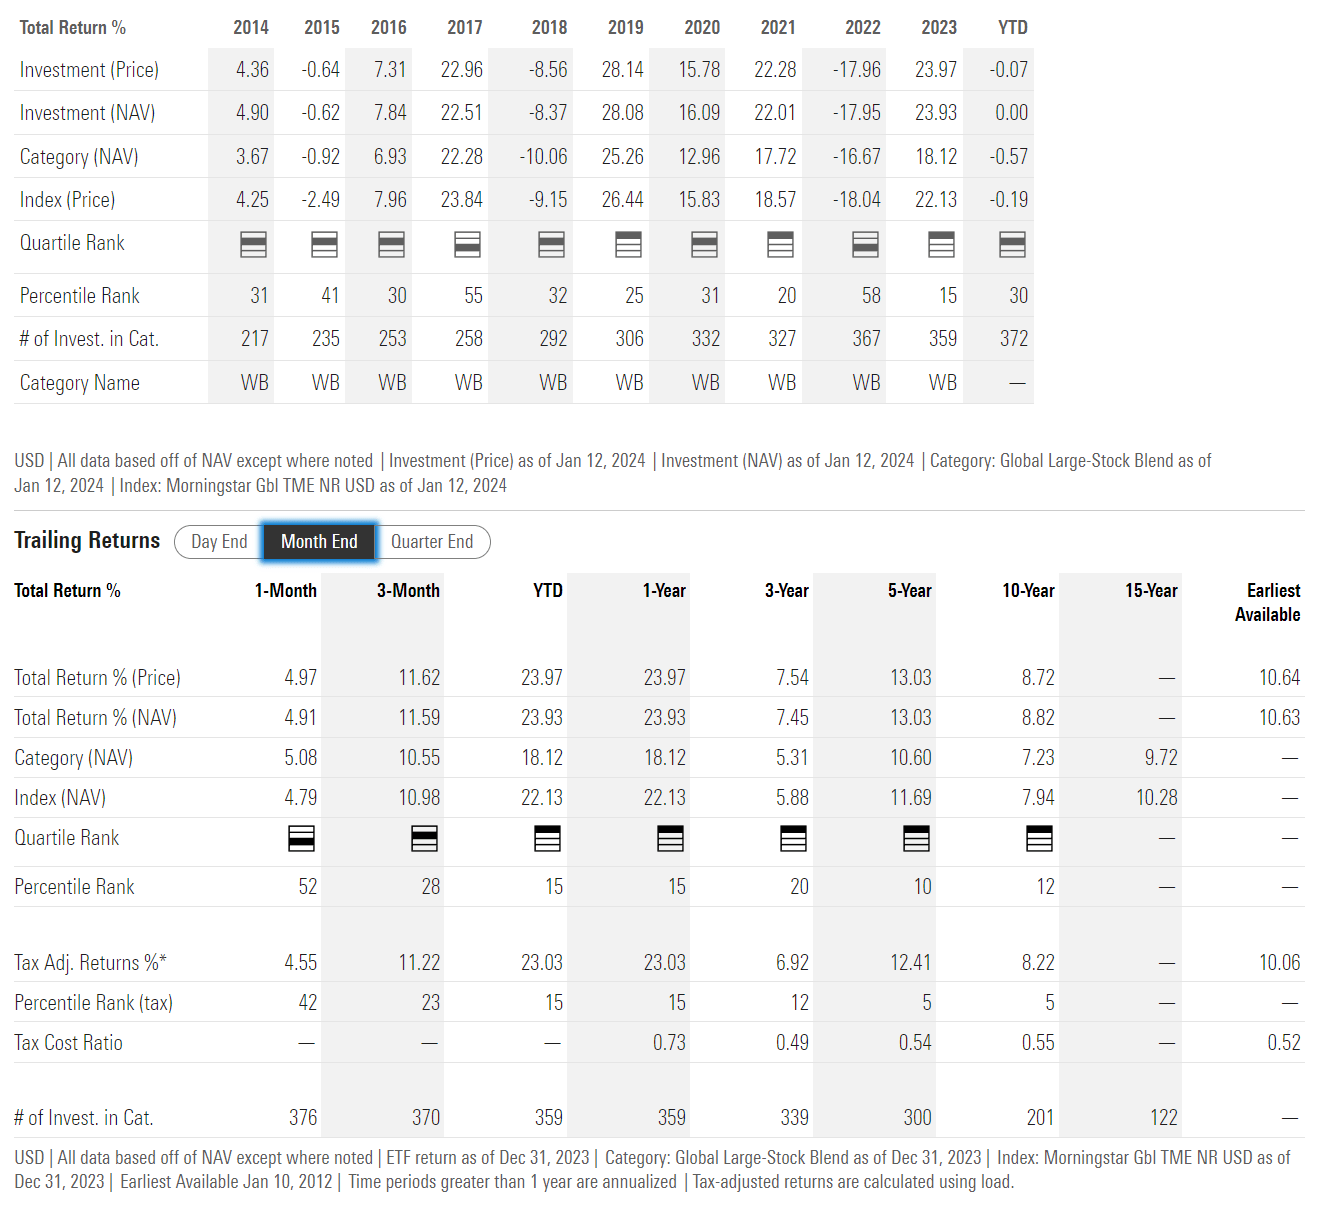
As mentioned at the beginning of this article, the AOD fund delivered solid performance in 2023, returning 13.4% on an NAV basis. This helped increase 3/5/10Yr average annual returns to 4.7%/9.6%/6.9% respectively to December 31, 2023 (Figure 7).
However, 2023 was a strong year for most equity markets around the world, so we need to compare AOD's performance against a suitable benchmark, for example, the iShares MSCI World ETF ( URTH ).
Compared to the URTH ETF, the AOD fund significantly lagged in 2023, returning 13.4% vs. 23.9% for URTH. In fact, underperformance by the AOD fund appears to be a regular occurrence, as the URTH has 3/5/10yr average annual returns of 7.5%/13.0%/8.8%, all significantly better than AOD's (Figure 8).
Distribution Yield Was Well Covered In 2023
On a positive note, the AOD fund was able to cover its distribution in 2023, as it paid a $0.0575 monthly distribution, or a trailing 8.6% yield on market price and 7.3% yield on NAV, compared to the fund's 13.4% NAV investment return.
Historically, the AOD fund had been able to fund its distribution mostly from net investment income ("NII") and realized gains, as return of capital ("ROC") was only been used sparingly (Figure 9). In fiscal 2023, $0.09 out of AOD's $0.69 distribution was funded from ROC.
Figure 9 - ROC was used sparingly for AOD (AOD 2023 annual report)
Overall, I am not too concerned with AOD's minor use of ROC, as I do not believe it to be an amortizing 'return of principal' fund.
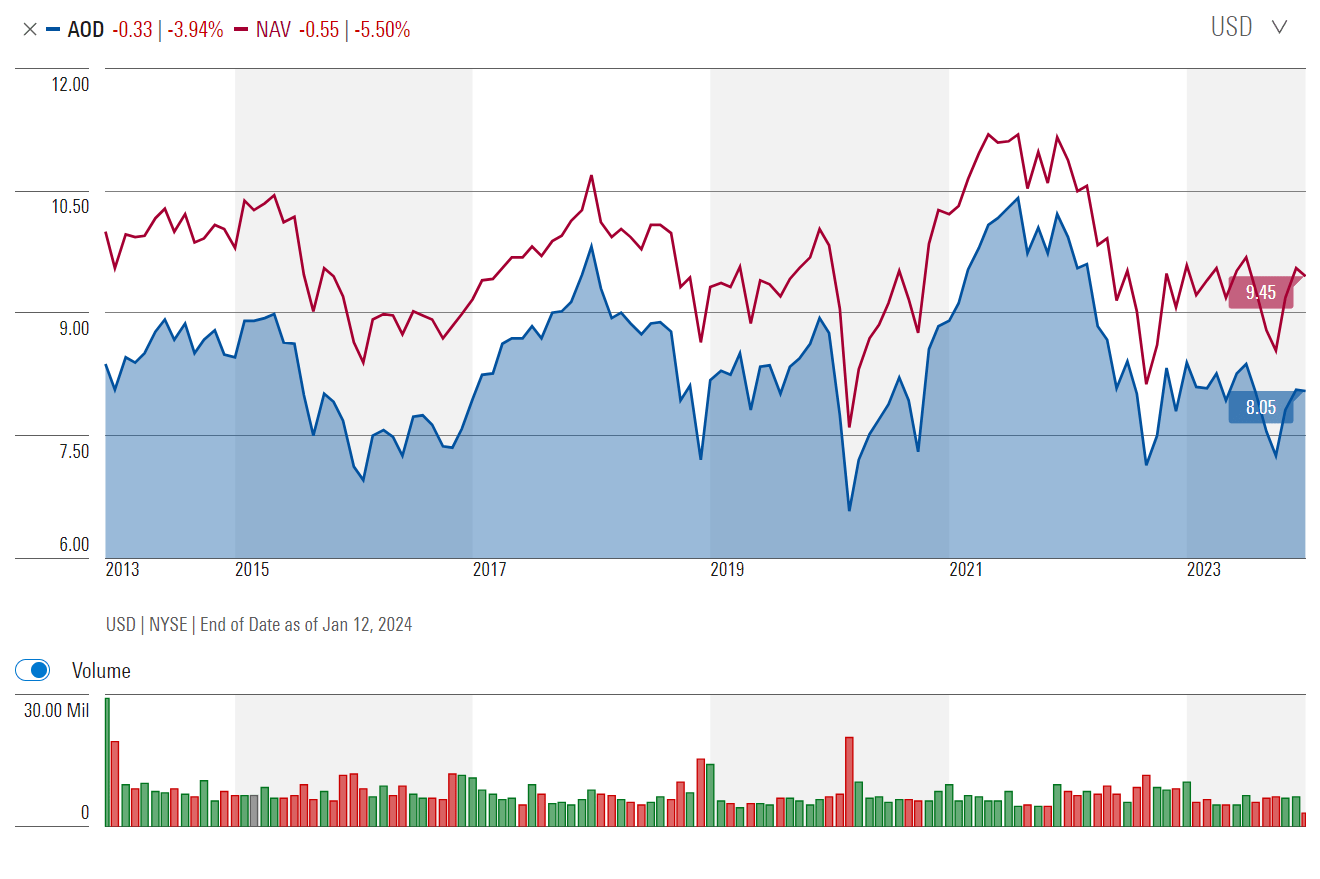
AOD's net asset value per share ("NAV/sh") has more or less stayed flat in the past decade despite the fund's high distribution yield, suggesting that the AOD fund has been able to earn sufficient total returns to fund its distribution (Figure 10).
Figure 10 - AOD's NAV has been flat over past decade, suggesting distributions were well funded (morningstar.com)
A DIY Solution May Be Superior
The main drawback I see with the AOD fund is that it persistently underperforms the passive URTH ETF by 150 - 200 bps p.a., with the most recent 2023 total return underperforming by 10.5%. While on a year-to-year basis, investors may be able to ignore this underperformance, over the long run, this can lead to a significant difference in total portfolios.
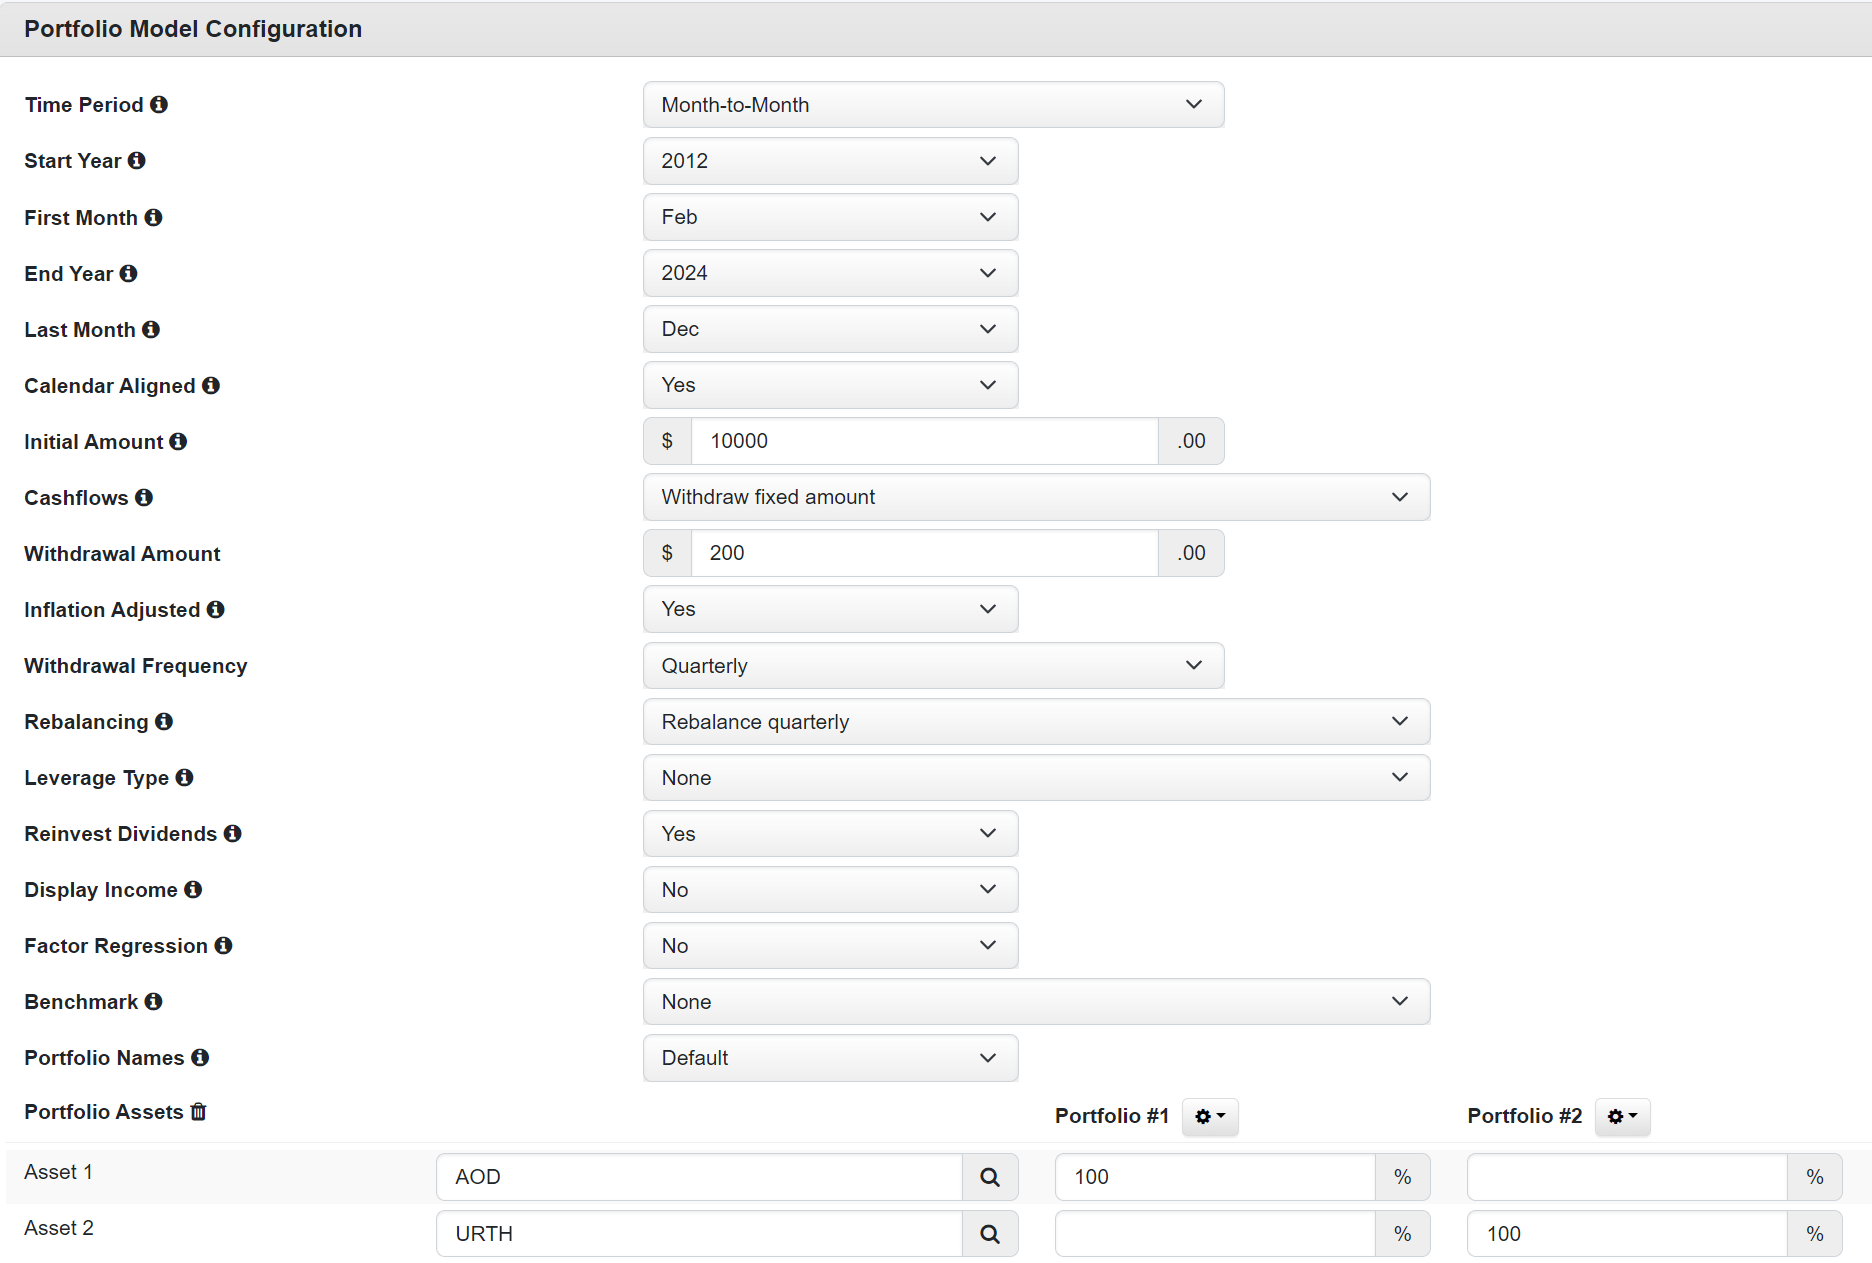
For example, assume we invested $10,000 into the AOD fund and the URTH ETF each, and all distributions from the funds are reinvested. However, we set up a quarterly withdrawal of $200, or 2% of the initial investment (Figure 11). This essentially mimics the portfolio of a retiree.
Figure 11 - Invest $10,000 each into AOD and URTH, withdrawing a quarterly $200 (Author created using Portfolio Visualizer)
We can see that since URTH's inception in February 2012, URTH's higher compounded returns have been able to more than fund the investor's quarterly withdrawal rate with money left over, as the URTH portfolio has an ending balance of $13,148 (Figure 12). On the other hand, the AOD fund, despite its higher headline 'distribution yield', was not able to keep pace with the quarterly 2% withdrawal rate, so the ending balance was only $7,621.
Figure 12 - DIY solution with URTH is superior to AOD (Author created using Portfolio Visualizer)
This example shows that total returns are more important than headline distribution yields since investors can create a high distribution stream themselves as long as total returns are sufficiently high.
Conclusion
While it was encouraging to see the AOD fund deliver a solid 13.4% total return in 2023, in the context of strong global equity performance, the AOD fund actually severely lagged passive index funds.
Although AOD's 8.6% distribution yield is attractive, I continue to recommend investors look beyond the headline yield and consider total returns. On a total return basis, the AOD is an underperforming global equity fund. I maintain my cautious stance regarding AOD.
For further details see:
AOD: Underperforming Global Fund