UBS - Aoris International Fund Q1 2023 Report
2023-04-21 03:15:00 ET
Summary
- Aoris is a global equity boutique, deliberately different in many ways, as a business and as investors. We've made unconventional choices to best position us to deliver long-term investment success for our clients.
- The Aoris International Fund (Class A – Unhedged) returned 12.8% for the quarter, outperforming its benchmark by 4.1%.
- The Aoris International Fund (Class C – Hedged) returned 9.9% for the three-month period, exceeding its benchmark by 3.3%.
- We focus on two quantitative and three qualitative characteristics that, we believe, allow businesses to grow consistently over a long period.
- Success for Aoris is denoted not by timing cycles, picking a turnaround or finding the next business touted to change the world. It is by avoiding businesses that carry a higher risk of a disappointing outcome.
Aoris International Fund: Performance to 31 March 2023
| Class A (Unhedged – base fee option) inception 26 March 2018 |
| March Quarter |
| 1 Year |
| Since Inception p.a.* |
| Portfolio return ((AUD)) net of all fees |
| 12.8% |
| 13.6% |
| 14.6% |
| MSCI AC World Accum Index ex-Australia ((AUD)) |
| 8.7% |
| 3.8% |
| 10.0% |
| Excess return |
| 4.1% |
| 9.8% |
| 4.6% |
| Class C (Hedged – base fee option) inception 28th September 2018 |
| March Quarter |
| 1 Year |
| Since Inception p.a.* |
| Portfolio return ((AUD)) – net of all fees |
| 9.9% |
| 0.0% |
| 11.3% |
| MSCI AC World Accum Index ex-Australia 100% Hedged ((AUD)) |
| 6.7% |
| -7.8% |
| 5.7% |
| Excess return |
| 3.3% |
| 7.8% |
| 5.5% |
| *Past performance should not be taken as an indication of future performance. |
Market and portfolio performance
The international equity market, as measured by the MSCI AC World Accumulation Index ex-Australia, rose by 8.7% in the March quarter (all returns are in A$ unless stated otherwise). Equity markets appreciated by 6.7% in local currency terms, while changes in currency values added 2.0% to the A$ return.
As shown in the table on the previous page, the Aoris International Fund (Class A – Unhedged) returned 12.8% for the quarter, outperforming its benchmark by 4.1%. The Aoris International Fund (Class C – Hedged) returned 9.9% for the three-month period, exceeding its benchmark by 3.3%.
We now have a five-year investment track record. Over that period, Class A of our Fund returned 14.7% p.a., exceeding both its benchmark and our long-term objective of 8–12% p.a.
There was a wide dispersion of performance by market sector during the quarter, with a 23.8% difference between the best and worst sector. Information Technology led the way with a gain of 21.9%, followed by Communication Services at 18.6%. At the other end, Energy declined by 1.9% and Financials and Health Care declined by 0.2% and 0.5% respectively.
The stress in the US and European banking systems late in the quarter saw the failure of two top-20 US banks and the forced merger of Credit Suisse ( CS ) with UBS . The Aoris International Fund will never own a bank or insurance company. Among the many reasons for this exclusion are:
- Opacity – Public financial statements are a very incomplete representation of the risks in the assets and liabilities of a particular bank. This was demonstrated by the fact that the bank failures in March took most people, including their regulators, by surprise.
- Fragility – Banks depend on the confidence of deposits and lenders to stay solvent. Should that confidence be tested, even for a moment, the bank may fail as lenders rush for the exits, as was evidenced in March.
- Poor profitability – The median return on equity for European banks in the decade to 2020 was just 4%, a meagre return for the complexity, leverage and risk inherent in those businesses.
The operating performance of the businesses in our portfolio has remained pleasing and consistent with our expectations. Take Accenture ( ACN ), the world’s largest IT outsourcing and consulting firm. For its fiscal quarter ended February, Accenture’s revenue grew on an underlying basis by 7%, well in excess of the rate at which corporate IT spending is growing. The number of new contracts signed in the quarter with a value of US$100 million or more was the second highest in Accenture’s history.
Cintas ( CTAS ), America’s largest uniform rental and facility services business, grew its revenue on an underlying basis by 12% in its February quarter, as the company continued to win more customers and provide more services to their existing customers. For both companies, profit margin in the February quarter was higher than a year ago, despite the upward pressures of inflation on labour costs and other expenses.
We wrote in our 2021 and 2022 annual letters that the best businesses have navigated the various challenges of the last few years far better than their peer group, on average; the best outperforming the rest, if you like. What has been interesting for us to observe in recent quarters has been the performance differential between the best businesses and their closest competitor; call it the best outgrowing the next-best. A good example of this is Nike ( NKE ) and Adidas ( ADDYY ). Nike’s sales in its most recent quarter grew by 27% while Adidas’ declined by 1%, with even starker differences in profitability between the two firms. L’Oréal’s ( LRLCF ) sales in 2022 grew by 11%, far ahead of the global beauty market, while Estee Lauder’s ( EL ) sales declined. We have seen a similar divergence in fortunes between LVMHF) and Kering ( PPRUF , owner of Gucci). Interestingly, performance difference for all three leading companies when compared to the respective number two was most pronounced in China, which is where conditions were the most challenging due to lockdowns.
To what can we attribute this phenomenon? Firstly, Nike, L’Oréal and LVMH are broader, more balanced businesses than their closest rivals, meaning pressures in one country or category has only a muted effect on the whole company. Secondly, all three businesses are run with a very long- term mindset, with management choosing to maintain investment levels during difficult periods. Their peers, by contrast, have been managed with an eye on shorter-term outcomes, with management choosing to hold back investment in brands or people in a way that has compromised the business. Our approach is to own only the best businesses.
Many commentators have raised concerns regarding the state of the world economy and the prospect of declines in corporate earnings. It is important to remember that for a business to become more valuable through time, its earnings per share need not hit record levels every year. What we will be paying close attention to in the coming quarters for businesses in our portfolio is whether there has been any change to our assessment of their long-term competitive strength and earnings trajectory.
Stock profiles
LVMH ( LVMHF )
By manufacturing and retailing most of its products directly, LVMH can ensure a high standard for customer experience, product quality and pricing. LVMH is the world’s largest luxury goods company. It owns 75 leading luxury brands across five areas:
- Fashion & Leather Goods make up half of the company’s revenue, across brands such as Louis Vuitton, Christian Dior and Fendi.
- Wines & Spirits, where LVMH is the largest producer globally of champagne and cognac.
- Watches & Jewellery includes the recently acquired jeweller Tiffany, as well as Bulgari and Tag Heuer.
- Perfumes & Cosmetics, where Dior makes the bestselling men’s and women’s fragrances in the world.
- Selective Retailing includes Sephora and the largest global operator of duty-free stores.
The company’s breadth across its many brands, product areas and its global clientele provides valuable balance to the inevitable ups and downs in any one area.
While the LVMH group was formed in 1987 through the merger of Louis Vuitton and Moët Hennessy, most of its brands have very long histories of their own, spanning more than a century in some cases. For instance, Louis Vuitton was founded in 1854 to produce suitcases for the French royal family, in the brand’s trademark canvas material.
The rich histories of LVMH’s luxury brands make them desirable and authentic to their customers. There’s a story behind their products; they stand for something. This heritage and desirability only compounds over time, making it difficult for new brands to succeed in the luxury industry.
LVMH has also been incredibly successful at straddling the legacy of its brands with new products and vibrant marketing that keep them contemporary and relevant. In 2022, the company invested over €30 billion into creating new products, advertising its brands through engaging campaigns, and refurbishing its stores with constantly evolving displays.
LVMH makes most of its products in-house and sells primarily through directly operated stores, which allows it to ensure a high standard for the in-store customer experience, the quality of its products and how they’re priced.
As is the case with many other companies in the Aoris portfolio, a key ingredient to LVMH’s success is in its decentralised structure. LVMH’s 75 brands operate with a high degree of autonomy, with their own CEO and creative director who are accountable for their own budgeting, product development, marketing and staffing decisions.
This autonomy helps its brands to remain agile and entrepreneurial, which came to the fore during COVID-19 when the brands had to quickly adapt to serving local rather than travelling clientele. It also allows for brands that LVMH acquires to retain their own culture and independence.
The company has also benefited from its family ownership. CEO and chairman, Bernard Arnault, who built LVMH into the luxury powerhouse that it is today, is currently the wealthiest person in the world through his family’s ownership of a 48% stake in LVMH. The family is aligned with our desire for LVMH to compound in value over the long term.
Put together, these attributes have contributed to LVMH’s growing desirability with consumers (and corresponding market share gains), its long track record of growth (averaging 9% p.a. over the last 10 years) and enviable profitability (an operating profit margin of 26%). LVMH is an all-weather business that we expect to keep compounding in value for many years to come.
Graco ( GGG )
Graco’s long-term approach allows it to outgrow its peers through all market conditions.
Founded in 1926 and based in Minneapolis, Graco manufactures equipment that is used to measure, control, and spray fluid and powder materials. Graco particularly specialises in equipment solutions for difficult-to-handle materials such as ones with high viscosities, abrasive or corrosive properties, and materials that require precise ratio control. You’ll see Graco’s products being used to spray-paint buildings, apply lines on road surfaces, blend fluids in food and beverage manufacturing, and in environmental groundwater remediation.
Graco’s research and development spending as a percent of sales is twice the average of its peers. It works to improve its products each year in ways that save the customer time, improve energy efficiency, reduce weight and help the customer achieve environmental compliance.
Manufacturing at Graco is highly vertically integrated and almost all in America, unusual in its industry, meaning it manufactures rather than purchases most of the components that go into its pumps and sprayers. This approach allows Graco greater control of quality and product innovation, and importantly, greater control over its costs. Graco looks to reduce the cost per unit by 2–3% every year through manufacturing productivity and automation, which has been particularly valuable during the inflationary period of the last couple of years. Control over manufacturing has also been a significant advantage during the supply chain pressures experienced over the same period. Management believes its vertically integrated model helps Graco generate profit margins more than 1.5x that of its peers.
Graco’s management takes a very long-term approach to running the business. During the COVID-19 pandemic, as in the GFC, there were no layoffs and no furloughs at Graco, and no cuts to product-development spending.
Management took the view that staying the course would see the company far better positioned to benefit from the inevitable recovery than its peers, and so it proved in both cases.
Over the last decade, Graco’s revenue has grown on an underlying basis at 7% p.a., well ahead of the growth of its end markets, and we believe the company will continue growing its top and bottom line at an attractive rate for many years to come.
Portfolio changes
None.
Trees don’t grow to the sky
By Vic Guha, Analyst
Introduction
If you were to spend a day in our office, you would often hear us talking about owning businesses that have consistently above-average rates of revenue growth over many years. Our view is that such businesses carry a lower risk of disappointment and lead to better investor outcomes.
In this feature article, we examine the traits of businesses that exhibit consistent growth. We focus on two quantitative and three qualitative characteristics that, we believe, allow businesses to grow consistently over a long period. We also aim to explain why these attributes lead to better growth outcomes.
Why does consistency of growth matter?
As long-term investors, we aspire to hold a portfolio of companies that compound in value through time. The growth in value of a business is determined in part by its revenue growth profile. We look to invest in businesses that grow at least as fast as the economy, reflecting their growing relevance to their customers or economy at large.
Broadly, businesses express three revenue growth profiles, these being:
- below-average growth/no growth,
- episodic growth, or
- consistently above-average growth.
Businesses that grow below the average company or not at all, tend to compound value poorly through time. To illustrate this a bit more clearly, let’s look at IBM. IBM’s revenue today is lower than it was at the end of 2001. The business is less relevant for more people today than it was two decades ago and this is captured by the stagnation of its revenue growth. Commensurately, the share price performance over that period has been a paltry 0.6% per annum.
Secondly, businesses that have episodic growth also tend to be poor compounders of value. The inherent challenge with these businesses is ascribing them a value that incorporate assumptions on their future growth.
The variance of this growth causes overoptimism or pessimism among investors, leading to large swings in the valuation of the company. This translates to a higher risk of permanent loss of capital and therefore poor investor outcomes.
This is exemplified by what has happened recently with Peloton. A pandemic-driven boom in sales caused Peloton’s share price to surge, reaching a peak of $167 per share in December 2020. This valuation was supported by assumptions from the market that Peloton would continue to grow at extraordinary rates for quite some time.
However, as growth began to fade so did the market’s exuberance and as of writing, Peloton shares currently trade around $10.
To avoid disappointment, we are therefore better off finding companies that exhibit consistent growth. We prefer companies that grow at rates above that of the average company over a long period. These businesses compound value in a steady fashion and as we will explore, they also exhibit a set of similar characteristics.
In our study, we sought to identify common characteristics of businesses that grow at above-average rates consistently through time.
Our study only compared two groups of businesses. We defined them as:
- Consistent growers – businesses that grew at rates above the median company in at least 8 or more out of 10 years.
- Inconsistent growers – businesses that grew at rates above the median company in 2 or fewer years out of 10.
We looked at the revenue per share growth (in USD) of the 5000 largest publicly listed companies in the world, through rolling 10-year periods between 2001–2020.
We evaluated the characteristics of the businesses in each of the two groups and compared them to the median company as well. Specifically, we wanted to assess their profitability as measured by ROIC (return on invested capital) and their capital structure as measured by Net Debt/EBITDA (earnings before interest, depreciation and amortisation). But why these two measures?
ROIC
This is the after-tax rate of profit a company is able to generate on its investments. When a company earns a high ROIC, it has more profits available to invest for future growth. This could mean making acquisitions, investing into research and development, adding physical assets, or expanding into new markets/geographies. Companies that can maintain or even increase their ROIC should therefore be able to grow consistently through time.
Net Debt/EBITDA
Net debt/EBITDA is a commonly used measure to assess a company’s debt levels and serviceability. It is the sum of a company’s interest-bearing liabilities, less their cash, divided by their EBITDA. A high debt burden can reduce the resources available for a business to grow, with capital being consumed into repaying loan obligations. When interest rates are low, having more debt on the balance sheet won’t necessarily pose much of an issue, as companies can often refinance their existing debt at low rates. However, in a rising interest rate environment, businesses that need to refinance at higher rates will have fewer profits to invest into growth initiatives. Our hypothesis is that companies hamstrung by their balance sheets are less likely to display consistent growth through time.
What we found
First, we looked at how common it is for companies to achieve consistent growth.
As a reminder, companies defined as consistent growers were able to grow above the rate of the median company in 8 or more years out of 10, while inconsistent growers only grew above the rate of the median company in 2 or fewer years out of 10.
Our study found that out of the 5000 largest companies in rolling 10-year periods between 2001–2020, only 12% of companies achieved our definition of consistent growth.
ROIC
We compared the ROIC of the consistent growers, inconsistent growers, and the median company.
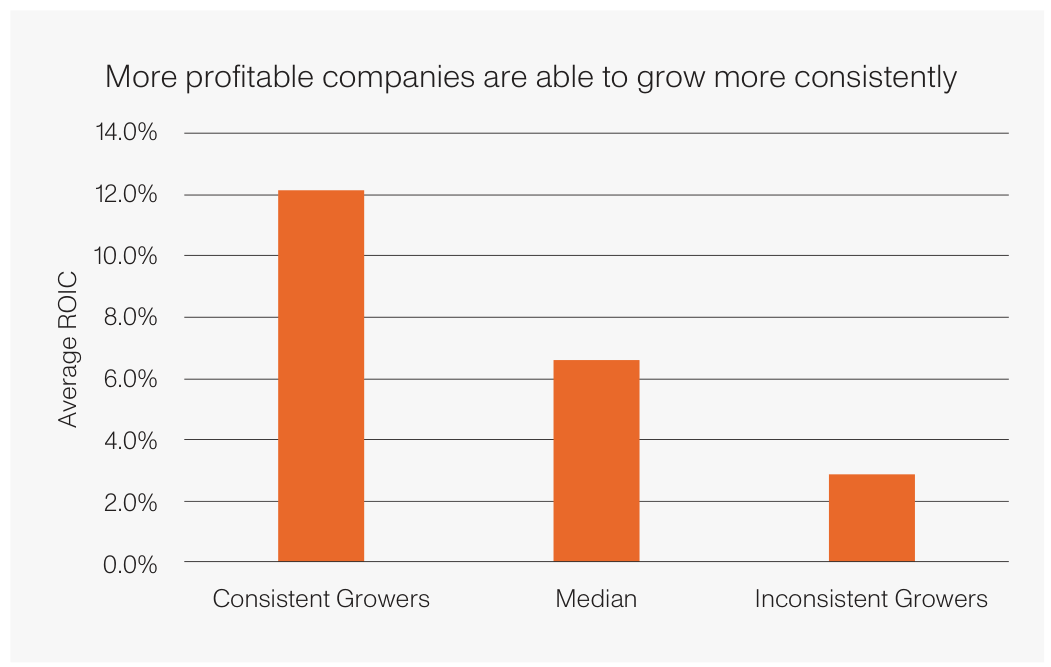
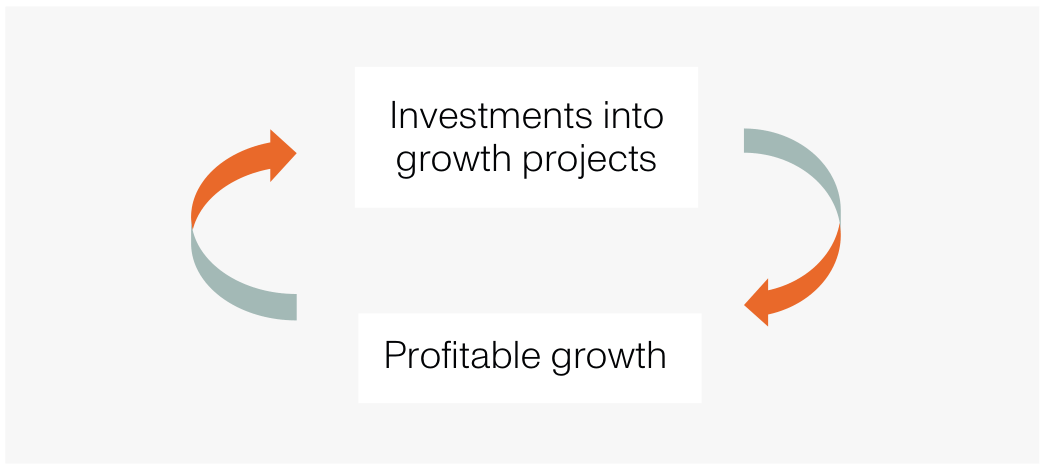
Consistently growing businesses were far more profitable than not only inconsistent growers but the median company as well. Investments into growth initiatives with high returns provided additional capital to deploy into future high-returning investments, perpetuating the ability for a business to continue growing.
To paint the picture more clearly, let’s look at the performance of one of our current portfolio holdings, Tractor Supply Company ( TSCO ), which is the largest retailer of rural supplies in the United States. Over rolling 10-year periods between 2001–2020, the company outgrew the median business in every single year and earned an average ROIC of 22%. This is an impressive feat that places Tractor Supply among the top 1% of the largest
5000 listed companies in our study. So, how was Tractor Supply able to do it?
By earning a high ROIC, Tractor Supply generates more profits than its peers. It reinvests these profits into
improving the customer experience which in turn allows it to grow consistently. Examples of how it reinvests profits include:
- building out new stores to access more customers,
- refurbishing existing stores to make the shopping experience more pleasant as well as adding new goods to obtain a greater share of customer wallet,
- investing in its supply chain to ensure high product availability across a broad selection of goods (this is to attract not only new customers but get exiting customers to spend more), and
- investing in its IT infrastructure to adapt to customer preferences and offer a robust loyalty program.
What about the Aoris portfolio more broadly? The below figure compares the average ROIC of the Aoris portfolio over the last 10 years versus a universe of listed global companies as represented by the MSCI All Country World Index (ACWI).
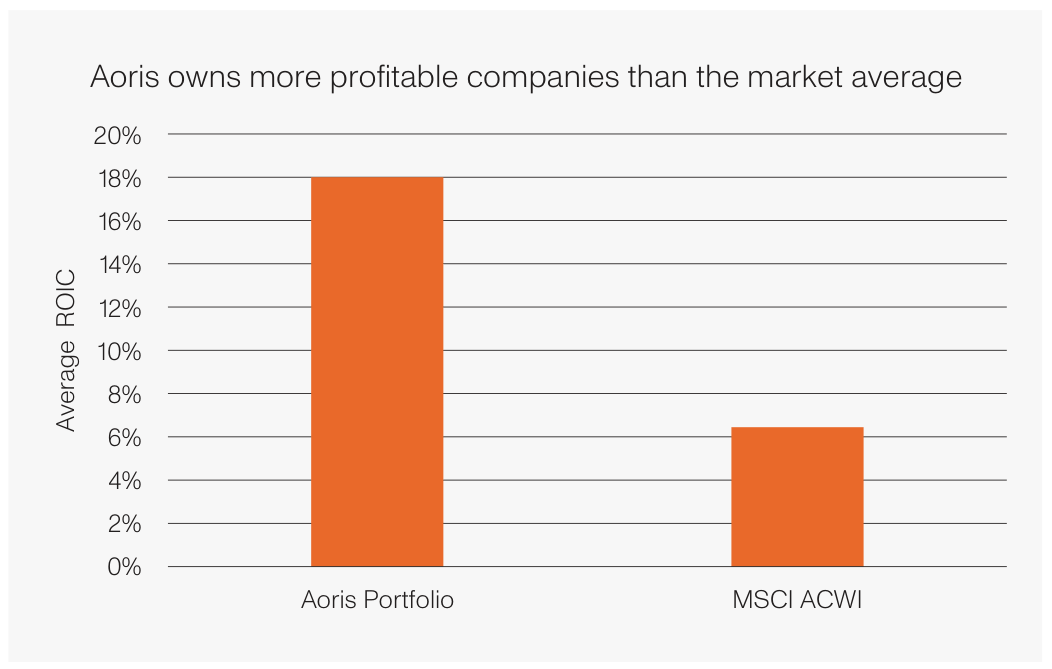
The higher profitability of the portfolio gives us far greater confidence in the ability of the underlying businesses to continue growing consistently and compounding wealth through time.
Net Debt/EBITDA
We looked at the balance sheets of consistently growing businesses and how they compared to that of the median company as well as inconsistently growing businesses.
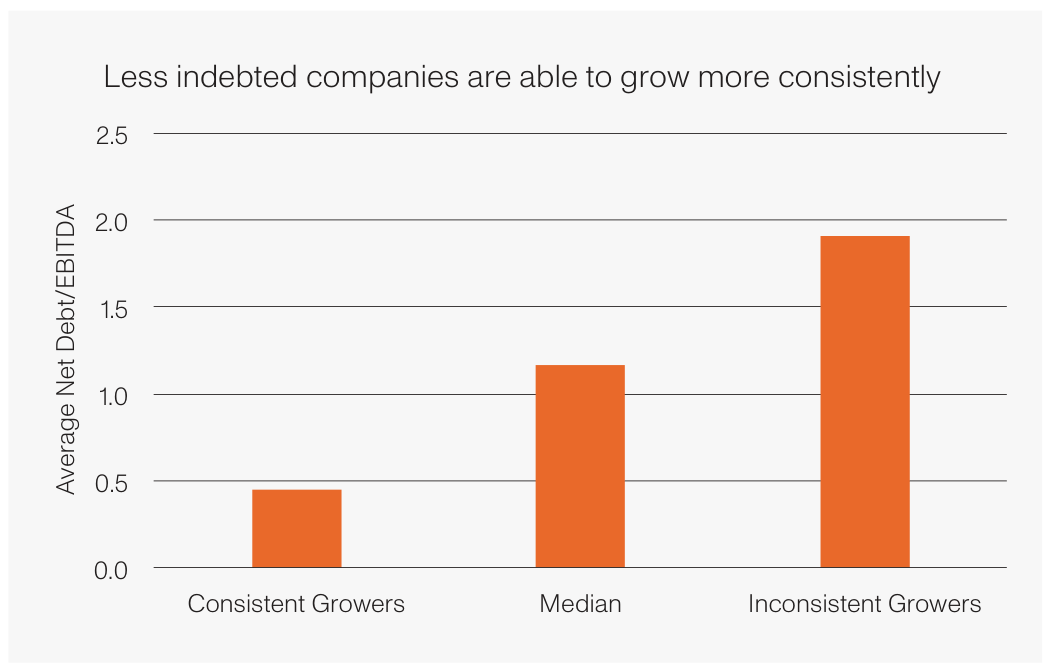
Our findings exhibit that consistently growing businesses are more conservatively financed than not only businesses that grow inconsistently, but also the median company.
High debt levels not only amplify the risks associated with a business but constrain growth as the burden of its interest expense diminishes the scope for investment.
Furthermore, management is more prone to making short- term decisions in a rising interest rate environment, like excessively cutting costs, which hinder growth.
Another example from our portfolio that illustrates how a conservative balance sheet enables businesses to consistently grow is Fastenal ( FAST ), one of the largest industrial distributors in the United States. It supplies goods used in both the final manufactured product and the running of factories of its many customers. In our study, the business averaged Net Debt/EBITDA of –0.1x – which means it had more cash on hand than debt – and grew at rates above the median company in 9 out of 10 years.
Fastenal is a remarkable business with a unique culture centred around frugality and customer service. Managers are incentivised to do more with less while being uncompromising in their ability to serve customers. This mindset filters into management’s choice to operate with low levels of debt. Fastenal is exposed to the industrial cycle and, by operating with lower amounts of debt, management has the confidence to invest in growth opportunities irrespective of the cycle.
Steady investments into its supply chain, methods of distribution and increasing density of in-person locations has enabled the business to become more relevant to its existing customers and win new customers, resulting in consistent growth.
Let’s look at how the balance sheets of our portfolio companies in aggregate compares to the universe of global listed companies represented by the MSCI ACWI.
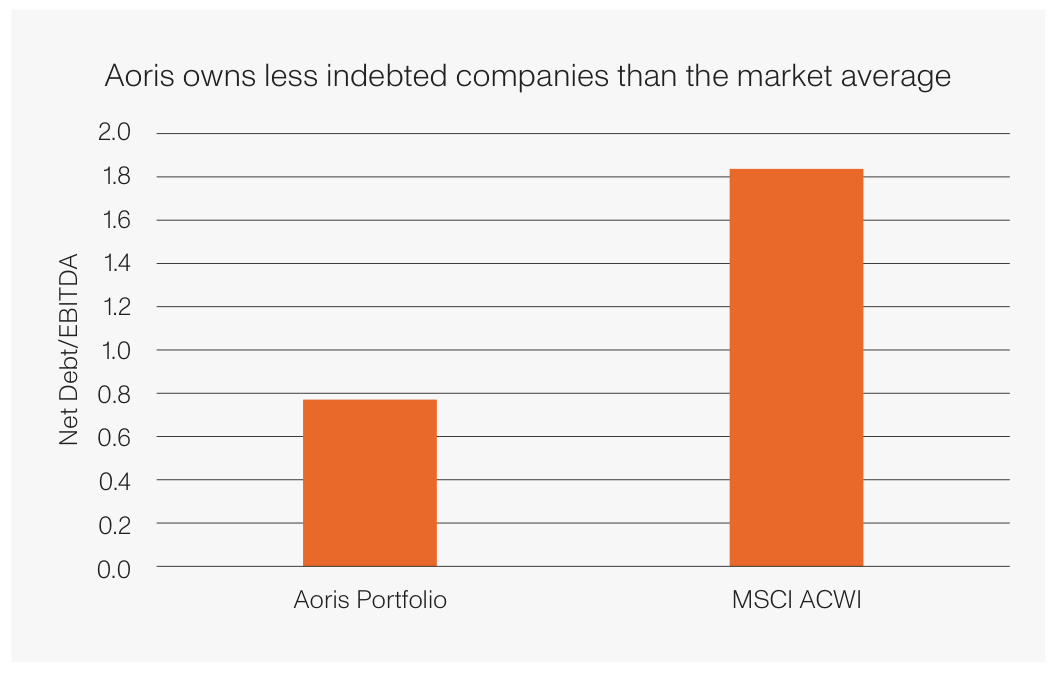
The lower financial leverage of the companies within our portfolio gives us confidence in their ability to continue investing through the cycle. There is also lower risk that management diverts their focus to ensuring profitability as the cost of debt increases and therefore forgo future growth.
What else do we look for when identifying businesses that consistently grow?
In addition to the two aforementioned quantitative attributes, we consider three qualitative factors when identifying consistently growing businesses.
High customer satisfaction and retention
Businesses with high customer attrition must replace lost customers to end up at the same starting point as in the period before, detracting from their ability to grow. Conversely, businesses that delight their customers with superior goods and services can devote more of their resources in acquiring new customers rather than replenishing lost customers. Furthermore, there is a reinforcing effect as happy existing customers act as ambassadors to attract new customers. Two metrics we look for as evidence for happy customers are customer satisfaction and customer retention.
An example from our portfolio that demonstrates this is Costco ( COST ), one of the largest general merchandise retailers in the world. Costco is fanatical about offering value to its customers and invests heavily in its own logistics, supply chain and inventory to do so. In fact, the company has kept the price of its famous hot dog and soda combo at $1.50 since 1985! This obsession of delivering value to customers rewards Costco with among the highest customer satisfaction scores in its industry, translating to member retention rates of 90% worldwide. Additionally, the allure of better value draws more consumers into Costco, which grows their membership base and enables them to consistently grow revenue faster than the average business.
Management with long-term thinking
In our March 2022 feature article, The importance of corporate culture , we explored the detriments of short- term thinking by management teams. We referenced a study conducted by the US National Bureau of Economic Research, which found that 80% of executives would cut research and development expenses if it meant hitting quarterly earnings targets.
Consistent growth over a long period is therefore impaired by the short-termism exhibited by many management teams. We look for companies with management teams who invest for long-term growth rather than harvesting profits in the near term to meet their incentive objectives.
A great example of this is Graco, the leading producer of fluid management products, such as spray guns for professional painters. At the onset of the pandemic, management at Graco decided to invest heavily into its manufacturing and distribution capabilities. This hurt the company’s earnings growth in the interim, but proved to be an advantage in capturing demand as it recovered in 2021. Management’s long-term thinking guided this decision, which enabled the business to grow revenues and capture market share.
Market leadership in competitively stable markets
Leading businesses have achieved their positions by virtue of their enduring competitive advantages, be it scale, cost advantages or superior customer service. Businesses that operate in growing markets where market share does not fluctuate wildly maintain their leadership position and are more likely to exhibit consistent growth. They are less threatened from the likes of disruption and new entrants. This means the risk is far lower of them becoming less relevant to their customers and therefore not growing.
Moreover, businesses that have already established themselves tend to receive more leeway from customers in the event they do make a mistake, whereas customers are likely to be unforgiving with upstarts where the cost to switch may be low. This stability among competitors and customers offers a better probability for a business to grow consistently.
Take the luxury giant LVMH, for example. LVMH is the world’s largest luxury goods business and owns renowned brands such as Louis Vuitton, Dior, Bulgari, Moët, and Hennessy. These brands have long histories, some spanning centuries, and operate in very stable and resilient markets. Due its leadership position, LVMH has the scale to invest heavily into increasing the desirability of its brands, which fuels its growth and reinforces its leading position. Operating in an industry where the threat from new competition is low has allowed LVMH to deliver remarkably consistent growth over many years.
What is our sweet spot?
We want to own 15 of the best businesses in the world, which compound wealth over many years. This necessarily means owning companies that exhibit consistently above-average growth.
To raise our confidence in the growth prospects of portfolio companies, we actively seek businesses with the characteristics described throughout this feature article. That is, businesses
- that earn a high ROIC,
- are conservatively financed,
- have high customer retention,
- are led by long-term thinking management, and
- are leaders in competitively stable markets.
Conversely, we want to avoid businesses that are poor compounders of value through time. In practice, this means avoiding businesses that are declining in relevance themselves or are in an industry that is becoming less relevant to the broader economy.
Equally, we avoid exciting new businesses in hot markets that have high rates of growth. In fact, McKinsey & Company’s book Valuation , presents a study on the fleeting nature of high growth rates. The study shows that US companies growing at greater than 30% in Year 1, see their growth rates compress into the high single digits by Year 4. Not only are these businesses vulnerable to a slowdown in growth, but this is also often accompanied by a sizeable decline in valuation.
Success for Aoris is denoted not by timing cycles, picking a turnaround or finding the next business touted to change the world. It is by avoiding businesses that carry a higher risk of a disappointing outcome. We believe we can do so by remaining within our sweet spot, which is finding those companies that grow consistently through time.
Finding extraordinary businesses that grow consistently above the rate of the average business over a long period is difficult. However, we can make more informed judgements about which companies to include in our portfolio by identifying common characteristics exhibited by consistently growing businesses. We determined these as being businesses that earn a high ROIC, have low debt levels, are run by management with long-term thinking, have high customer retention and are market leaders within competitively stable markets.
In our view, owning businesses that exhibit such characteristics will reduce the likelihood of a disappointing outcome and generate higher returns for our investors over the long term.
Editor's Note: The summary bullets for this article were chosen by Seeking Alpha editors.
For further details see:
Aoris International Fund Q1 2023 Report