AIRC - Apartment Investment and Management: Aiming For Growth
2023-03-16 08:00:00 ET
Summary
- Over the past two years plus, Apartment Investment and Management (AIV), formerly Aimco, has massively outperformed the REIT average.
- Since splitting from Apartment Income REIT (AIRC), AIV has been reinventing itself as a highly leveraged value-add and opportunistic apartment REIT.
- AIV is currently selling at a price that is slightly cheap for a true growth stock, but the jury is still out on AIV's growth proposition.
- This article examines growth, balance sheet, dividend, and valuation metrics for this small-cap Apartment REIT.
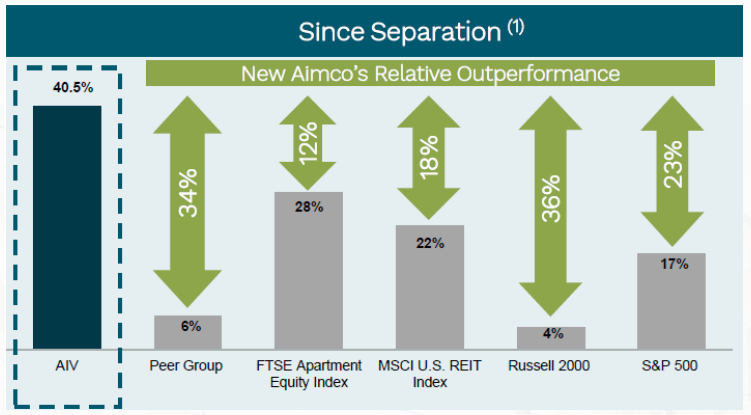
On December 15, 2020, the day it split from Apartment Income REIT ( AIRC ), shares in Apartment Investment and Management ( AIV ), also known as Aimco, suddenly leapt to $5.04 at the close. Since then, in a period of 2 years and 3 months, AIV shares have added more than 40%. By contrast, the average REIT, as represented by the Vanguard Real Estate ETF ( VNQ ), has gone from $85.74 to its recent closing price of $80.81, thus losing (-5.8)%. That's a 45-point difference, in just a little over 2 years. In addition, AIV has outperformed the FTSE Apartment Equity Index, 40%-28%, since December of 2020.
What accounts for this massive outperformance? Will it continue?
Meet the company
Headquartered in Denver, Aimco was founded in 1975, and incorporated as a REIT in 1994. In December of 2020, AIV split into two companies, spinning off Apartment Income REIT.
AIV currently owns 20 stabilized apartment complexes, totaling about 5600 units. Average daily occupancy as of December 31 stood at 97.4%. The average monthly rent is $2170, reflecting a 10%-64%-26% mix of Class A, Class B, and Class C properties, respectively. The average income of new AIV tenants is slightly over 4 times the average monthly rent.
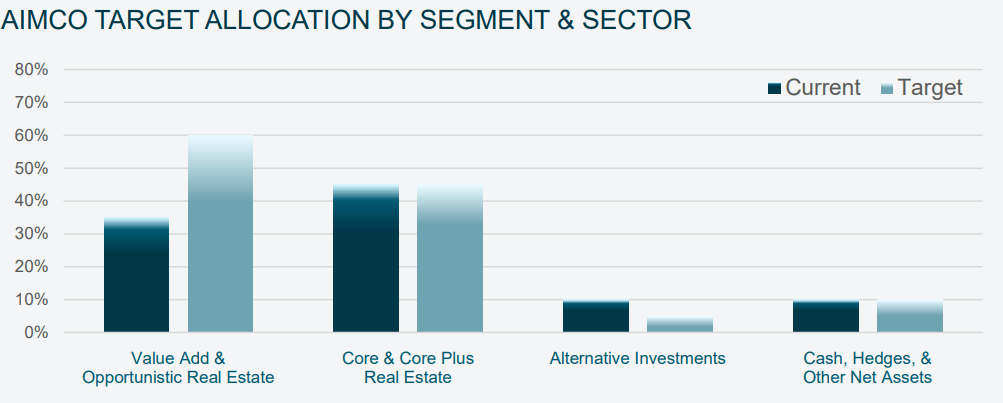
Since splitting from Apartment Income REIT, AIV has been reinventing itself as a highly leveraged REIT focused on value-add and opportunistic apartment acquisitions. Such ventures currently comprise 35% of AIV's asset allocation, but the company aims to raise that proportion to the 40% - 60% range. By contrast, stabilized core real estate assets make up 45% of AIV's mix right now, but the company seeks to lower that percentage to the 35% range, as shown in the graphic below.
To this end, AIV has disposed of about $1 billion worth of assets. In order to fund its ambitious development and redevelopment pipeline, the company has also raised $600 million in fixed-rate debt and secured another $360 million from Alaska Permanent Fund Corporation.
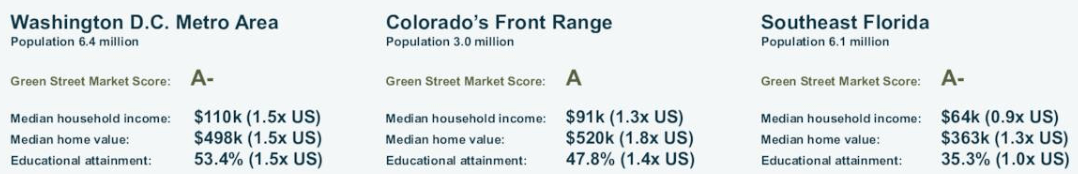
The company's pipeline is concentrated almost entirely in 3 U.S. metropolitan areas, all of which have Green Street Market Scores of A or A-:
- South Florida (80%),
- Washington, DC (17%), and
- Denver (3%)
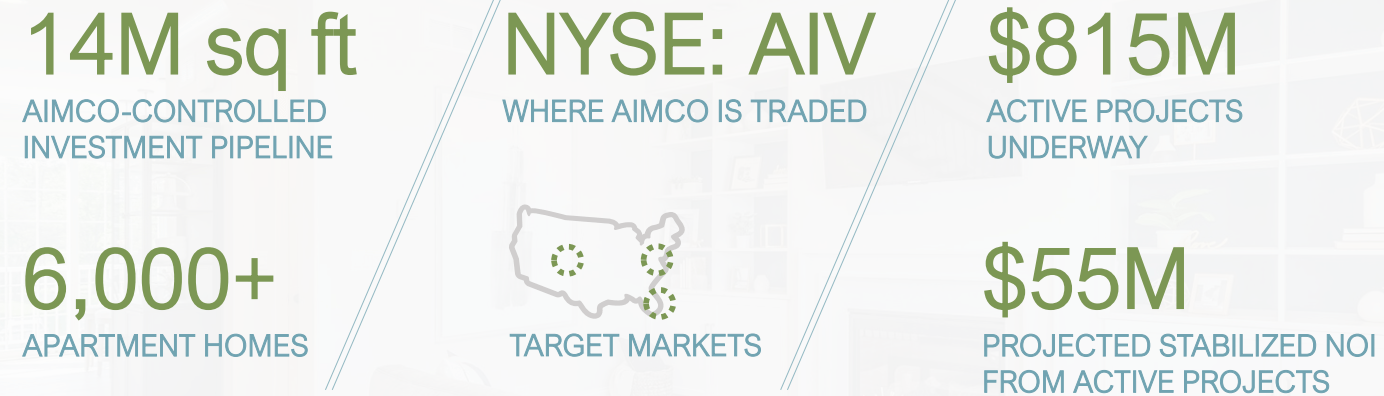
The pipeline includes more than 6000 apartment homes (which would more than double the size of AIV's portfolio), totaling 14 million square feet. The company currently has $815 million invested in projects currently underway, and expects those projects to bag $55 million per year (6.7%) in NOI (net operating income) when stabilized.
But this only scratches the surface of the pipeline's potential, which could exceed $5 billion by the time all is said and done.
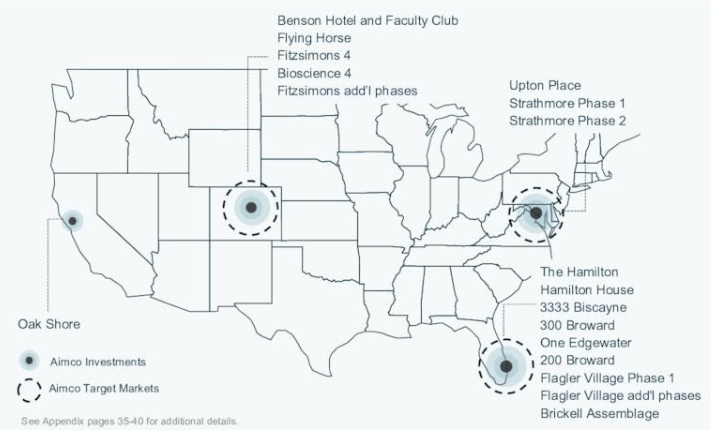
The map below shows the locations of the 18 development projects set to start in the next 4 years. Of these, half are in South Florida, five are in the Denver area, three are in the DC area, and there is one lonely outpost in the San Francisco Bay area.
AIV management plans to fund all this development with 50% - 60% loan-to-cost construction loans, but AIV's equity would only be about 10 - 15% of the total cost, with the remaining costs funded by joint venture partners and construction debt. In fact, the equity the company currently has embedded in this pipeline already exceeds the total they expect will be eventually required.
Management calculates that this approach to financing the build-out will increase the company's levered IRR from 21% to 35%, as shown below. If 3rd parties foot 40% of the development cost, the JV partners can realize a 50% return on their investment in the pipeline, while AIV still rakes in more than double.
Company investor presentation
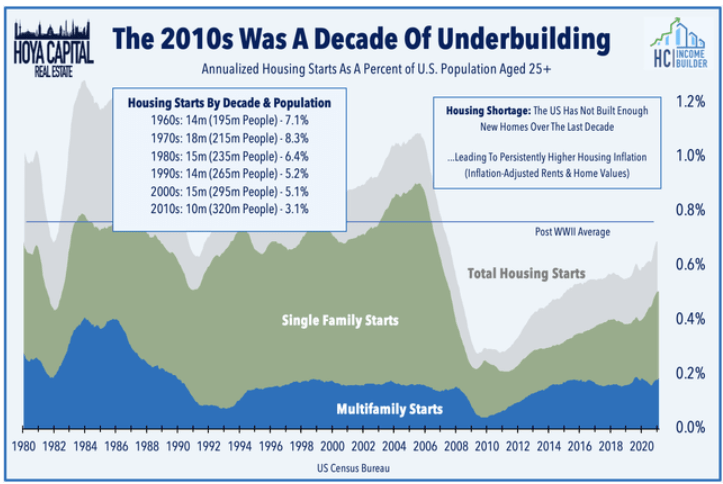
According to their Q4 2022 earnings supplemental , AIV management sees "a lingering supply and demand imbalance" in rental housing. Hoya Capital agrees. According to Hoya Capital's most recent report on the Apartment REIT sector ,
Elevated rent growth and stretched affordability metrics are perhaps the most obvious indication of a lingering undersupply of housing, as Freddie Mac estimates that the U.S. housing market is still more than 3 million housing units short of what's needed to meet the country's demand.
Hoya's report continues,
As noted above, we see the best opportunities in REITs focused on secondary and suburban markets, which are seeing more limited supply growth and prefer REITs that focus their external growth on value-add improvements over ground-up development.
That focus on value-add projects is right in AIV's wheelhouse.
Quarterly and 2022 results
Q4 2022 revenue from its stabilized operating portfolio was up 9.5% YoY (year over year) and NOI from that segment was up 10.0% YoY. Occupancy slid 140 bps (basis points) from 98.8% to 97.4% YoY, but rose 140 bps from Q3. Meanwhile, Q4 operating expenses rose 8.3% due to higher real estate taxes, utilities, and insurance.
| Metric |
| Q4 2022 |
| incr. YoY |
| Full-yr 2022 |
| incr YoY |
| Revenue (millions) |
| $42.0 |
| (-10.2)% |
| $190.3 |
| 12.1% |
| Operating Expenses (millions) |
| $41.4 |
| (-14.6)% |
| $270.4 |
| 45.8% |
| Net Income (millions) |
| (-$205.3) |
| NA |
| $92.1 |
| NA |
| Net Income/Diluted Share |
| (-$1.34) |
| NA |
| $0.50 |
| NA |
| Shares Outstanding (millions) |
| 148.8 |
| 149.5 |
| 150.8 |
| 149.5 |
Source: AIV Q4 2022 Earnings Supplemental
Net income for Q4 was drastically affected by a non-cash impairment charge related to a mezzanine investment (decline in value of underlying collateral). Full-year percent increases in net income could not be calculated, because 2021's figures were negative.
For the full year, NOI from operating properties rose 14.2%, but AIV management projects this will fall to the 5 - 7% range in 2023. New lease spreads averaged 9.5% in 2022, and renewal spreads averaged 22.5%, as Aimco retained 56.7% of tenants with expiring leases.
AIV expects to cut its interest rate expense almost in half in 2023, from $74 million to $40.5 million at the midpoint.
Since January 1, 2022, Aimco has repurchased more than 4.2 million shares of its common stock at a weighted average price of approximately $7.24 per share.
Growth metrics
Here are the 3-year growth figures for FFO (funds from operations) and TCFO (total cash from operations). They are reflective of a company trying to recover from the double whammy of being sawed in half, right in the middle of a pandemic.
| Metric |
| 2019 |
| 2020 |
| 2021 |
| 2022 |
| 3-year CAGR |
| FFO (millions) |
| $327 |
| NA |
| NA |
| NA |
| -- |
| FFO Growth % |
| -- |
| -- |
| -- |
| -- |
| NA |
| FFO per share |
| $3.10 |
| $2.94 |
| (-$0.04) |
| $0.49 |
| -- |
| FFO per share growth % |
| -- |
| (-5.2) |
| NA |
| NA |
| (-45.9)% |
| TCFO (millions) |
| $374 |
| $48 |
| $13 |
| $204 |
| -- |
| TCFO Growth % |
| -- |
| (-87.2) |
| (-72.9) |
| 1469.2% |
| (-18.3)% |
Source: TD Ameritrade, Hoya Capital Income Builder, and author calculations
Total FFO figures for AIV have not been available on Seeking Alpha, nor on TD Ameritrade, since 2019.
Meanwhile, here is how AIV stock price has done over the past 3 twelve-month periods, compared to the REIT average as represented by the Vanguard Real Estate ETF ( VNQ ).
| Metric |
| 2020 |
| 2021 |
| 2022 |
| 2023 |
| 3-yr CAGR |
| AIV share price March 13 |
| $6.13 * |
| $5.30 |
| $7.05 |
| $7.13 |
| -- |
| AIV share price Gain % |
| -- |
| (-13.5) |
| 33.0 |
| 1.1 |
| 5.2% |
| VNQ share price March 13 |
| $79.48 |
| $91.62 |
| $103.67 |
| $81.87 |
| -- |
| VNQ share price Gain % |
| -- |
| 15.3 |
| 13.2 |
| (-21.1) |
| 1.0% |
* prior to split with AIRC
Source: MarketWatch.com and author calculations
March 13, 2020 was before the split with AIRC. Even taking that into account, AIV has substantially outperformed the VNQ on share price over the past 3 years.
Balance sheet metrics
Here are the key balance sheet metrics. Despite the low liquidity ratio, and high debt ratio and debt/EBITDA, AIV carries a bond rating of BBB.
| Company |
| Liquidity Ratio |
| Debt Ratio |
| Debt/EBITDA |
| Bond Rating |
| AIV |
| 1.34 |
| 52% |
| 12.1 |
| BBB |
Source: Hoya Capital Income Builder, TD Ameritrade, and author calculations
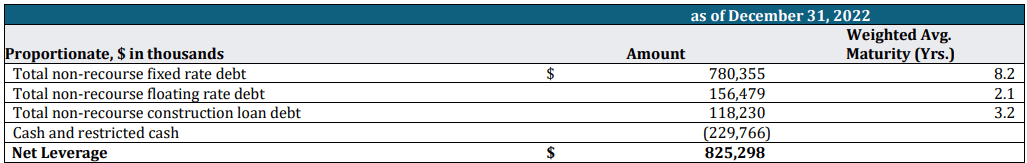
In 2022, AIV made great strides, refinancing or retiring more than $1 billion of near-term liabilities, eliminating most of its floating rate exposure, and nearly doubling the weighted average term to maturity. As of December 31, AIV held just under $230 million in cash and equivalents, over against $1.05 billion in debt, with an overall weighted average term to maturity of 3.6 years. Of that total, $156 million, or 14.8%, is held at floating rates, with an average term to maturity of 2.1 years. Of that 14.8%, all but 2% is hedged with interest rate cap protection.
Although the above metrics look messy, AIV is following in the footsteps of NexPoint Residential ( NXRT ), which relies on value-add acquisitions, and is more leveraged than the average Apartment REIT, due to their business model. Yet for the 5-year period from April 6, 2017 to April 6, 2022, NXRT ranked number 3 in all of REITdom for total return, at a 5-year CAGR of 29.5%, despite having a bad-looking leverage ratio of just 1.31 (similar to AIV's current 1.34) through Q1 2022. So it is a business model that can work very successfully, under the right conditions.
| Company |
| Price 4/6/17 |
| Price 4/6/22 |
| 5-year CAGR |
| Liquidity 3/31/22 |
| NXRT |
| $24.80 |
| $90.14 |
| 29.5% |
| 1.31 |
Source: MarketWatch.com and TD Ameritrade
Dividend metrics
AIV does not pay a dividend currently. Apart from a 2-cents-per-share distribution last summer, the company has not paid a dividend since October, 2020, and makes no mention of any firm plans to do so, in its recent filings.
| Company |
| Div. Yield |
| 3-yr Div. Growth |
| Div. Score |
| Payout |
| Div. Safety |
| AIV |
| 0.00% |
| 0.00% |
| 0.00 |
| 0% |
| -- |
Source: Hoya Capital Income Builder, Seeking Alpha Premium
Dividend Score projects the Yield three years from now, on shares bought today, assuming the Dividend Growth rate remains unchanged.
Valuation metrics
AIV is trading at 14.6x FFO '22, which is distinctly below the sector average, but not exactly cheap. The (-16.1)% discount to NAV is distinctly less steep than the Apartment sector average, and slightly less than the overall REIT average. AIV is clearly not a value play. From a growth investor's viewpoint, it is odd for a growth stock to be priced this low. Companies priced a bit above average are usually a better bet .
| Company |
| Div. Score |
| Price/FFO '22 |
| Premium to NAV |
| AIV |
| 0.00 |
| 14.6 |
| (-16.1)% |
Source: Hoya Capital Income Builder and author calculations
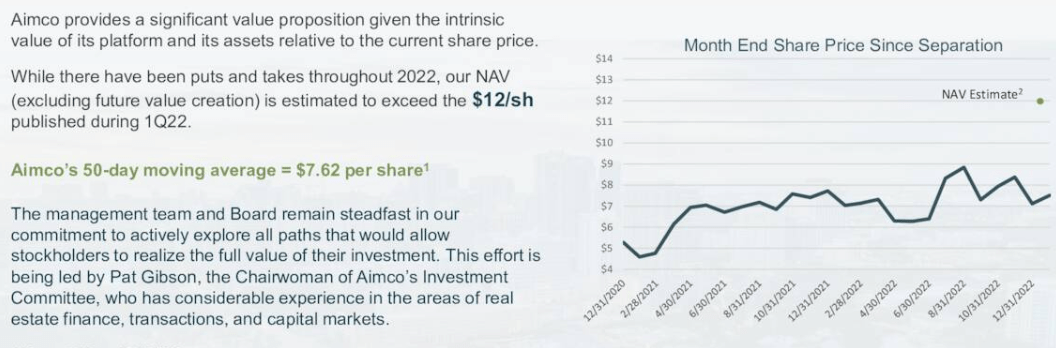
AIV management considers its NAV to exceed $12 per share. Hoya Capital Income Builder disagrees, placing it closer to $8.50, and sees AIV as neither underpriced nor overpriced at its March 13 closing of $7.13.
What could go wrong?
AIV is not yet profitable. The company forecasts a net loss of $0.23 to $0.33 per share for 2023, and it is carrying a heavy debt load.
The company's strategy relies on JV (joint venture) partners to help finance the development pipeline. If any of those JV partners prove unreliable, it could affect AIV's bottom line significantly.
Apartment supply will soon catch up with demand. Again according to Hoya ,
Soaring rents sparked a wave of new development that will come to market over the next 18 months . . . The pipeline of under-construction units has swelled to nearly 1 million units in early 2023, up considerably from the roughly 450k peak during the prior two development peaks in 1985 and 2007.
Hoya Capital Income Builder
The company is not very forthcoming about its financial condition. Even its annual 10-K has only very skimpy numerical details. Where most companies go into great detail with hard numbers about their portfolio, their tenants, their balance sheet, maturity schedule, lease expirations, operating performance, and so on, AIV provides only a cursory statement of Net Operating Income and a simple calculation of EBITDAre. Otherwise, the numbers are embedded in lots and lots of verbiage.
Investor's bottom line
AIV is clearly a growth proposition, not a value investor's play. As a growth proposition, it has a lot going for it, but with high risk and a balance sheet that will take a while to round into shape. REIT prices in general are on the low side of their historical range, at just 17.1x trailing 12-month FFO, which augurs well for all growth REITs. For growth investors willing to hold AIV shares for 2 - 5 years, I might rate this company a cautious Buy, albeit with a small allocation due to the company's small size and volatility (34.9%), if they were more transparent about their numbers.
There is no Wall Street analyst coverage for this company. Seeking Alpha's Quant system does not list it, and Zacks shows no rating. The Street and Ford Equity Research both rate AIV a Buy, and TipRanks rates it Outperform (8 out of 10).
But as always, the opinion that counts the most is yours.
For further details see:
Apartment Investment and Management: Aiming For Growth