TSM - Applied Materials: A Peter Lynch Chip Play
2023-05-10 14:35:21 ET
Summary
- Several aspects of Applied Materials, Inc. fit Peter Lynch's description of a fundamentally sound stock.
- The Applied Materials, Inc. balance sheet looks great, with current assets trending way above long-term debt.
- The trailing 5-year GAAP EPS CAGR is over 20% boosted by some nice buybacks since 2017.
- Down 32% from the high, this could be a great time to get in while the growth rate exceeds the P/E.
- Although Applied Materials pays a low dividend of only 1.11%, it has a lot of room to grow, with a payout ratio of only 13.25% and growth for the last 5 years.
Can't have Silicon Valley without silicon
An interesting play that I've been in due to indexing Joel Greenblatt's Magic Formula is Applied Materials, Inc. ( AMAT ). It continues to screen well as a company with high ROIC and a relatively cheap earnings yield. AMAT stock has never been a top-down analysis for me, simply one picked up based on the two aforementioned metrics. Noticing that it remained on the screener for large caps while other semi-industry names like Intel Corporation ( INTC ), Advanced Micro Devices, Inc. ( AMD ), and Micron Technology, Inc. ( MU ) have dropped off the screener completely. A deeper dive reveals an amazing Applied Materials balance sheet and very nice EPS growth in the face of significant industry headwinds.
Now, realizing that Applied Materials is playing the industrial machinery and silicon production support role, it makes a lot of sense that the business has remained resilient. One of their main products, Centura RP Epi and others, are the backbone of growing silicon used for chip wafers.
The company has a low trailing 5-year PEG ratio and current assets trending way above long-term debt, this stock fits two of Peter Lynch's main criteria. Applied Materials is a buy and one that could be the primary beneficiary of all the new chip FABs coming online in the next 3-5 years. They sell the equipment to the FAbs and there will be a lot of demand for that equipment. AMAT stock is a strong buy at these prices.
The chart
Applied Materials had always seemed expensive to me when I was paying attention and I never investigated taking oversized positions. Now that we're 32% off the high, I'm interested.
The GAAP multiple compression is now attractive. The stock was trading at 33 X GAAP earnings not too long ago. This juicy hamburger is now more than half off from an earnings yield perspective.
What they do
A description of Applied Materials business from the most recent 10K :
Applied's Semiconductor Systems segment develops, manufactures and sells a wide range of manufacturing equipment used to fabricate semiconductor chips, also referred to as integrated circuits (ICs). The Semiconductor Systems segment includes semiconductor capital equipment used for many steps of the chip making process including the transfer of patterns into device structures, transistor and interconnect fabrication, metrology, inspection and review, and packaging technologies for connecting finished IC die. Applied's patterning systems and technologies address challenges resulting from shrinking pattern dimensions and the growing complexity in vertical stacking found in today's most advanced semiconductor devices.
Applied Materials clients
With 42% of business coming from established relationships with Samsung Electronics Co., Ltd. ( SSNLF ), Intel Corporation (INTC), and Taiwan Semiconductor ( TSM ), that is an awesome lineup of partners building new FABs that will create even more revenue for Applied Materials. In essence, the partners endure all the enormous capital expense and Applied Materials gets to step in and sell them products for their supply chain after the fact.
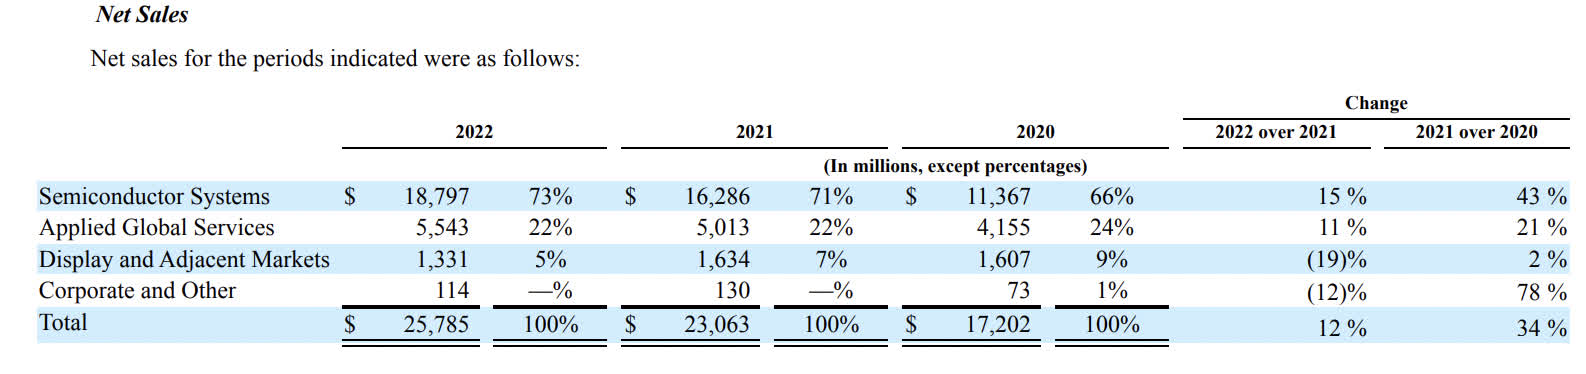
I highlighted Semiconductor Systems in this article because that is not only 73% of Applied Materials revenue (and growing), but it is also the obvious growth thesis.
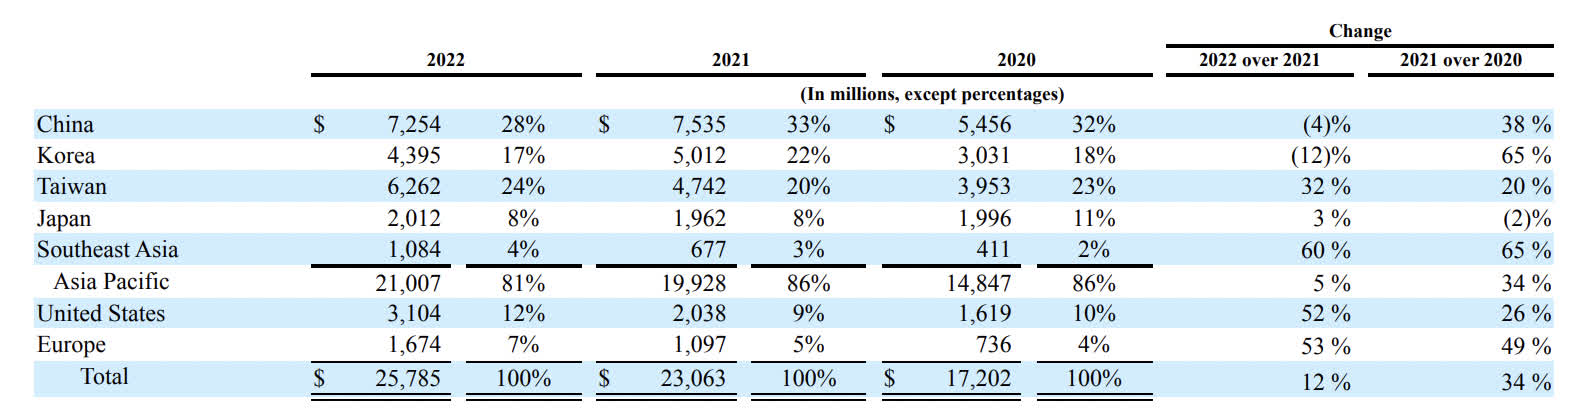
The big glaring problem in the semiconductor space, in general, is sales to China. If the U.S. government places more and more restrictions on semiconductor sales to China and possibly the supply chain infrastructure items, that could be a big hit to 28% of the revenue. Overall, 81% reliance on the Asia Pacific region could be an issue if the region gets more tense than it already is. Taiwan representing 24% poses the same issues as the 28% from China. Those percentages could change due to uncontrollable geopolitical issues.
On a bright note, Taiwan Semi's expansion into Arizona as well as Intel's well-documented FABs under construction should move lots of that revenue back to the U.S.
South Korea is the least tumultuous region in the Asia Pacific territory, and Samsung is vowing to invest enough to one day overtake Taiwan Semiconductor:
As part of the project, Samsung Electronics said it will invest $230 billion over the next 20 years to ramp up semiconductor manufacturing. According to a report from the Associated Press , the fab mega cluster will be established in Gyeonggi Province by 2042 and will be anchored by five new chip plants built by Samsung.
The more the merrier. I find it hard to see a scenario under which Applied Materials finds it hard to grow the top line.
Earnings growth rate, pricing PEG
For those unfamiliar with Peter Lynch, he ran Fidelity's Magellan Fund, and between 1977 and 1990 the fund averaged over a 29% annual return, making Magellan the best-performing mutual fund in the world. The PEG ratio equation laid out in One Up on Wall Street and Beating the Street is quite simple, find the trailing 3-5 years compound annual growth rate in earnings per share, drop the percent sign and then divide the current P/E ratio by that number. When the ratio is 1 or sub-1, then you've found a bargain. Inversely, taking the growth rate without the percent sign, using that as the multiplier and TTM EPS as the multiplicand will get you the PEG 1 fair price target.
With $3.00 to $7.49 EPS growth from 2018 to TTM, that's a GAAP earnings CAGR of 20%. This checks the first box from Peter Lynch's One Up on Wall Street , growth! Now trading at 15 X GAAP earnings and a forward EPS estimate of $7.04, that gives us a fair price using the trailing 5-year PEG ratio of $140.8 considering a 20 X fair EPS multiple times $7.04 forward EPS, or a 23.5% upside. While earnings are expected to recede a bit, I can only see it tracking the trailing CAGR over the next 5 years with all the semiconductor infrastructure being built around the world.
Buybacks
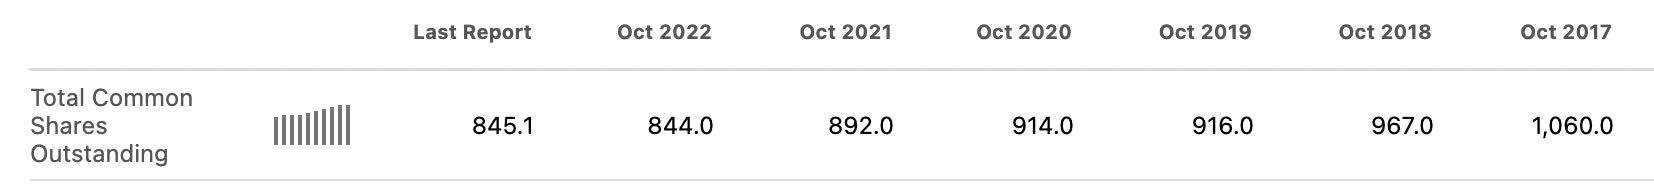
1.06 billion shares outstanding in 2017 to 845 million shares at current. A 20% share reduction since 2017 has done a wonderful job maintaining a steady growth in EPS. This is a company that certainly has capital returns to the investor in mind. The float reduction should only help dividend growth in the future.
Current assets vs LT debt
Here comes the obvious. I tout time and again that Peter Lynch loves to see current assets trending well ahead of long-term debt. In a recent popular interview on CNBC, Peter Lynch restates this simple analysis of the balance sheet. At almost $16 Billion in current assets to $5.45 Billion in long-term debt, this is one of the best balance sheet trend lines in the semiconductor space and the stock market in general.
Joel Greenblatt might like it too
As mentioned, I was originally in this one because it screened well on Joel Greenblatt's Magic Formula, adding the earnings yield to the ROIC to come up with a score.
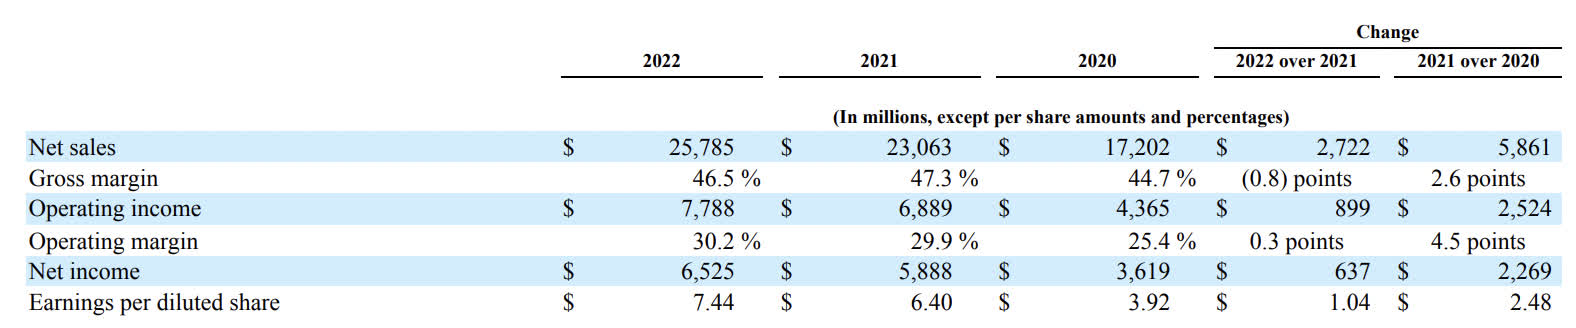
The company is still showing growth in its operating margin when others in the industry are seeing a contraction. Applied Materials is not a direct comp to the semiconductor designers and producers, but they will get lumped into the sector ETFs and move with them as a whole. Here we have the benefit of grabbing a stock brought down by bad comps that is still performing well.
With an ROIC of 36.39% and a GAAP earnings yield of 6.6%, we get a Magic Formula score of 42.96. This is certainly the best score you will find in semiconductors for stocks that are both "good" and "cheap."
Competition margin trends
In the semiconductor infrastructure segment, competition is as follows:
- Lam Research ( LRCX ) Gross margin 45.62% , operating margin 31.14%
- KLA Corp ( KLAC ) Gross margin 60.34% , operating margin 39.65%
- Teradyne ( TER ) Gross margin 59.51% , operating margin 26.91%.
While all of these companies do something slightly different than Applied Materials, they compete in different segments of Applied Materials many businesses. The industry as a whole enjoys huge margins but also requires ample research and development expense. These names also show up on large-cap screens for high ROIC low earnings yields Magic Formula stocks.
Applied Materials gross and operating margins are consistent with the industry, a bit low on the gross side but above average on the operating side. The support industry as a whole looks like the best place to bet when the cyclical semiconductors turn around rather than the chips themselves.
The dividend and free cash flow
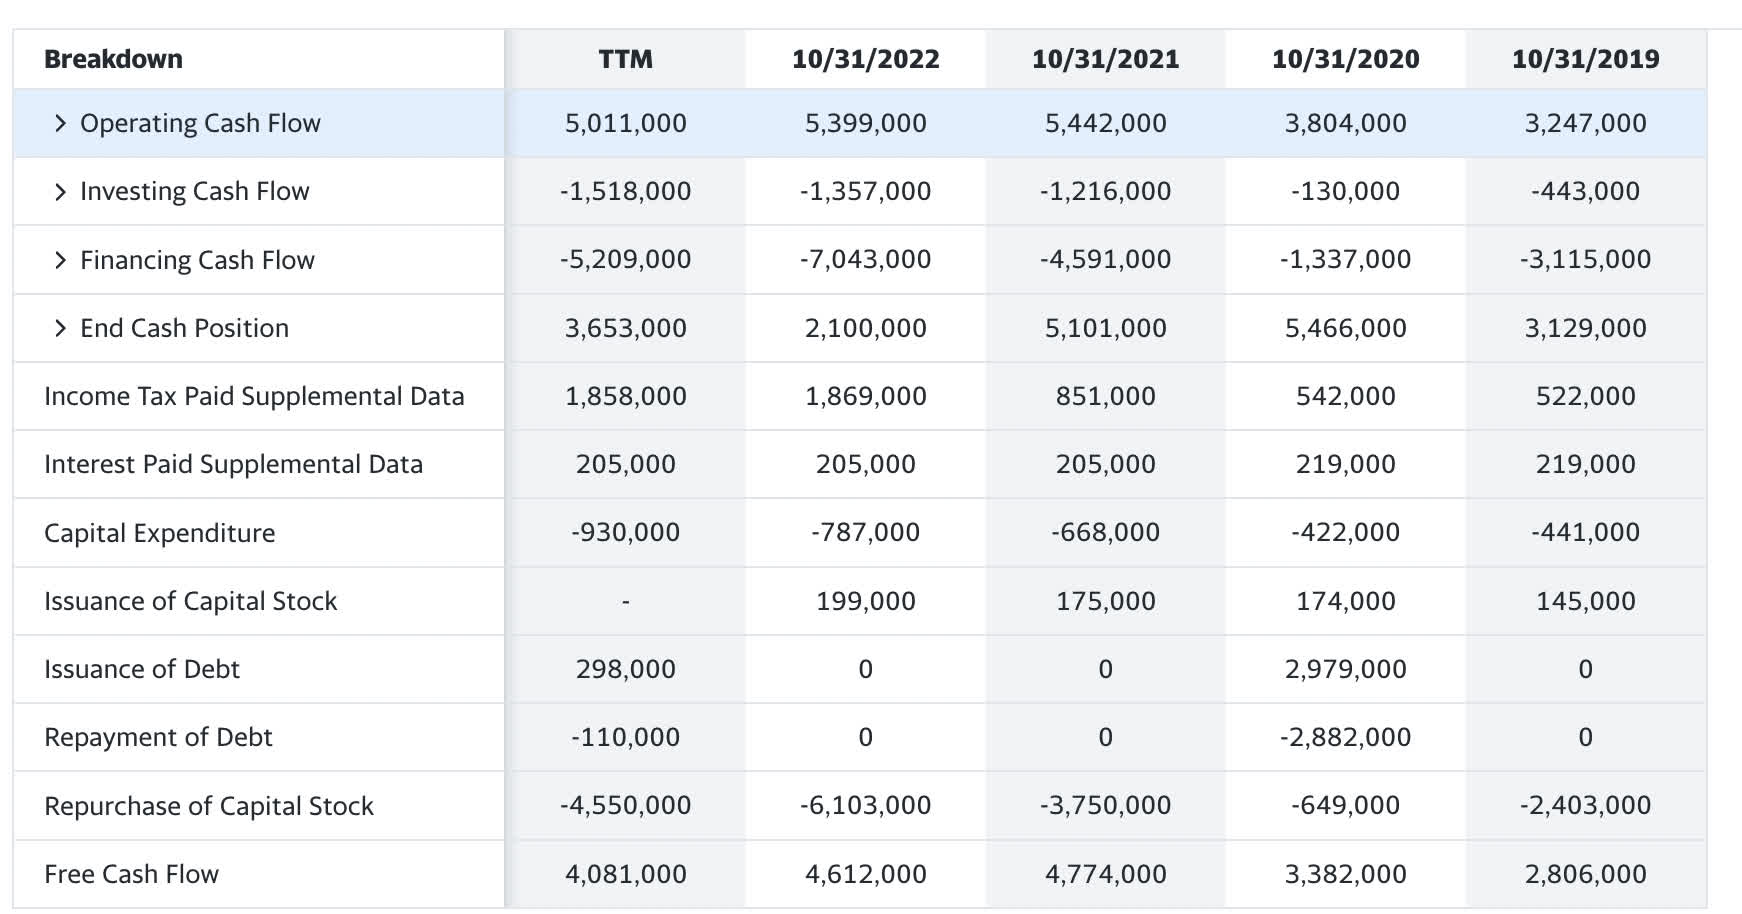
The trigger that set off the alarm bells for many during the initial stages of Intel's FAB buildout was the subsequent drop into negative free cash flow. After a few quarters of that, the dividend was bound to be cut. Here we can see free cash flow is still strong at $4.08 Billion. With a forward dividend of $1.28/share and 845 million shares outstanding, that's a forward dividend liability of $1.081 Billion. The dividend is 3.77 X covered by free cash flow. Plenty of room to grow and a wide margin of safety.
Catalysts
This stock should report a growth on the top line as each partner brings a new FAB online. I'd be looking at semiconductor FAB construction timelines to estimate subsequent pops. Smart fund managers will probably want to get ahead of this one before each partner opens up shop.
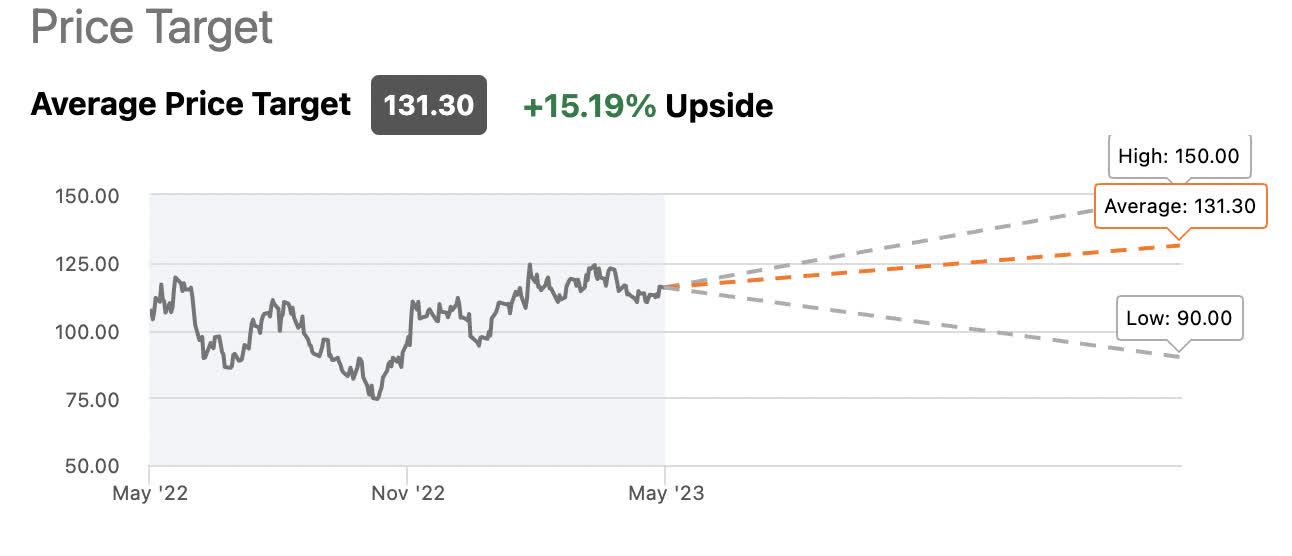
My price target is on the high end of Wall Street's target at around $140. The stock is undervalued in my opinion and I think any positive news in the semiconductor industry should send Applied Materials up faster than others.
Risks
Geopolitical risks and a further deterioration of their LCD segment as demand for televisions wanes. The display market revenue decreased by 19% YOY. However, CFRA analyst Keven Young believes that the degradation of that segment may even out due to new foldable screen phones that Applied Materials can take advantage of in the LCD segment.
Company specific risks from the 10K
- Manufacturing, Raw Materials and Supplies: Applied has implemented a distributed manufacturing model under which manufacturing and supply chain activities are conducted in various countries, primarily including China, Israel, Singapore, Taiwan, the United States and other countries in Asia.
- Research, Development and Engineering: Applied's product development and engineering organizations are located primarily in the United States, as well as in China, Europe, India, Israel, Korea, Singapore and Taiwan. In addition, certain outsourced RD&E activities, process support and customer demonstrations are performed in the United States, India, China, Singapore and Taiwan.
The company-specific risks for Applied Materials manufacturing certainly lie in their supply chain being connected to China and Taiwan. This goes for both raw materials, parts, and R&D labs. Asia Pacific geopolitical tension affects the industry as a whole, but Applied Materials seems to be less insulated than others in this regard.
Conclusion
I rarely tag strong buys on articles, but Applied Materials, Inc. is being unfairly lumped together with the rest of the semiconductor sector. They should benefit from the worldwide FAB expansion without having to endure huge amounts of capital outlays themselves. Applied Materials, Inc. margins remain strong, have bought back 20% of shares over 5 years, have a low PEG ratio on a trailing basis, solid free cash flow, and a nice balance sheet. Although Wall Street predicts slow to negative EPS growth in the upcoming year, I wouldn't be surprised to see Applied Materials, Inc. beat all expectations.
The biggest issue has nothing to do with the company financials, but Applied Materials reliance on global outsourcing. If the world returns to calm, normalcy, this could be one of the best buys in the market. If the political environment worsens, the supply, R&D and parts expense could increase significantly. This would shrink margins and ROIC.
Regardless, the next 1-2 years could be tough for the industry as a whole. I see this as an opportunity to grab some great names that are now floating in the anti-bubble of hated chip stocks. Applied Materials, Inc. is a strong buy here, and I will continue to accumulate below $140.
For further details see:
Applied Materials: A Peter Lynch Chip Play