TSM - Applied Materials: Ready To Move Higher (Technical Analysis)
2023-09-27 02:48:41 ET
Summary
- Applied Materials is a leading provider of semiconductor equipment and its products and services will be crucial for the development of AI in the next decade.
- Option activity suggests a positive outlook for AMAT, with the "puts to calls" ratio at a historically high level.
- Technical indicators, such as the RSI, Bollinger Bands, and On Balance Volume, all support the expectation of higher prices for AMAT for the intermediate term.
Applied Materials, Inc. ( AMAT ) is an American company that provides machinery, support services, and software for the production of flat panel displays for computers, cellphones, televisions, and solar devices, as well as semiconductor (integrated circuit) chips for electronics. Based on revenue, the firm is the leading provider of semiconductor equipment worldwide and is headquartered in Santa Clara, California. Its products and services will be vital to the development of AI over the next ten years.
The long-term technical picture of AMAT is very strong. This positive outlook is reinforced by option activity that normally occurs just before prices move higher.
The AMAT 'Put to Calls' Ratio is at a Level That Normally Occurs Just Before an Advance
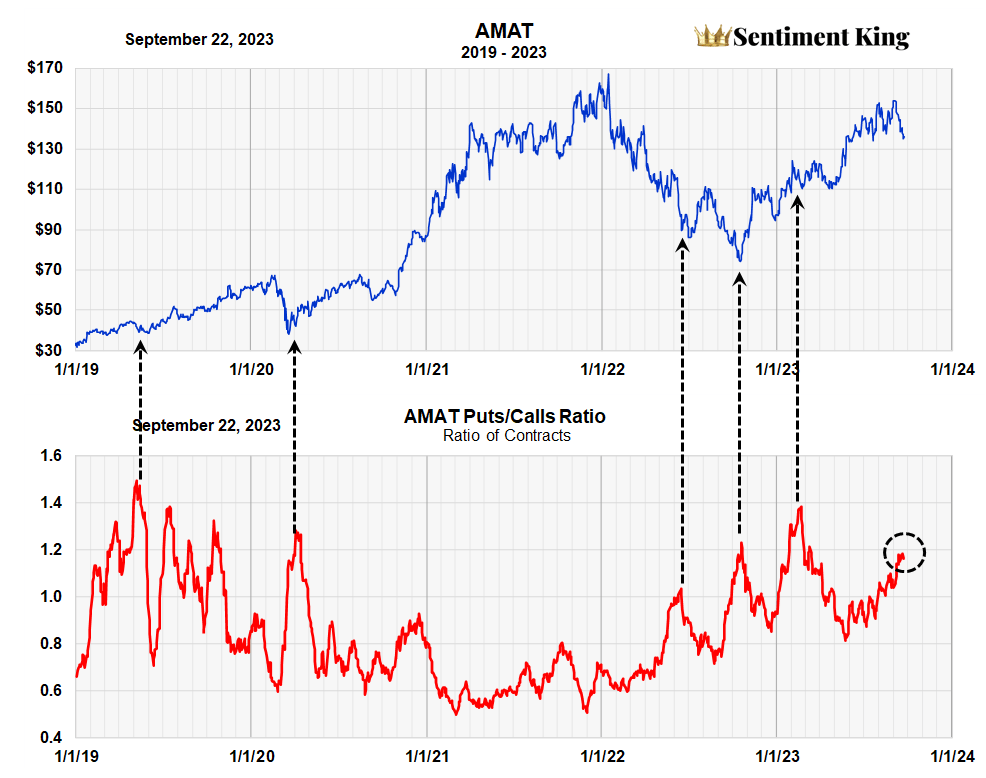
The AMAT “puts to calls” ratio divides the amount of money going into put options by the amount going into call options. The P/C indicator was developed by Martin Zweig in 1972 for the entire stock market but it has value in forecasting many individual stocks, too. We calculate the ratio over twenty days to get a long-term perspective.
The 20-Day "Puts to Calls" Ratio of AMAT (The Sentiment King)
The indicator is based on the theory of contrary opinion. When too many investors expect the price to go up, they purchase calls and the “puts to calls” ratio goes low. This normally occurs at a high point in the price.
When they expect prices to decline, they purchase more “puts” and the ratio goes up. This usually occurs right before prices go higher.
We've indicated periods of high ratios with black arrows, and you'll notice they usually occur at price lows. Further, notice how low ratios occurred when the price of AMAT hit highs in 2021. We've indicated the current ratio of 1.2 with a black circle, which is historically a very high ratio.
The current high ratio is a positive indicator for higher AMAT prices. We believe one can expect higher AMAT prices until more investors become convinced that prices are headed higher and begin to buy more “calls.”
AMAT's Intermediate-Term Relative Strength (RSI) Suggests Higher Prices
Most technicians use technical analysis for short-term trading; we don’t. We adjust the parameters to reflect intermediate to long-term trends. We usually show the longer-term, technical picture using five-year charts like the one shown below.
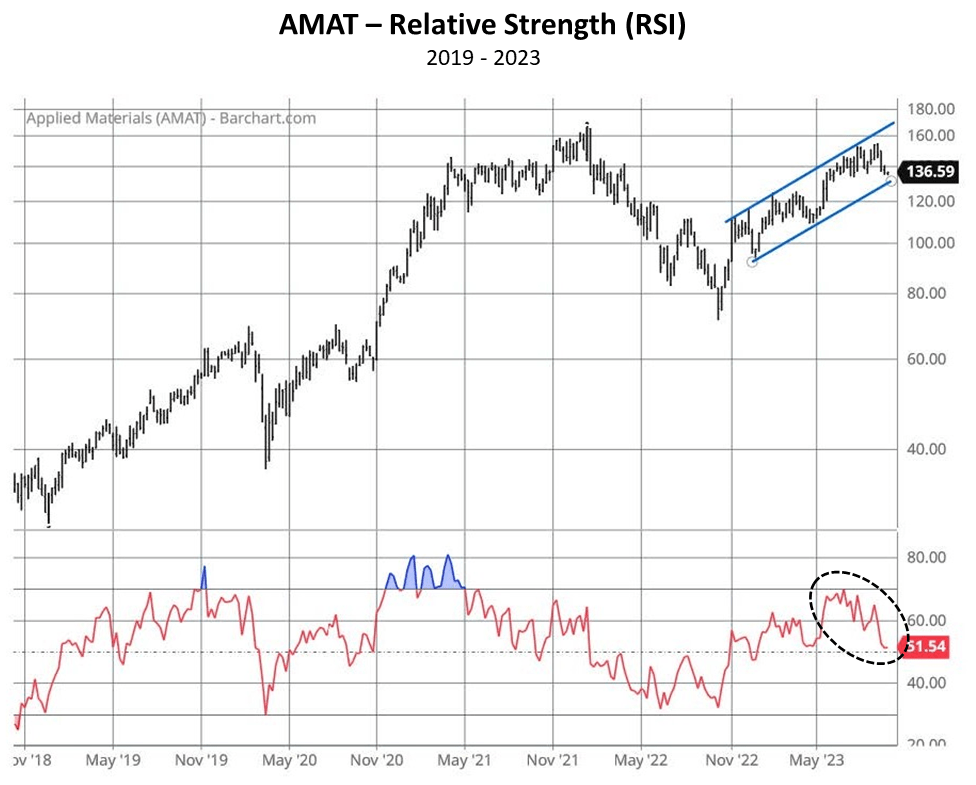
The relative strength index ((RSI)) is a momentum indicator used in technical analysis. It measures the speed and magnitude of a security's recent price change to help evaluate overvalued or undervalued conditions. The indicator was developed by J. Welles Wilder Jr. in his 1978 book, New Concepts in Technical Trading Systems.
The relative strength index (RSI) is a momentum indicator used in technical analysis. It measures the speed and magnitude of a security's recent price changes to help evaluate overvalued or undervalued conditions. We adjust the RSI parameters to measure intermediate- to long-term trends. Traditionally, an RSI reading of 70 or above indicates an overbought situation and a reading of 30 or below indicates an oversold condition. It can also indicate securities that may be primed for a trend reversal or pullback in price, and therefore help determine when to buy and sell. The indicator was developed by J. Welles Wilder Jr. in his 1978 book, New Concepts in Technical Trading Systems. (The Sentiment King)
We've circled with a black Oval the rapid drop in the RSI from 70 to 50 that occurred during a very small three-week decline in the price of AMAT. The tight parallel trading band is indicated by the blue trendlines. To us, this is a strong technical indication that the intermediate-term price trend is still higher.
Intermediate-Term AMAT Bollinger Bands Confirm High Level, Tight Trading Range
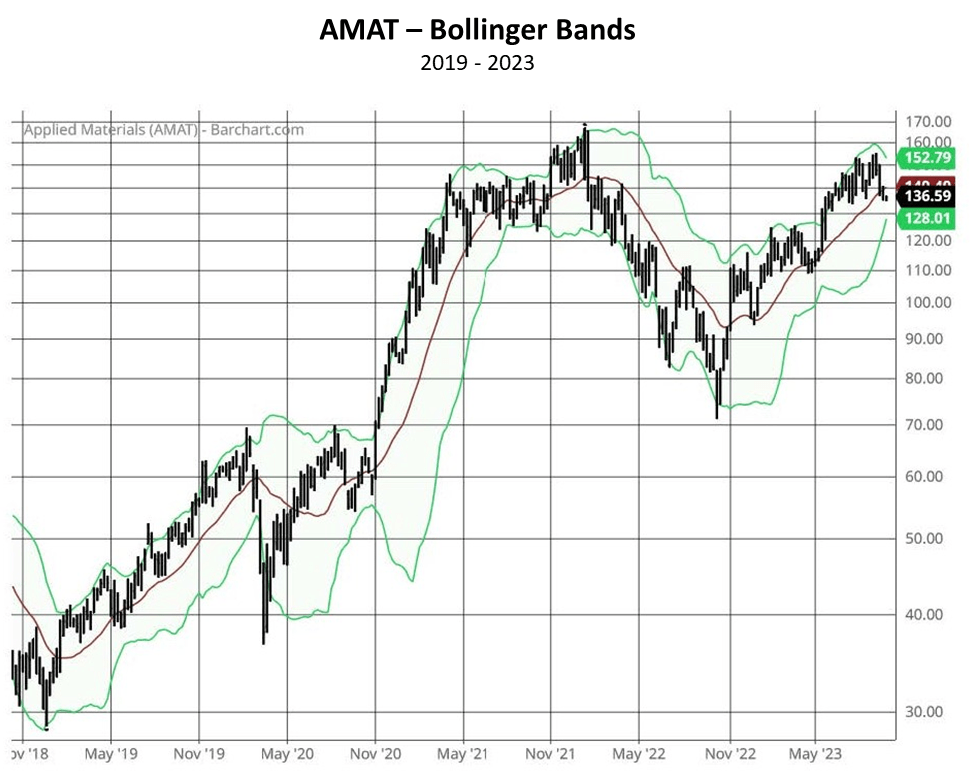
Bollinger bands are another wonderful technical indicator if properly used. A visual picture of them, like the one shown below, tells you a lot about them. They provide a market technician with a price envelope (green lines) that widen or contract as the volatility of the stock changes. The green line has become a wonderful changing point of support or resistance.
Bollinger Bands provide a market technician with a price envelope (green lines) centered around a moving average that widens or contracts as the volatility of the stock changes over time. The green lines become statistically reliable points of support or resistance. We are long-term oriented, so we adjust the Bollinger Band parameters to measure intermediate to long-term trends of the market. (The Sentiment King)
In the Bollinger Band chart, notice how close the current price is to the lower green line. This means one can expect to support the precious decline just a little more. This confirms the conclusion we came to studying the RSI - that any correction in AMAT will be small and of short duration.
AMAT’s On Balance Volume Is Strong
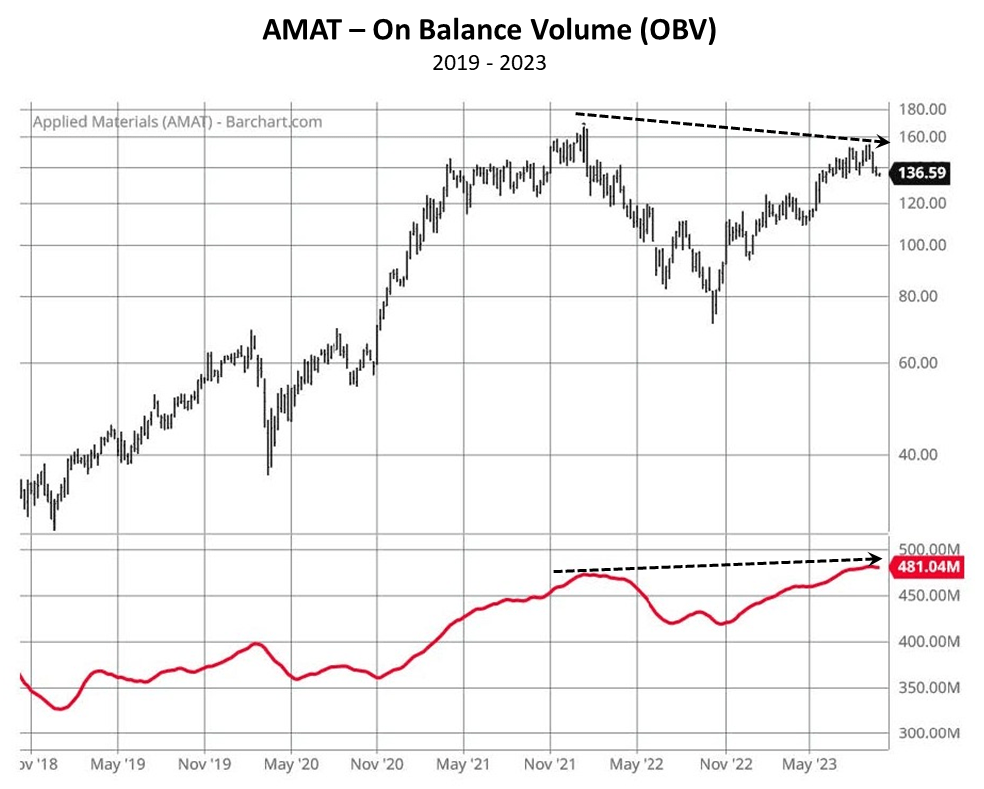
On balance volume integrates a stock's volume numbers with the stock’s price. It keeps track of whether a stock’s price is rising on growing volume and declining on contracting volume, or the reverse. It was pioneered by market technician Joe Granville in the 1970s. The chart below shows the intermediate to long-term OBV situation with AMAT.
On-balance volume (OBV) is a momentum indicator that uses volume flow to predict changes in a stock’s price. It keeps track of whether a stock’s price is rising on increasing volume and declining on contracting volume, or the reverse. Joseph Granville introduced OBV in his 1963 book “New Key to Stock Market Profits.” Granville felt volume was the key force that drove markets and designed OBV to predict major moves in the markets based on volume changes. He believed that when volume rises sharply without a significant change in the stock's price, the price will eventually jump higher, or decline sharply. (The Sentiment King)
It's always a positive sign when the OBV curve goes to new highs before the price curve like we have in the current situation. It shows more volume going into AMAT as prices rise and then coming out as the price declines. This is another strong technical indicator suggesting higher AMAT prices.
Summary
We believe AMAT is headed higher based on the strength of three classic technical indicators, and one classic sentiment Indicator.
The sentiment indicator is the "puts to calls" ratio, which shows a very high level of ‘put’ buying. This almost always occurs prior to a major price advance.
The three positive indicators are, on balance volume (OBV), the relative strength index ((RSI)) and the tight configuration of intermediate-term Bollinger Bands. These last three not only suggest higher prices but also that any price correction prior to an advance will be mild.
For further details see:
Applied Materials: Ready To Move Higher (Technical Analysis)