BHIL - Archer-Daniels-Midland: Watching The Grass Grow Could Turn Out To Be Profitable
2023-04-16 23:33:52 ET
Summary
- Archer-Daniels-Midland is engaged in trading agricultural commodities and processing them.
- With its strong capital allocation policy and significant earnings - both increasing - ADM could outpace the market in the long term even against tight margins and strong competition.
- Based on my dividend discount model valuations, there appears to be potential for undervaluation.
Investment thesis
Archer-Daniels-Midland Company (ADM) is known in the investment community for its track record of increasing dividends for many consecutive years. A recent shift in capital allocation meaning that ADM now returns cash to shareholders primarily via buybacks - with a large authorization remaining to buy back even more shares - coupled with and backed by increasing profitability could present a buying opportunity right now.
Business overview
ADM is a food processing company based in Chicago, US. Food processing is the process of turning raw agricultural products into food. In the case of ADM, the business is centered around producing ingredients such as sweeteners, flours, flavours, colours, oils etc. - what the industry refers to as "primary food processing". This is opposite to "secondary food processing" where the ingredients are turned into ready-to-eat food by other food companies. Hence, ADM is part of the overall food supply chain. ADM is active in more than 200 countries around the world and is one of the largest companies within the food industry.
ADM's operations are classified into three reportable segments:
- Agricultural Services and Oilseeds
- Carbohydrate Solutions
- Nutrition
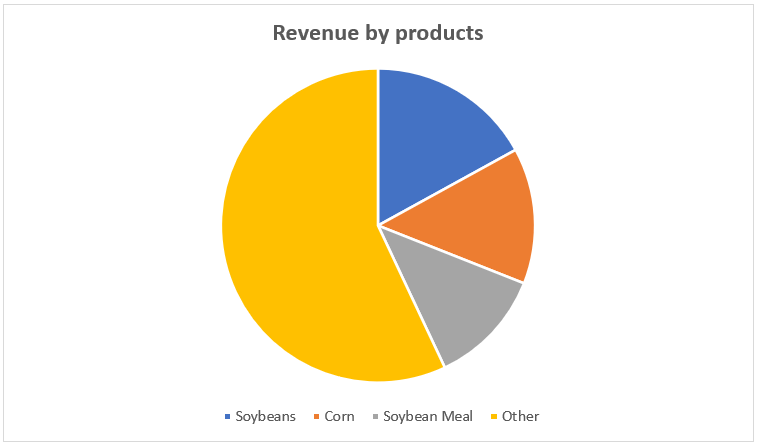
Only three products (or the processing thereof) account for more than 10 % of revenue each, suggesting a diversified business:
Author's presentation, data from most recent company10-K
Financials: ADM's most recent quarter
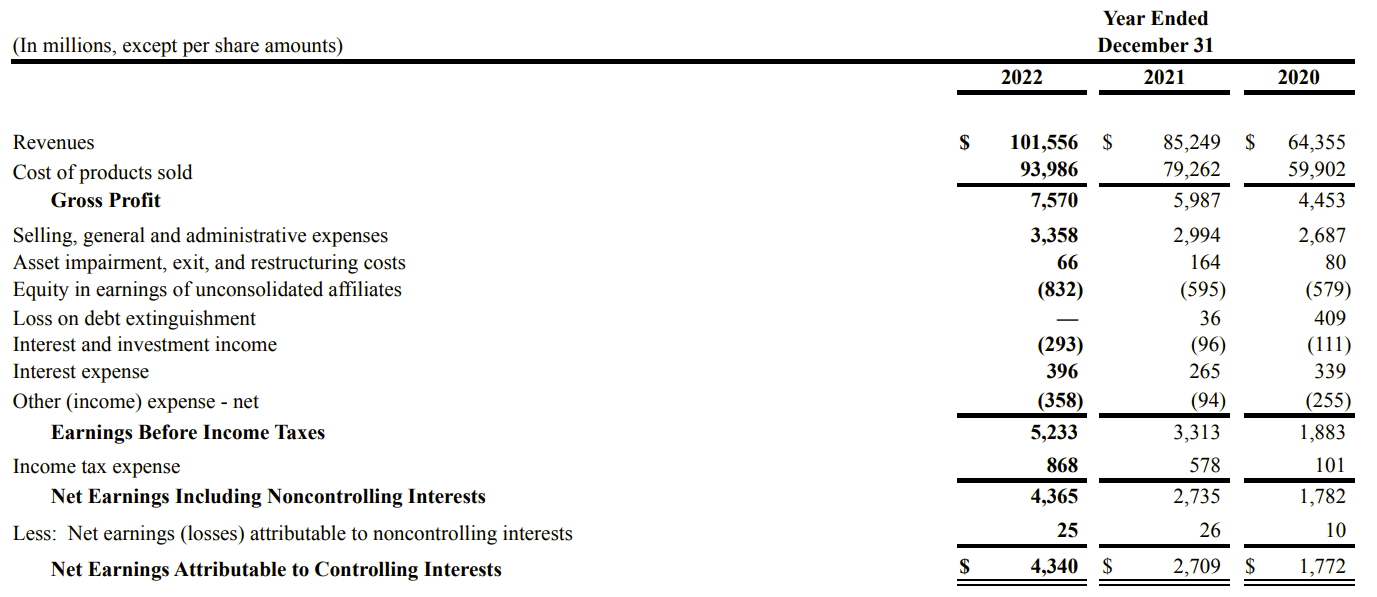
On 26 January 2023 , ADM reported its latest quarterly earnings (full-year 2022 results), beating consensus estimates in terms of EPS and revenue. EPS came in at $7.85, up from $5.19 the year prior. Revenues were $101,556 million against $249 million for 2021.
Seeking Alpha
On 14 February 2023 , the company filed its 10-K. In spite of what the company labelled "challenging external forces" in the global food industry, the main growth for the year came within the company's services in the business segments Nutrition and Carbohydrates Solutions. Net earnings for the company increased from $2,709 million to $4,340 million.
In its 10-K, ADM summed up its results as follows:
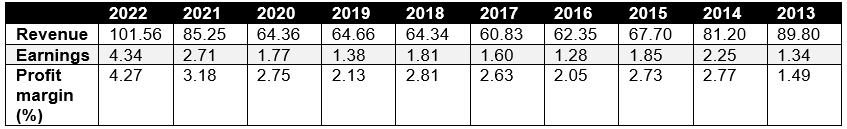
If we zoom out and look at top-line and bottom-line development for the past several years, it would suggest that ADM has only recently been able to grow as revenue has been stagnant since 2013 with the exception of last year:
Author's presentation, data from company 10-K
However, both profit margins and earnings have risen significantly during the period. This would suggest that while management hasn't "chased" top-line growth, it has been able to grow the profitability of the company substantially. As I will discuss later, this has allowed management to continually raise direct cash returns to shareholders. One initiative which supports this assumption is one of ADM's recent corporate strategies (labelled "Productivity" in CEO Juan R. Luciano's letter to shareholders ). With this initiative, the company asked employees around the world to identify ways to optimize working capital and monetize assets. They called it the "Billion Dollar Challenge" internally, and indeed in 2022 alone it accounted for $1.6 billion in additional cash made by the company. This is an example of how the data we see is based upon actual business activities undertaken (recently) by ADM.
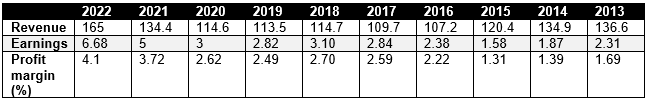
One of ADM's largest competitors is the privately held US company Cargill. The impression of a relatively stagnant revenue that ADM's long-term numbers left is shared by those of Cargill. Cargill's revenue in 2021 was also almost the same as in 2013, with a "spike" in 2022. The development of earnings and profit margins also resembles that of ADM - suggesting that both competitors are doing more or less equally well and following market fluctuations:
Author's presentation, data from Bloomberg.com, Statista.com, Internationalleatermaker.com and Washingtonpost.com
One recent strategy ADM has adopted in the race against competitors is labelled " 1ADM " or the "1ADM business transformation". It focuses on improving capabilities within - amongst others - grain merchandising and procurement. It remains to be seen whether this strategy - along the "Productivity" initiatives - are enough to keep ADM growing its margins and results (as I will also be discussing further below). But management seems intent on pushing for it.
Shareholder returns
Historically, ADM's capital allocation policy has focused heavily on dividends - which I will examine in further detail later. Recently, however, attention has shifted somewhat to buybacks (in line with general tendencies).
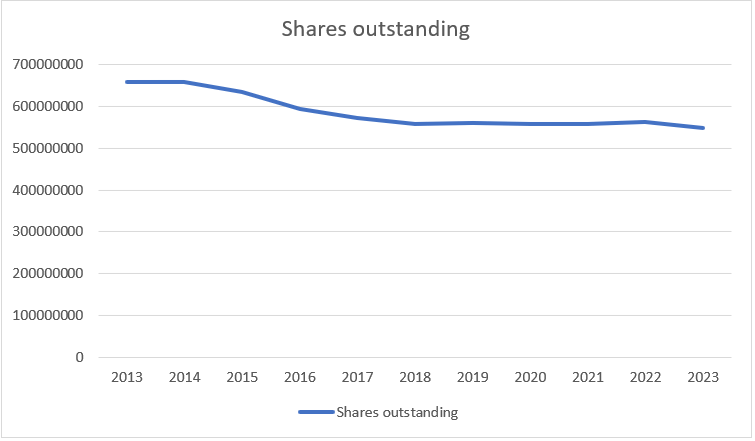
During 2022, ADM bought back $1.45 billion worth of shares, reducing the share count from 562,166,572 (2021 10-K) to 548,008,680 (2022 10-K), equaling a "buyback yield" of ~2.5 %. Currently, ADM has authorization remaining to buy back a further 87.8 million shares - or approximately 16 % of shares outstanding. This program expires by the end of 2024.
Prior to 2013, ADM's number of shares outstanding was more or less stagnant, suggesting that ADM is fairly new to having a consistent buyback policy (perhaps because of its dividend policy). Since then, ADM has maintained a much more consistent policy to return cash to shareholders through buybacks:
Author's presentation, data from company 10-K filings
In my opinion, the very high remaining authorization (16 %) and the evident trend to prioritize buybacks (especially now that the multiple is around 10x earnings) is very attractive.
As previously noted, ADM traditionally has focused largely on buybacks in terms of their capital allocation policy.
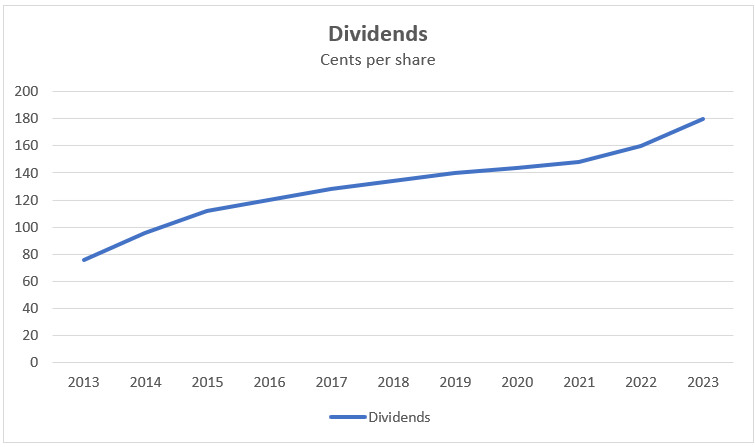
Based on having declared a dividend of $0.45 for the past quarter, ADM's full-year dividends should come in at $1.80 per share. This puts the current dividend yield at approximately 2.2 %.
ADM is a dividend aristocrat - meaning, among other things - that it has increased its dividend for at least 25 consecutive years. Presently, ADM has increased its dividend for 50 straight years (and so has just made it onto the so-called "dividend kings" list).
Author's presentation, data from Nasdaq.com
In order to assess the sustainability of the shareholder returns, attention should be paid to the company's free cash flow and how the free cash flow develops relative to the shareholder returns.
ADM lends itself poorly to a traditional analysis of free cash flow. If we look at free cash flow for just the past 5 years, the record looks rather "suspicious" with free cash flow being negative in the billions for some years:
Author's presentation, data from company 10-K filings
The reason for this is that ADM adopted a GAAP rule in 2018 that requires it to account for something called "Deferred consideration in securitized receivables". Broadly speaking, it means that ADM sells their accounts receivable to a holding subsidiary - which has a negative impact on reported cash flow numbers retroactively without it necessarily being as negative as it appears.
Because of this, and for the purposes of this analysis, I will settle for analyzing the company earnings against the shareholder cash returns. This is not optimal: Companies don't pay their owners in earnings; they pay them in cash. At the same time, we know from initiatives like the aforementioned "Billion Dollar Challenge" that ADM is concerned with optimizing cash flow and cash utilization. But with this caveat, let's look at the development:
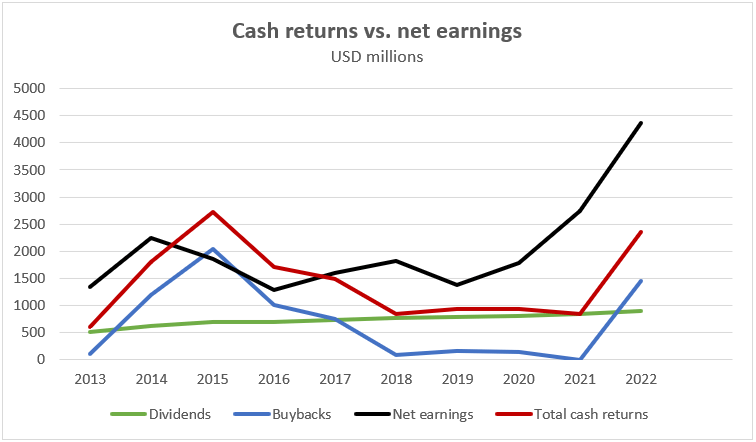
For the full year 2022 , ADM generated approximately $4,340 million of net earnings. ADM spent $899 million on dividends, and $1,450 million on buybacks. This puts the total cash returns for the year at 2,349 - well below net earnings.
Between 2013 and 2022, ADM has gone from producing $1,342 million to $4,365 million of net earnings. The below graph shows the development of net earnings versus cash shareholder returns for the period:
Author's presentation, data from company 10-K filings
As illustrated in the graph, ADM generally generates more free cash flow than it distributes to shareholders - with the black line mostly well above the red line. I regard this as a positive as it speaks to the sustainability of the current distributions. As noted previously, there has been a recent shift in the company's allocation focus - with a heavy spike in buybacks following a flat period during and just before the COVID pandemic, and with the dividend increasing only steadily (as usual). If this trend continues - which again it might with a lot of buyback authorization remaining - it might be a catalyst for future dividend growth as shares are retired (and dividends otherwise accrued on those shares are saved).
Valuation
For the purposes of this analysis, I'll use the dividend discount model ((DDM)) to assess the per-share value of ADM. Three variables are included in this valuation: The current dividend yield, the expected growth rate ((CAGR)), and the required rate of return (for which I will use a rate of 9 %, somewhat in line with the return of the general stock market). Because of the inherent limitations to the simple DDM formula (which I will describe along the way), I will be providing a bull, bear and base case scenario to shed light on the possible value range.
"Bull case" scenario
For the bull valuation I will be applying the DDM in its simplest form using the metrics described above.
On 26 January 2023, ADM declared a dividend for the quarter of $0.45 per share. Assuming the quarterly dividend remains at this level for the entirety of 2023, the annual dividend comes in at $1.80 per share.
ADM has raised its dividend by an average 6.15 % for the past 5 years. For the purposes of this valuation, I'll assume a forward-looking growth somewhat higher at 7.5 %. The justification for this is in the fact that ADM has been able to raise their margins quite substantially, and most recently raised the dividend an entire 12.5 % (from 2022 to 2023).
As stated, I will use a 9 % discount rate.
With the above input, each share of CSX - using the dividend discount model outright - is estimated to be worth $120. At its current price level just under $80, ADM appears significantly undervalued. The challenge with applying the DDM in its simplest form as done here is that it is assuming a perpetual stream of dividends ('eternal' dividend growth at a specific rate), and even small deviations from the growth rate can cause substantial variations to assumed value. Therefore, I will be walking through a modified valuation assumption based on potential (or likely) deviations in the dividend growth rate in particular - labelled here as a 'bear case' scenario.
"Bear case" scenario
In attempting to measure the effects of future deviations in the dividend growth rate, I will apply the ' H-Model ' which is a modification to basic DDM formulas. The H-Model accounts for the (inevitable) change in dividend growth rate by assuming a decline in the dividend growth over time:
Corporatefinanceinstitute.com
Where:
The first part of the equation calculates the value of the stock based on the long-term (low) growth rate. The second part considers the value of the stock based on the initial high rate period - and the values are then added together:
Hence, the H-Formula accounts for deviations in future dividends by assuming that the initial (current) dividend growth rate will only be sustainable for a while, and after a while - the 'half-life' - it will drop down to a sustainable (lower) level and thereby modelling a more realistic picture of the value than the basic DDM formula.
Just as there are limitations to basic DDM formulas, one caveat with the H-Model is that it requires more assumptions than basic formulas. This again means that the modelled valued relies on subjective estimates. This is worth keeping in mind when comparing the modelled values from the applied formulas.
For the purposes of this valuation, I will assume that the 7.5 % dividend growth used in the basic formula will be the 'initial short-term high dividend growth rate'. Or in the other words the current but not sustainable growth rate (in the long term). I will assume that the company is able to maintain this rate for 12 years, meaning after that I assume dividends will decrease to a lower growth rate. This lower growth rate - the 'sustainable long-term dividend growth rate' - I will assume is 6 %, a number I believe resembles a mature 'cash cow' type company, at least considering the effects that buybacks can have on the ability to raise dividends in the long run. For the required rate of return I will use 9 % as in the case of the basic DDM.
With the above assumptions, the modelled value per-share is $69. So under these more bearish assumptions, ADM appears a little overvalued at current prices.
"Base valuation" and commentary
To 'challenge' my calculations in connection with the bullish/bearish valuations according to the DDM models above, I would like to analyze valuation multiples and compare them to past levels. ADM's 5-year average P/E ratio (fiscal) is ~15. This compares to a current P/E ratio of ~10. Assuming a value in accordance with the 5-year average, each stock should trade at ~118. This happens to be very much in line with the valuation arrived at in the optimistic "bull case" scenario described above. A look at historic P/E levels beyond the 5 year range would also suggest a valuation at almost historic lows:
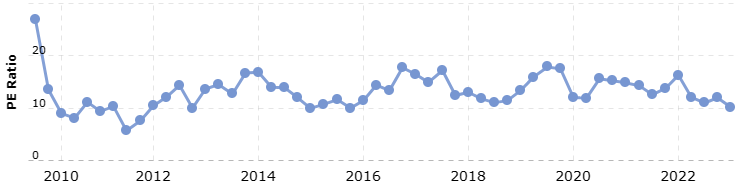
However, this is based on high recent earnings. If you apply 2021's earnings to a "normal" P/E of ADM, the situation almost reverses, and the stock looks more fairly valued.
In conclusion, the valuation methods used here suggest a 'valuation range' between $69 and $118 per share. With the stock trading at ~$80, it would suggest the stock is potentially undervalued if you believe - in particular - that i) management is able to keep raising the dividend to a larger extent than previously, which ii) could be made possible by the substantial buybacks and increasing cash flows that we're seeing.
Risks to consider
One risk in particular I would like to touch upon is the fact that - as illustrated under the Business Overview - profit margins for ADM are relatively tiny. This typically would suggest substantial (price) competition in the sector. Over the past 10 years, margins range from ~1.5 % to ~4 % (although in a general uptrend). With a profit margin of 4 %, with every 100 dollars made, only 4 are kept for investors (the company), whereas the other 96 are eaten up by costs. For comparison, according to numbers from the Bureau of Transportation, ADM's profit margin is equivalent to that of the US airline industry in the 3rd quarter of 2022 which was 4.1 %. I'm not meaning to suggest trouble on the horizon here, but when you think of the airline industry, I'd suggest you don't think of healthy profit margins and steady businesses. Warren Buffett quoted Richard Branson in his 1996 letter to shareholders on the topic. Someone had asked Richard Branson how to become a millionaire with him replying: "There's really nothing to it. Start as a billionaire and then buy an airline". To ADM's credit, though, it has existed since 1902 and to my understanding has turned a profit more or less ever since. The point to be made here is that thin margins make a business vulnerable to adverse developments. There isn't much of a cushion to soak up increasing costs, more expensive financing, unexpected costs etc. without it hurting the ability of the company to keep rewarding shareholders. Going forward, we'll have to see how management copes with shifting demands and the pressure to keep margins as high as they've been in 2022 (or higher). One area that ADM focuses on is an area that has been identified as a fast-growing category of products: plant-based proteins. To meet demand, ADM has taken the concrete steps to expand their facility in Decatur, Illinois, completed a facility in Serbia, and entered a partnership with Benson Hill ( BHIL ) to provide ultra-high protein soy for food. Perhaps supplying products like this in great demand will help the cause.
Another risk you should keep in mind is that ADM is a commodities (trading) business. Revenues are correlated with underlying commodities prices to a substantial degree (soybeans, for example). This means that if you buy into ADM, you expose your portfolio to the development of commodities markets. These prices may fluctuate wildly - and depending on developments that can be extremely difficult to forecast. If you're uncomfortable with this, you may want to give ADM a pass.
Conclusion: Final thoughts
In conclusion, ADM is a great capital allocator that returns cash to shareholders to a significant extent. I regard this a positive. The underlying business shows an uptrend in profitability (earnings and profit margins) in spite of a relatively stagnant top-line. I regard this ability as a sign of a strong business - and coupled with the cash returns a strong shareholder friendly business. Recent corporate activities as outlined above - including one labelled " Productivity " aimed at better monetizing assets and one labelled "Innovation" have helped this development, and with its management seems intent to keep it going. I believe the main risks associated with ADM are the facts that ADM relies heavily on commodities trading (volatile markets) operating with slim margins. This exposes the year-to-year results, and even small price changes could have a significant impact on the company's ability to make money - and keep returning it to shareholders.
The valuation models used here show a 'value range' that suggests potentially substantial undervaluation depending on assumptions. Having said that, ADM is clearly a "long term play" if you're interested: ADM has raised its dividend for 50 consecutive years, and perhaps that's the same kind of persistency and long term view that is required to make a satisfactory return off of ADM.
For these reasons, I rate ADM stock a Buy.
For further details see:
Archer-Daniels-Midland: Watching The Grass Grow Could Turn Out To Be Profitable