ARDC - ARDC: Shrinking NAV And Distributions Over Time
Summary
- The ARDC fund provides high income by investing in high yield bonds, senior loans, and CLO securities.
- It pays an attractive 10.5% current yield.
- However, with 5 Yr average annual returns of only 2.0%, the fund appears to be paying more than it earns.
- I would avoid this fund.
The Ares Dynamic Credit Allocation Fund, Inc. ( ARDC ) is a closed-end fund that focuses on providing high income by investing in high yield bonds, senior loans, and CLO securities. While the fund pays an attractive 10.5% current yield, it appears to be paying more than it earns in total returns; a prime example of a 'return of principal' fund.
Fund Overview
The Ares Dynamic Credit Allocation Fund, Inc. is a closed-end fund ("CEF") that aims to provide high levels of current income and capital appreciation. ARDC has $310 million in assets and charged a 2.82% expense ratio in 2021.
Strategy
The ARDC fund primarily invests in a dynamic portfolio of senior secured loans to non-investment grade companies, high yield corporate bonds ("junk" bonds), and securities issued by collateralized loan obligations ("CLOs"). ARDC cap investments in CLOs to less than 40% of the fund's managed assets, and no more than 10% of the fund may be invested in subordinated or equity tranches of CLO securities.
The ARDC fund may use leverage through debt and preferred securities to enhance returns.
ARDC leverages the credit originations and investment platform of Ares Management Corporation ( ARES ), a global alternative investment manager focusing on credit, private equity, real estate, and infrastructure assets.
Portfolio Holdings
Figure 1 shows some asset allocation details on ARDC's portfolio as of November 30, 2022. About half of the portfolio is invested in bonds, 15% in loans, 22% in CLO debt tranches, and 9% in CLO equity tranches.
Figure 1 - ARDC portfolio details (areaspublicfunds.com)
In terms of credit quality, 10.6% of the portfolio is rated BBB, 39.3% is rated BB, 31.4% is rated B, and 22.0% is CCC or unrated.
Finally, in terms of sectors, the largest exposure in the ARDC fund is CLOs at 30.7%. Energy is second at 10.6%, while Gaming & Leisure is third at 8.8%.
Note, CLOs are built from a wide basket of leveraged loans, so they are typically well diversified from an industry and issuer perspective. However, CLO equity tranches are considerably more risky than debt tranches, as they are first loss / residual tranches put in place in the CLO structure as credit enhancement for the debt tranches.
Investors who want to learn more about CLOs and their investment risks may wish to read some of my recent articles on Oxford Lane Capital ( OXLC ) or search online .
Returns
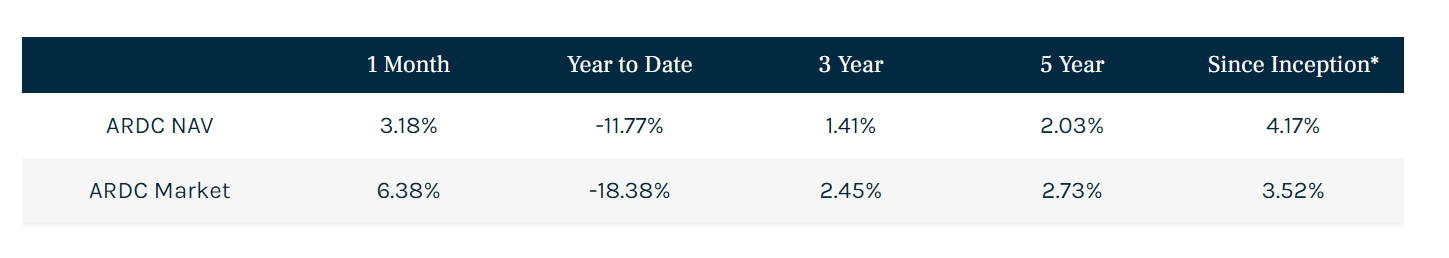
ARDC has delivered historically mediocre returns, with 3 and 5Yr average annual returns of 1.4% and 2.0% of NAV respectively, to November 30, 2022 (Figure 2). Since inception, the fund has delivered average annual returns of 4.2%.
Figure 2 - ARDC historical returns (arespublicfunds.com)
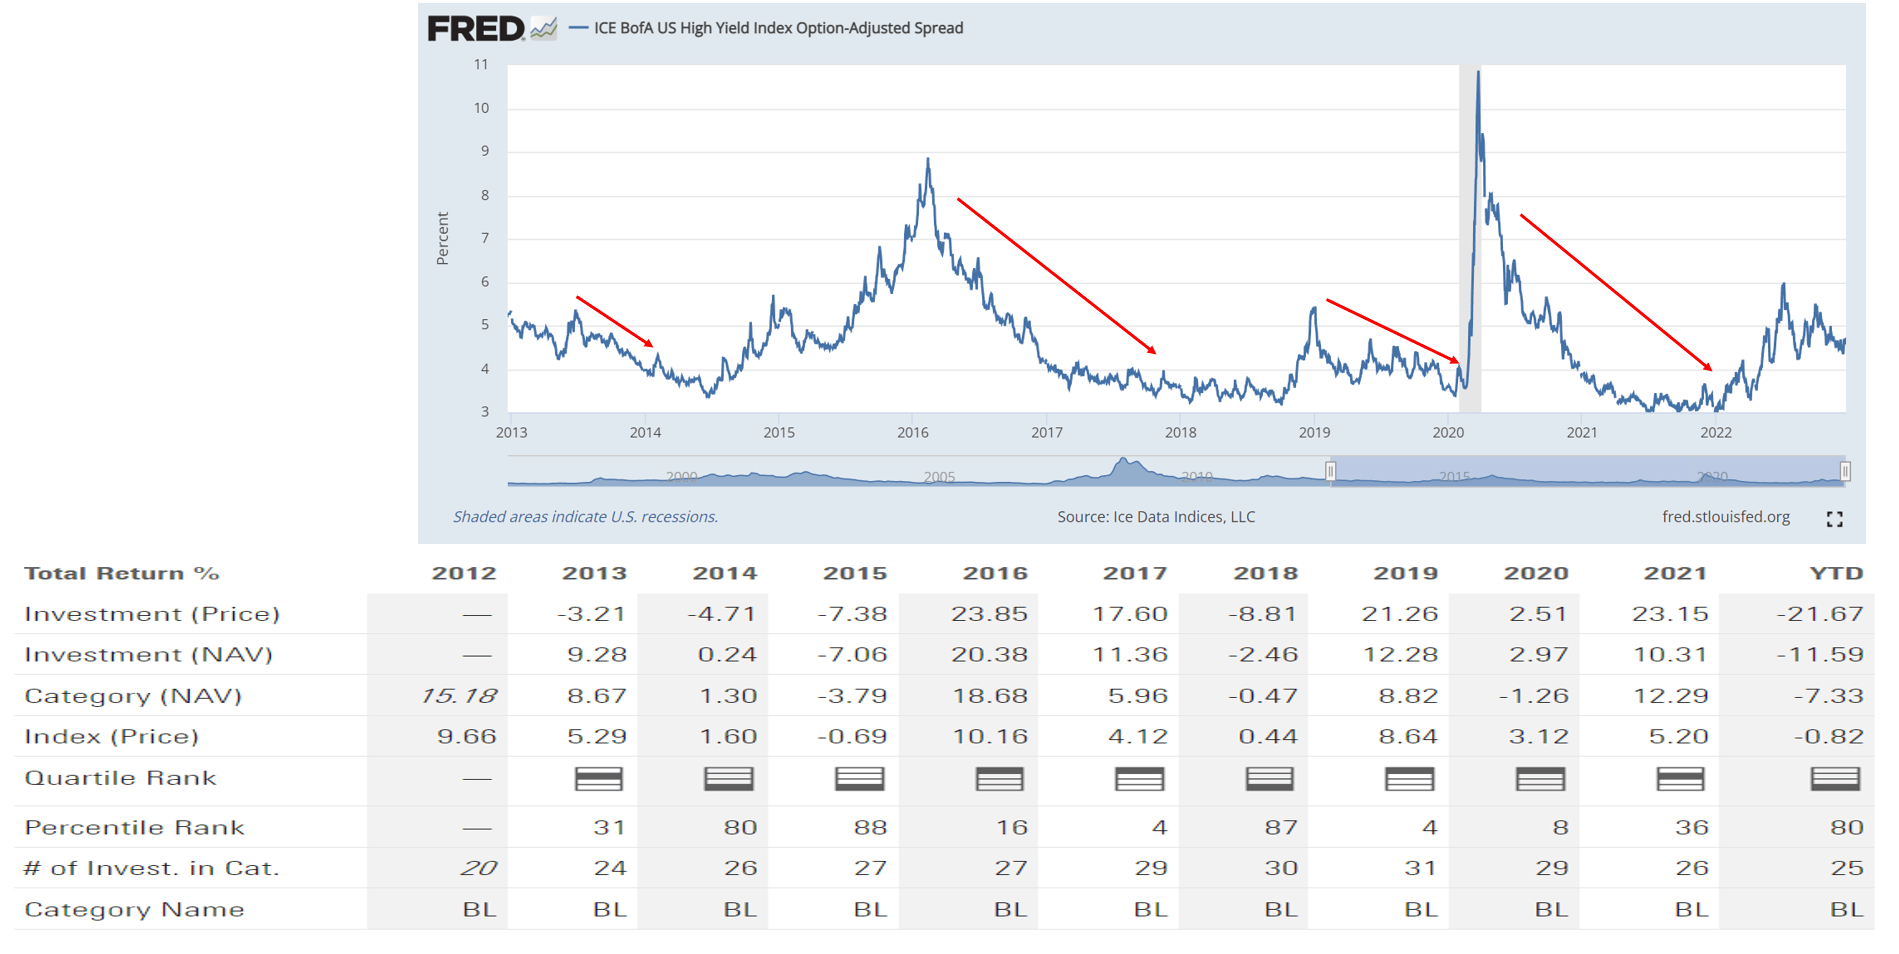
Viewed on an annual basis, we can see ARDC's performance has been very volatile. From 2013 to 2022, 4 out of the 10 years have been flat to negative (Figure 3).
Figure 3 - ARDC annual returns vs. high yield credit spreads (Author created with returns from Morningstar and high yield spreads from St. Louis Fed)
If we line up the fund's performance with high yield credit spreads, we can see that ARDC's strong performance years are when credit spreads are declining after a major bout of economic weakness: 2016 benefited from a tightening of credit spreads post the global growth scare of 2015; 2019 benefited from a tightening of spreads after President Trump's trade war in 2018; and 2020/2021 benefited from the tightening of spreads after the COVID pandemic.
Given my view that the global economy is heading into an economic slowdown / recession in 2023, I believe ARDC may deliver subpar performance in the coming year.
Distribution & Yield
The major attraction for the ARDC fund is its distribution. ARDC current pays a monthly distribution of $0.1025 / share, which annualizes to a 10.5% yield on market price or 9.1% on NAV.
Return Of Principal Fund Leads To NAV Declines Over Time
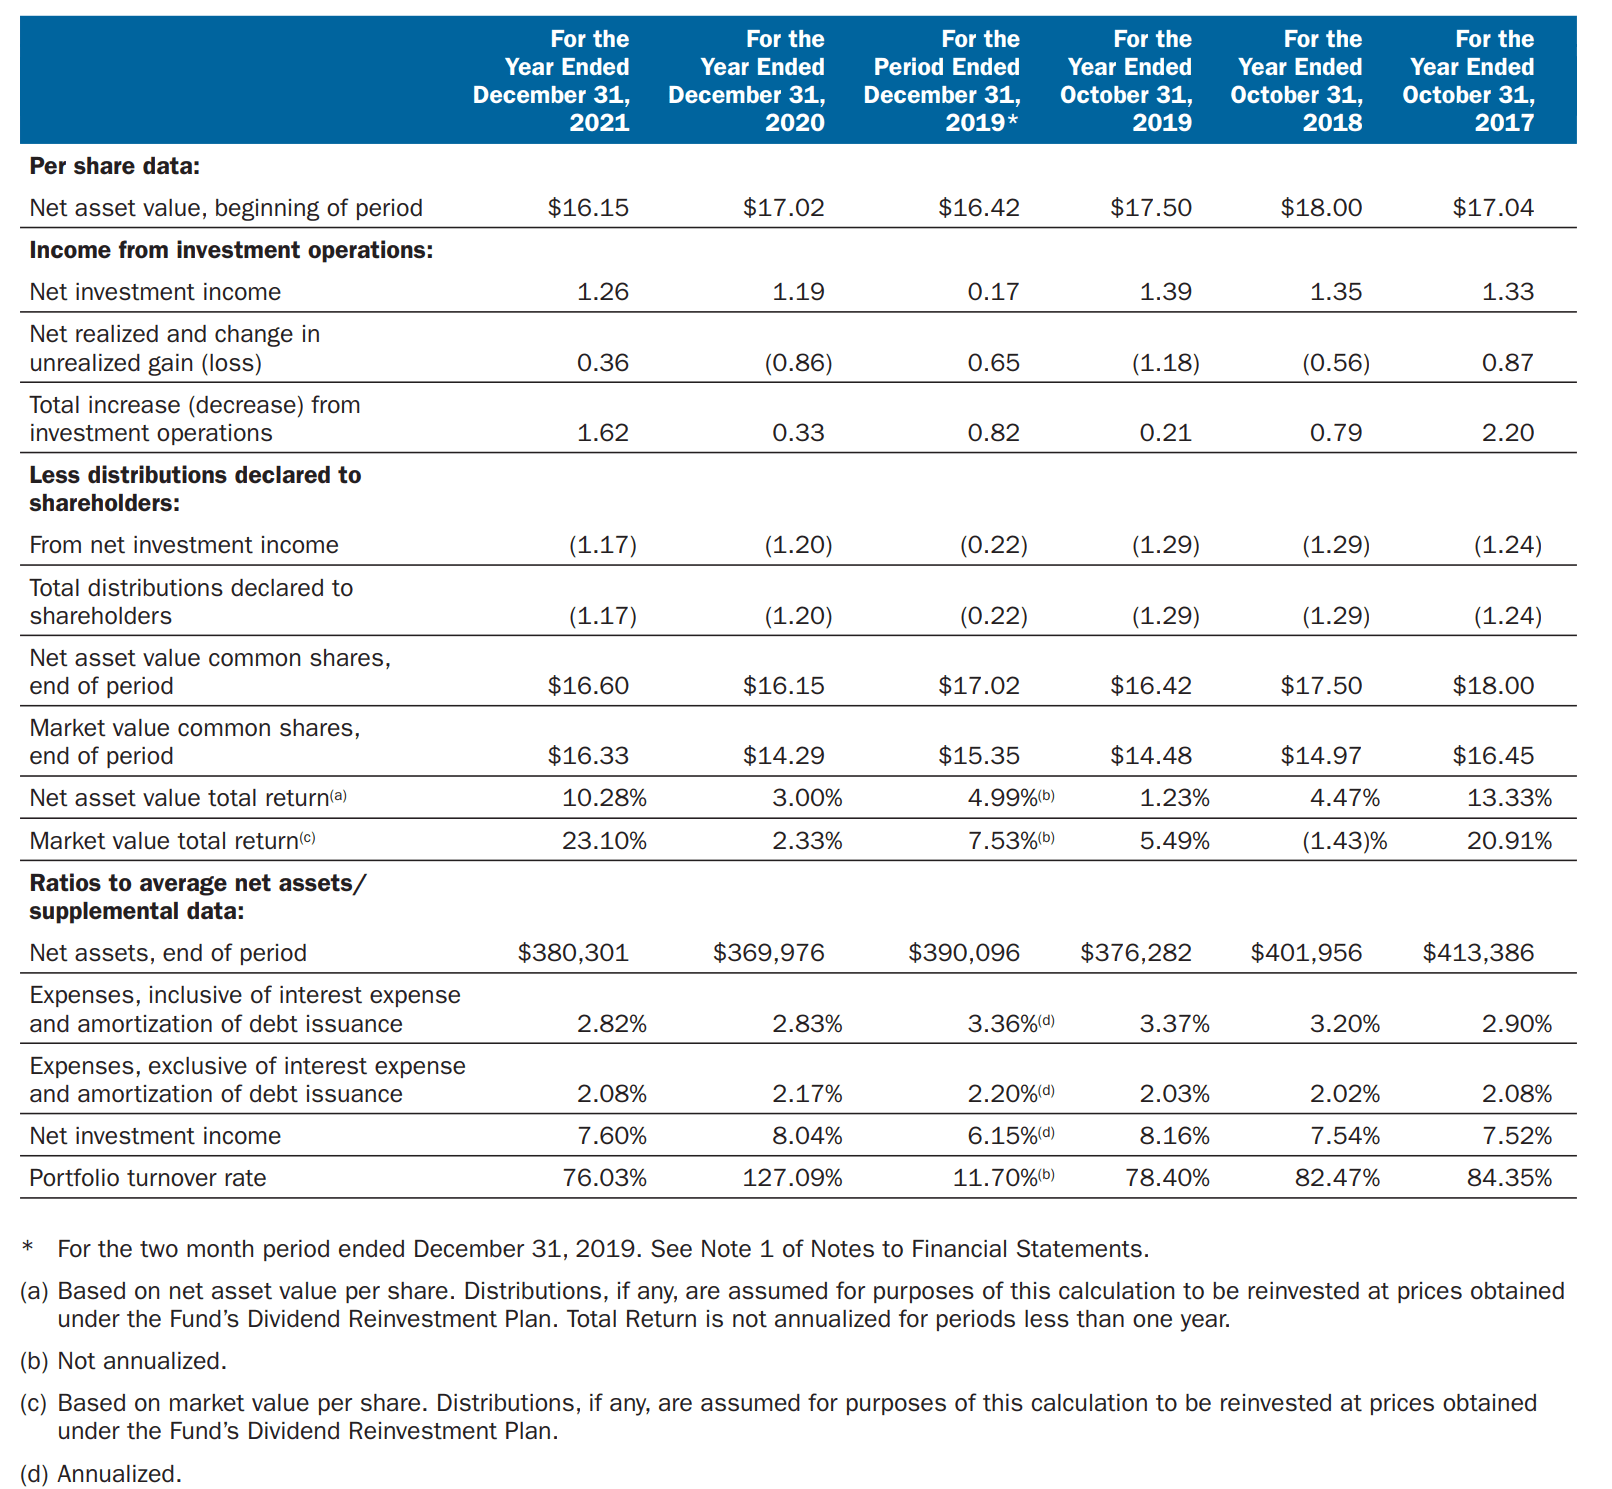
However, ARDC appears to be an example of a 'return of principal' fund that pays more than it earns. While the fund's distribution to investors have historically been funded by net investment income ($5.36 in NII from 2018 to 2021 vs. $5.17 in distributions), the worry is that realized and unrealized gains have totalled -$1.59 over the 5 years, taking the NAV from $18.00 at the end of 2017 to $16.60 at the end of 2021 (Figure 4).
Figure 4 - ARDC financial summary (ARDC 2021 annual report)
'Return of principal' is a term I recently picked up after reading Eaton Vance's whitepaper on the topic. I think it's an excellent yardstick to measure and compare CEF funds.
The best measure of whether a fund has earned its distributions is the change in its NAV net of distributions. Regardless of how distributions are characterized, if a fund's NAV increases, the fund earned its distribution. If not, the fund did not earn its distribution - the economic concept of return of principal.
The problem with return of principal funds is that over time, the fund has less income earning assets to support its distributions. Hence at the end of several years, both the market price (which normally tracks the NAV) and the distributions will have declined.
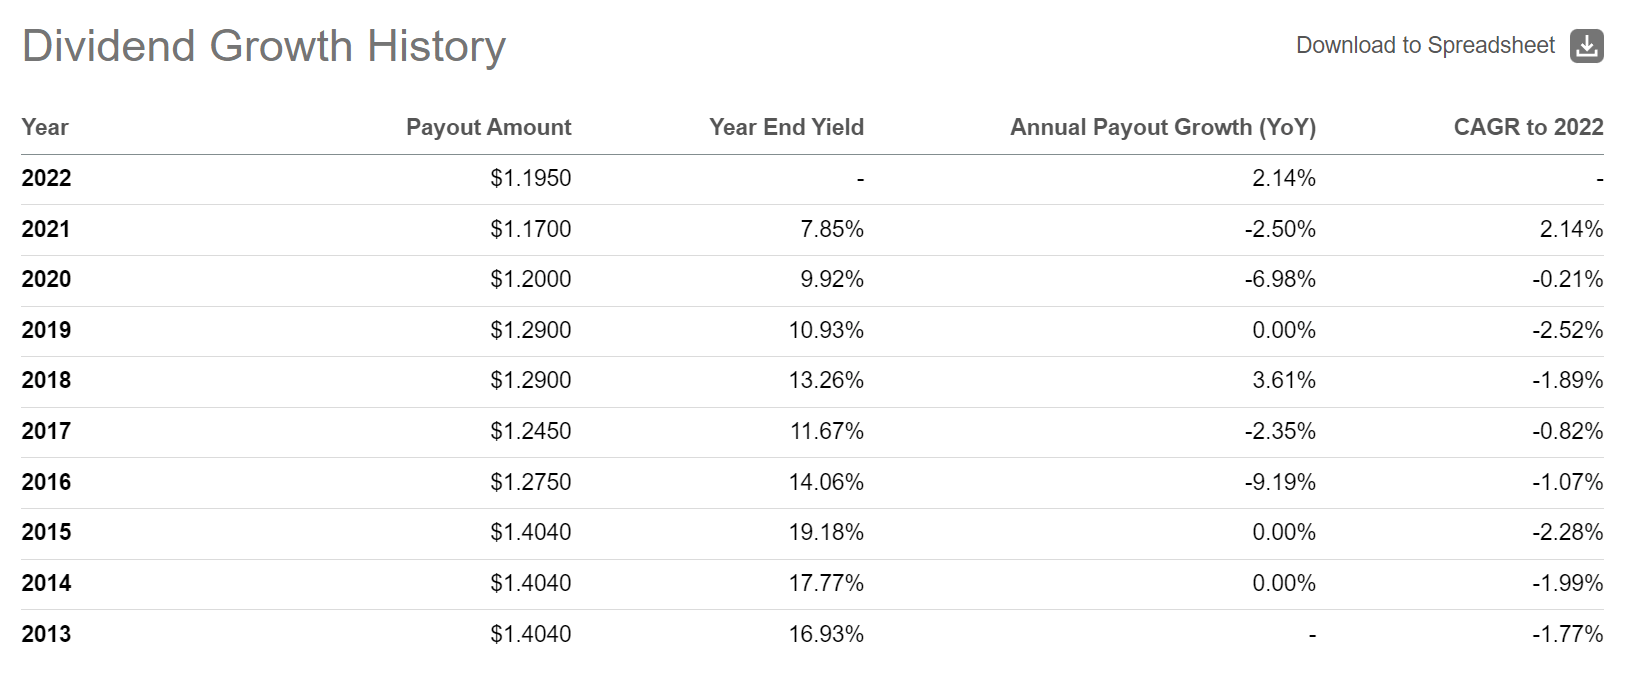
For ARDC, we can see this problem in effect. The fund began its life in 2013 paying $1.404 / share in distributions. However, the annual distribution has been cut to $1.195 in the past year (Figure 5).
Figure 5 - ARDC historical distributions (Seeking Alpha)
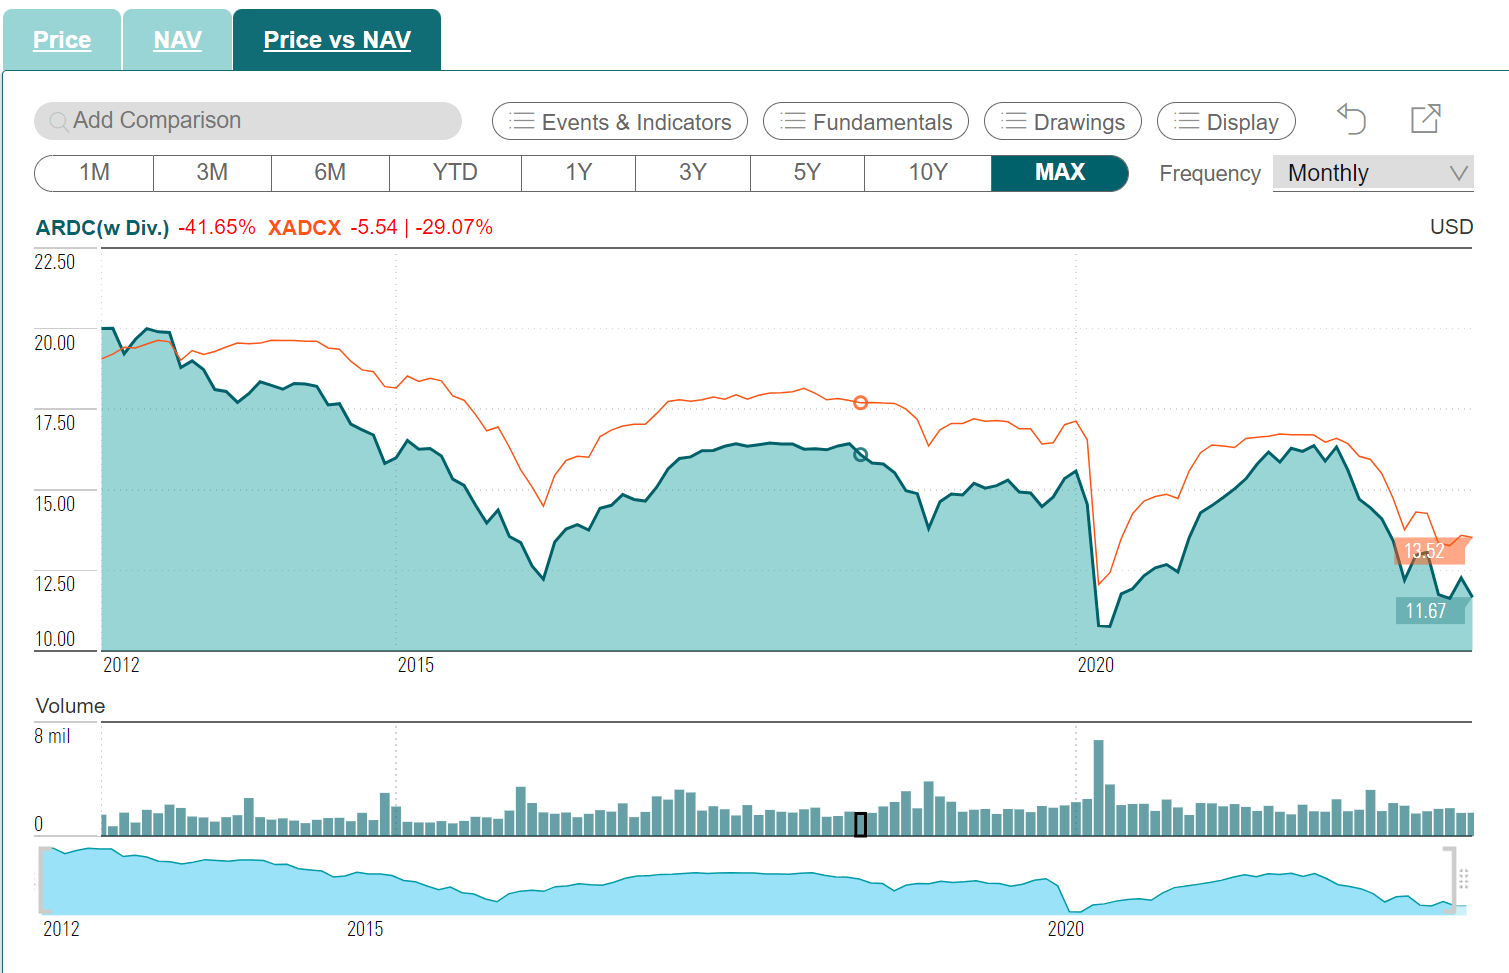
Likewise, the fund's share price has declined from $20 at inception to $11.67 recently, tracking the decline of the NAV from $18.50 to $13.52 (Figure 6).
Figure 6 - ARDC's share price and NAV have declined from inception (cefconnect.com)
So at the end of the day, investors lose both income and principal.
Conclusion
While ARDC pays an attractive 10.5% current yield, investors are cautioned to look beyond the yield and consider total returns, which includes NAV and market price declines over time. When looking at the trend of ARDC's NAV and distributions, the fund appears to be a prime example of a 'return of principal' fund that pays out more than it earns. Hence, I would avoid this fund.
For further details see:
ARDC: Shrinking NAV And Distributions Over Time